1Faculty of Medicine, University of Medical Sciences of Villa Clara (UCM-VC).
Polyclinic “Marta Abreu” Santa Clara, Villa Clara, 50100 Cuba.
2Provincial Meteorological Center of Villa Clara, 50100 Cuba.
3Faculty of Health Technology and Nursing (FTSE), University of
MedicalSciences of Villa Clara (UCM-VC), 50200 Cuba.
4 Central University “Marta Abreu” of Las Villas. Villa Clara, 50100 Cuba
5Specialist in Hygiene and Epidemiology. Assistant Director of Hygiene and
Epidemiology, XX Anniversary Polyclinic. Villa Clara, 50100 Cuba.
Corresponding author email: rigoberto.fimia66@gmail.com
Article Publishing History
Received: 25/11/2022
Accepted After Revision: 25/05/2023
The use of predictive models for the evolution of the pandemic is of great help in decision-making by the authorities. The fundamental objective of this work was to obtain through the Regressive Objective Regression, predictions of confirmed cases of COVID-19 in the Marta Abreu Teaching Polyclinic of the city of Santa Clara. In short-term modeling the model was significant at 19.7% with an error of 0.12. Variables dichotommics, saw tooth and saw tooth inverted and risk returned in 1.3, and 12 cases the trend is negative and not significant. We can conclude that a perfect result was obtained in the long term with the ROR methodology. The short-term ROR model depends on the cases of COVID-19 in the previous case, 3 cases back and 12 cases back without significant trend. The long-term model is perfect and depends on the cases of COVID-19 in 12 cases ago, with a negative trend.
Coronavirus; Covid-19; Mathematical Modeling; Ror.
Fernández F. M, Rodríguez R. O, Duarte R. F, Llanes C. O, González M. Z, Valledor M. I. N, Román D. A. Predictive Modeling of COVID- 19 Confirmed Cases Using Regressive Objective Regression Methodology. Biosc.Biotech.Res.Comm. 2023;16(2).
Fernández F. M, Rodríguez R. O, Duarte R. F, Llanes C. O, González M. Z, Valledor M. I. N, Román D. A. Predictive Modeling of COVID- 19 Confirmed Cases Using Regressive Objective Regression Methodology. Biosc.Biotech.Res.Comm. 2023;16(2). Available from: <a href=”https://bit.ly/2U8EBeg“>https://bit.ly/2U8EBeg</a>
INTRODUCTION
The world has been involved in an epidemiological crisis caused by the new SARS-CoV-2 coronavirus that gave rise to the contagious and deadly disease COVID-19 (Cortellis, 2020; WHO, 2020).Since the first cases were diagnosed in the city of Wuhan, capital of Hubei province, China, the number of infected and dead people has been increasing, which led the World Health Organization (WHO) to declare a pandemic state for COVID-19 on March 11, 2020 (Sun et al., 2020; Wang et al., 2020; WHO, 2020).
According to the Research Group of Mathematical Models in Science and Technology: Development, Analysis, Numerical Simulation and Control (MOMAT) of the Institute of Interdisciplinary Mathematics of the Complutense University of Madrid, Spain, the application of the Be-CoDiS (Between-Countries Disease Spread) model in the analysis of the COVID-19 pandemic numerically projects that this viral phenomenon will be present for a prolonged period of time in the world (Ivorra & Ramos, 2020).
Several models and methodologies have been applied in the study, analysis and modeling of COVID-19 in the world, where they stand out: Ordinary Differential Equation of First Order (EDOPO), linear type; Simple linear Regression model; Generalized Logistic Growth Model (GLM); Structured Susceptible-Exposed-Infected-Removed (SEIR)/SEIR model; the Bayesian Probability Mathematical Model; SIRD model (also employed in Cuba); Conceptual Model and the Simulation Model, among many others (Rue et al., 2017; Simpson et al., 2017; Osés et al., 2021a,b ).
The main objective of the present research was to obtain, by means of the Objective Regressive Regression (ORR) methodology, predictions of confirmed cases of COVID-19 in the “Marta Abreu” Teaching Polyclinic in the city of Santa Clara, Villa Clara province, Cuba.
MATERIAL AND METHODS
In the research, the daily data from January to March corresponding to the year 2021 of the number of positive cases to COVID-19 in the Teaching Polyclinic “Marta Abreu” of Villa Clara Cuba were used, from a total of 3 294 cases evaluated in consultation, 58 were positive.
The prognosis was carried out with the use of the methodology of Regressive Objective Regression (ROR) which has been implemented in different variables such as viruses and bacteria circulating in Villa Clara province. Objective Regressive Regression (ORR) modeling is based on a combination of Dummy variables with modeling (ARIMA), where two Dummy variables are created and the trend of the series is obtained; it requires few cases to be used and also allows the use of exogenous variables that make it possible to model and forecast in the long term, depending on the exogenous variable (Osés et al., 2020).
In the ROR methodology, in a first step, dichotomous variables DS, DI and NoC are created, where: NoC: Number of cases of the base, DS = 1, if NoC is odd; DI = 0, if NoC is even, when DI=1, DS=0 and vice versa. Subsequently, the module corresponding to the Regression analysis of the statistical package SPSS version 19.0 (IBM Company) is executed, specifically the ENTER method where the predicted variable and the ERROR are obtained. Then the autocorrelograms of the ERROR variable will be obtained, paying attention to the maximums of the significant partial autocorrelations PACF. The new variables are then calculated according to the significant Lag of the PACF. Finally, these regressed variables are included in the new regression in a process of successive approximations until a white noise in the regression errors is obtained.
Ethical aspects: The research was subject to ethical standards, where all the information collected and provided was used only for the stated purpose. It did not involve physical or psychological affectations, in order to be able to generate new knowledge without violating the ethical principles established for these cases. On the other hand, all authors involved in the research, publication and dissemination of the results are responsible for the reliability and accuracy of the results shown (DHAMM, 2013).
RESULTS AND DISCUSSION
The great development acquired by different sciences, such as epidemiology, mathematics, statistics and computer science, has led to the generation of new techniques in emerging and recurrent procedures in the field of biostatistics and bioinformatics (spatial statistics, neural networks and functional data analysis, among others) to describe the importance of mathematical models in infectious diseases (Martí & Caylà, 2009).
Table 1 calculated the descriptive statistics of the risk of contracting COVID-19, the value of zero was assigned if the PCR was negative, and if the PCR was positive, the value of Risk 1; the mean value of this variable corresponds to 19.33 cases with a standard deviation of 12.01 cases.
Table 1. Descriptive statistics of confirmed patients at the “Marta Abreu” Polyclinic. Year 2021
| Descriptive statistic | |||||||||||
| N | Minimum | Maximum | Half | Typ. desv. | |||||||
| Risk COVID-19 | 3294 | .00 | 1.00 | .0176 | .13154 | ||||||
| N valid (according to list) | 3294 | ||||||||||
| Positives MA | 3 | 7 | 31 | 19.33 | 12.014 | ||||||
| N valid (by list) | 3 | ||||||||||
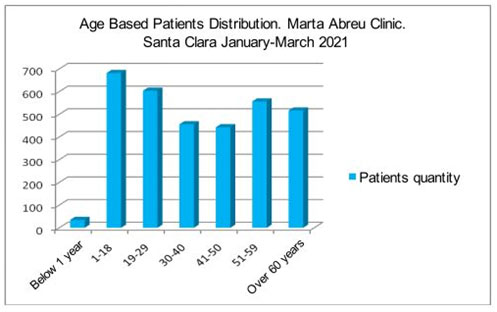
The distribution according to age was irregular, with the highest value corresponding to patients aged 1 to 18 years, followed by those aged 19 to 29 years; children under 1 year of age were also present in the study (Figure 1).
Figure 1: Distribution of patients according to age. January-March 2021
COVID-19 cases were modeled in the short term using the ROR methodology. The model was significant at 19.7% with an error of 0.12 (Table 2). As can be seen in the table the Durbin-Watson statistic is close to 2, so we are in the presence of an adequate explanation of the variance using this model.
Table 2. Summary of the model using Objective Regressive Regression
| Summary of modelc,d | |||||
| Model | R | R squaredb | R-squared corrected | Standard error of estimation | Durbin-Watson |
| 1 | .197a | .039 | .037 | .12352 | 2.009 |
|
a. Predictor variables: Lag12Risk, Lag3Risk, Lag1Risk, DI, SD, NoC. b. For regression through the origin (the model with no intersection term), R-squared measures the proportion of the variability of the dependent variable explained by regression through the origin. The above CANNOT be compared with R-squared for models that include an intersection. c. Dependent variable: RiskCOVID19 d. Linear regression through the origin The ROR modeling of predictions obtained yielded very significant results for the study of the COVID-19 pandemic in the “Marta Abreu” Teaching Polyclinic, with a Fisher’s F of 22 significant at 100% (Table 3), thus proving that the sample variances are not equal. |
|||||
Table 3. Analysis of variance of the model for COVID-19
| ANOVAc,d | ||||||
| Model | Sum of squares | gl | Quadratic mean | F | Sig. | |
| Regression | 2.019 | 6 | .336 | 22.052 | .000a | |
| Residual | 49.981 | 3276 | .015 | |||
| Total | 52.000b | 3282 | ||||
Predictor variables: Lag12Risk, Lag3Risk, Lag1Risk, DI, SD, NoC.
This total sum of squares has not been corrected for the constant because the constant is zero for regression through the origin.
Dependent variable: COVID-19 risk.
Linear regression through the origin
The ROR model in question is made up of the following variables, DI and DS which are dichotomous variables, saw tooth DS and inverted saw tooth DI and of the regressed risk in 1,3 and 12 cases (Lag1 Risk; Lag3 Risk and Lag12 Risk). The trend is negative and not significant (Table 4).
Table 4. Results of the application of the ROR model plus trend Coeficientesa,b
| Model | Unstandardized coefficients | Typified coefficients | Sig. | |||
| B | Error típ. | Beta | ||||
| t | ||||||
| DS | .016 | .005 | .091 | 3.316 | .001 | |
| DI | .016 | .005 | .091 | 3.315 | .001 | |
| Tendency | -2.591E-6 | .000 | -.039 | -1.136 | .256 | |
| Lag1Risk | .116 | .017 | .116 | 6.719 | .000 | |
| Lag3Risk | .057 | .017 | .057 | 3.326 | .001 | |
| Lag12Risk | .065 | .016 | .069 | 3.988 | .000 | |
| a. Dependent variable: COVID-19 risk.
b. Linear regression through the origin |
||||||
Next, the model was run only with Lag12 Risk in order to have a long-term valuation by entering the Step POSITIVE variable in the model, obtaining a model that explains 100% of the variance of the model (Table 5).
Table 5. Model run with Lag12 in the long term Model summaryc,d
| Modelo | R | R squaredb | R-squared corrected | Standard error of estimation | Durbin-Watson |
| 1 | 1.000a | 1.000 | 1.000 | .00000 |
1.696
|
Predictor variables: Step2133, Step1656, Step1655, Step1652, Step1644, Step1336, Step75, Step74, Step14, Step POSITIVE, DS, DI, Lag12Risk, NoC.
For regression through the origin (the model with no intersection term), R-squared measures the proportion of the variability of the dependent variable explained by regression through the origin. The above CANNOT be compared to R-squared for models that include an intersection.
Dependent variable: COVID-19 risk.
Linear regression through the origin
Table 6 shows the analysis of variances using Fisher’s test (F). In the results, Fisher’s F can’t be seen, which infers that we are dealing with a perfect model, i.e., the result of the variables is equal.
Table 6. Analysis of Variance of the model for COVID-19 ANOVAc,d
| odel | Sum of squares | gl | Quadratic mean | |
| 1 | Regression | 52.000 | 14 | 3.714 |
| Residual | .000 | 3268 | .000 | |
| Total | 52.000b | 3282 | ||
Predictor variables: Step2133, Step1656, Step1655, Step1652, Step1644, Step1336, Step75, Step74, Step14, Step POSITIVE, DS, DI, Lag12Risk, NoC.
This total sum of squares has not been corrected for the constant because the constant is zero for regression through the origin.
Dependent variable: COVID-19 risk.
Linear regression through the origin
Epidemic modeling is historical and has been refined with the advancement of science and technologies, demonstrating the essential role of mathematics in indicating where the disease may move and giving suggestions on how to decide (Guinovart, 2020). COVID-19 disease has been recognized as a global threat, in which predictive models for the epidemiological trend of its prevalence and incidence have been being used worldwide (Osés et al., 2018; Prades, 2020; Osés et al., 2021c).
In the present research article, predictions were exposed for the cases confirmed to COVID-19 in the “Marta Abreu” Teaching Polyclinic. The increase in the number of children and adolescents infected by the new coronavirus in the mentioned health area showed that they are as susceptible to the disease as the rest of the population. Children and older adults should follow the same biosecurity measures as those prescribed by the Ministry of Public Health for the entire population. Coinciding with the daily reports of MINSAP, the highest number of cases was reported in females (MINSAP, 2021).
The results of the present investigation coincide with those obtained in a similar study conducted in the province of Cienfuegos by Medina (2020); where logistic and exponential models (specifically the Gompertz growth model) were used to obtain estimates. They state that the statistical prediction models obtained gave very significant results for the study of the COVID-19 pandemic in Cuba, which also agrees with the results obtained by other authors in this regard (Medina et al., 2020).
CONCLUSION
The application of ROR modeling provides Public Health authorities and decision makers with information on the short- and medium-term behavior of variables of great interest for understanding the spread of SARS-CoV2. With the use of the ROR methodology, it was possible to predict the future number of positive cases in the “Marta Abreu” health area, making this model a valuable practical tool for correct and timely decision making.
REFERENCES
Cortellis, T.M. (2020). Disease Briefing: Coronaviruses. A Clarivate Analytics solution. 3.23.2020. 51 pp. In: https://clarivates.com/wp.content/uploads/dlm_uploads/2020/01/CORONAVIRUS-REPORT-23.3.2020.pdf
DHAMM (Declaración de Helsinki de la AMM). (2013). Principios éticos para las investigaciones médicas en seres humanos. 64ª Asamblea General, Fortaleza, Brazil, octubre. World Medical Association, Inc. – All Rights reserved. 9 pp.
Guinovart, D.R. (2020). Intervención en la mesa redonda. Sitio de la Presidencia de Cuba. http://www.cubadebate.cu/noticias/2021/04/27/lo-afirman-los-expertos-pronosticos-de-la-covid-19-en-cuba-son-desfavorables/
Ivorra, B., Ramos, A.M. (2020). Validation of the forecasts for the international spread of the coronavirus disease 2019 (COVID-19) done with the Be-CoDiS mathematical model. Reporte Técnico Grupo MOMAT, Universidad Complutense de Madrid, 1–14. DOI: http://www.doi.org/10.13140/RG.2.2.31460.94081
Martí, C.K.G., Caylà, J.A. (2009). Modelos matemáticos utilizados en el estudio de las enfermedades transmisibles. Rev Esp Salud Pública 83 (5). Disponible en: https://www.mscbs.gob.es/biblioPublic/publicaciones/recursos_propios/resp/revista_cdrom/vol83/vol83_5/RS835C_689.pdf
Medina, M.J., Cortés, C.M., Cortés, I.M., Pérez, F.A., Manzano, C.M. (2020). Estudio sobre modelos predictivos para la COVID-19 en Cuba. Medisur 18: 431-442. Disponible en: http://medisur.sld.cu/index.php/medisur/article/view/4703
MINSAP. (2021). Para prevenir y enfrentar el nuevo coronavirus, la participación popular es esencial. Disponible en: https://salud.msp.gob.cu/para-prevenir-y-enfrentar-el-nuevo-coronavirus-la-participacion-popular-es-esencial/
Osés, R.R., Carmenate, R.A., Pedraza, M.A.F., Fimia, D.R. (2018). Prediction of latitude and longitude of earthquakes at global level using the Regressive Objective Regression method. Advances in Theoretical & Computational Physics (Adv Theo Comp Phy) 1: 1-5.
Osés-Rodríguez, R., Osés-Llanes, C., Fimia-Duarte, R., González-Meneses, A., & Iannacone, J. (2020). Pronostico de la COVID-19 por medio de la metodología de Regresión Objetiva Regresiva en Villa Clara y Cuba. The Biologist 18 (2). Disponible en: https://doi.org/10.24039/rtb2020182754
Osés, L.C., Osés, R.R., Fimia, D.R., Zambrano, G.M.P., Wilford, G.F.M. (2021a) Comparison of lineal ROR vs Nonlinear Weibull model for COVID-19 in Iraq. Himalayan Journal of Applied Medical Sciences and Research 2: 88-96.
Osés, R.R., Osés, C.L., Fimia, D.R., González, M.A., Iannacone, J., Bruna, S.T., Wilford, G.F.M. (2021b). Age Prediction for COVID-19 Suspects and Contacts in Villa Clara Province, Cuba. EC Veterinary Science 6: 41-51.
Osés, R.R., Fimia, D.R., Osés, L.C., Zambrano, G.M.P., Santos, Z.T.B., González, M.A. (2021c). Forecast of New and Deceased Cases of COVID-19 in Cuba with an Advance of 105 Days. Acta Scientific Veterinary Sciences 3: 31-36.
Prades, E.E., Martin, S.D. (2020). Modelos estadísticos para las predicciones de la COVID-19 en Cuba. Revista Cubana De Higiene y Epidemiología 57. Disponible en: http://www.revepidemiologia.sld.cu/index.php/hie/article/view/303/275
Rue, H., Riebler, A., Sarbye, H., Illian, J.B., Simpson, D.P., Lindgren, F.K. (2017). Bayesian computing with INLA: a Review. Annual Reviews of Statistics and its Applications 4: 395-421.
Simpson, D.P., Rue, H., Martins, T.G., Riebler, A., Sarbye, S.H. (2017). Penalising model component complexity: a principled, practical approach to constructing priors. Statistics Sciences 32: 1-46.
Sun, Z., Thilakavathy, K.T., Kumar, S.S., He, G., Liu, S.V. (2020). Potential Factors Influencing Repeated SARS Outbreaks in China. International Journal of Environmental Research and Public Health 17: 16-33.
Wang, L.S., Wang, Y.R., Ye, D.W., Liu, Q.Q. (2020). A review of the 2019 Novel Coronavirus (COVID-19) based on current evidence. International Journal of Antimicrobial Agents. Doi: 10.1016/j.ijantimicag.2020.105948
WHO. (2020). Conferencia de la OMS. https://www.who.int/docs/default-source/coronaviruse/transcripts/who-audio-emergencies-coronavirus-press-conference-full-and-final-11mar2020.pdf?sfvrsn=cb432bb32

