Associate Professor, DAV College, Sector 10, Chandigarh, India.
Corresponding author email: manjudewan72@gmail.com
Article Publishing History
Received: 04/04/2023
Accepted After Revision: 25/06/2023
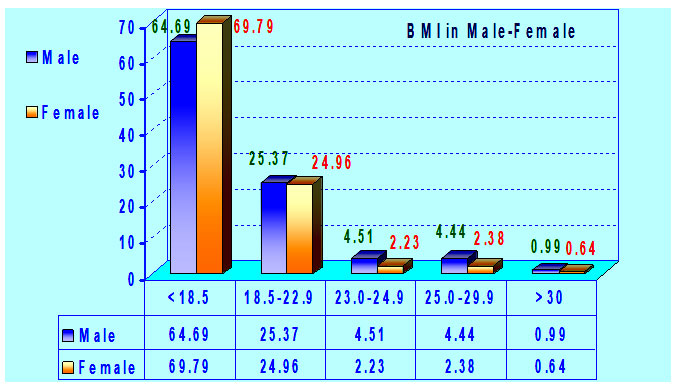
The most useful population-level measure of overweight and obesity is BMI. This measure is same for men and women of all ages. But it should not be thought to be as final factor to calculate the same body fat percentage in different individuals. Various proposed reference values for overweight and obesity exist for BMI, but the combined effect of BMI and BMI for age percentile recommendations is scarce. A total 2048 children participated in the epidemiological survey. According to Body Mass Index in the study, 66.26% subjects were found to be malnourished in the total population. The degree of obesity had been observed as Pre-obese 3.81% and Obese-I 3.81% and Obese-II were 0.88%. Pre-obese, obese-I and obese-II boys were more than the girls. According to BMI-for-age percentile, overall, 6.20% of children and adolescents were at risk of overweight and 4.39% were overweight during health survey while 24.80% are underweight.
BMI, BMI-For-Age Percentile, Obesity, Overweight.
Dewan M. BMI for-Age Percentile As Criteria for Assessment of Obesity in Children and Adolescents. Biosc.Biotech.Res.Comm. 2023;16(2).
Dewan M. BMI for-Age Percentile As Criteria for Assessment of Obesity in Children and Adolescents. Biosc.Biotech.Res.Comm. 2023;16(2). Available from: <a href=”https://bit.ly/2U8EBeg“>https://bit.ly/2U8EBeg</a>
INTRODUCTION
Overweight and obese children can develop obesity in adulthood and can develop diabetes, hypertension and cardiovascular diseases at an early age (Krushnapriya et al 2015). The highest prevalence rates of childhood obesity have been observed in developed countries; however, its prevalence is increasing in developing countries as well (Popkin and Doak, 1998). Females are more likely to be obese as compared to males, owing to inherent hormonal differences (Gupta, 2009). It is difficult to create one parameter for the measurement of overweight and obesity in children and adolescents because there are number of physiological changes in children and adolescents. Depending on the age, different methods to measure a body’s healthy weight are available.
BMI fails to distinguish between fat and fat-free mass (muscle and bone) and may exaggerate obesity in large muscular children. Body mass index (BMI) is a recommended index of obesity by World Health Organization (1996) and is related to various disease risks (Stevens et al, 1998). BMI is the most useful population-level measure of overweight and obesity as it is same for men and women, and for adults of all ages. However, it should not be considered as final parameter to calculate the same body fat percentage in different individuals. Various proposed reference values for overweight and obesity exist for BMI, but the combined effect of BMI and BMI for age percentile recommendations are scarce. Therefore, the primary aim of this study is to compare the validity of BMI and BMI for age percentile as diagnostic tests for sample of 10-19 years old children and adolescents.
MATERIAL AND METHODS
A total 2048 children participated in the epidemiological survey. Children who had participated in the study also underwent the health examination. There were numerous students who remained absent on the test date and on all subsequent make-up sessions. Many parents requested to excuse their children from the test. For interested children, consent form was signed by the parents before starting the survey work. Children those completed all steps of the survey were included and those who missed even a single step excluded. The World Health Organization, U.S. Centers for Disease Control and Prevention and International Obesity Task Force provide separate definitions of overweight and obesity in children and adolescent. Anthropometric measurements including height, weight, and waist and hip circumferences were taken to explore the incidence of obesity and the various factors associated with it.
Body Mass Index (BMI): This measure was used to assess body weight relative to height. Body mass index is a useful tool in both clinical and public health practice for assessing nutritional status of the population.
| Underweight | BMI less than 18.5 |
| Ideal | BMI 18.5-22.9 |
| Overweight | BMI 23-24.9 |
| Obese – should lose weight | BMI 25.0-29.9 |
| Very obese – lose weight now | BMI greater than 30.0 |
BMI-for-Age Percentile: The Centers for Disease Control and Prevention (CDC),2000 suggested the levels of concern for children based on the BMI-for-age percentile as follows:-
Below the 5th percentile : Underweight
5th percentile < 85th percentile : Healthy weight
85th percentile to < 95th percentile : At risk of overweight
95th percentile and above : Overweight
MATERIAL AND METHODS
A total 2048 children had participated in the epidemiological survey. They had also undergone the health examination. There were numerous students who remained absent on the test date and on all subsequent make-up sessions. Many parents requested to excuse their children from the test. For interested children, a consent form was signed by the parents before starting the survey work. Children those completed all steps of the survey were included and those who missed even a single step were excluded. Anthropometric measurements including height, weight and waist and hip circumferences were taken to explore the incidence of obesity and the various factors associated with obesity.
These measures were used to assess body weight relative to height. Body Mass Index is a useful tool in both clinical and public health practice for assessing nutritional status of the population. Underweight: BMI less than 18.5; Ideal BMI: 18.5-22.9; Overweight: BMI 23-24.9; Obese: BMI 25.0-29.9; Very obese: BMI greater than 30.0.
The Centers for Disease Control and Prevention (CDC) 2000 suggested the levels of concern for children based on the BMI-For-Age Percentile as Below the 5th percentile: Underweight; 5th percentile < 85th percentile: Healthy weight; 85th percentile to < 95th percentile: At risk of overweight; 95th percentile and above : Overweight. BMI allows comparison between children of the same sex and age (Connor and Arif ; 2021).
RESULTS AND DISCUSSION
A total 2048 children participated in the epidemiological survey. Out of these 2048 children, 1017 were from urban population and 1031 were from rural population.
According to body mass index in the study, 66.26% subjects were found to be malnourished in the total population. The degree of obesity had been observed as Pre-obese 3.81% and Obese-I 3.81% and Obese-II were 0.88%. (Table-1Graph-1).
Table 1. Prevalence of overweight and obesity according to BMI Categories
| Group/Sub Group | Below 18.5 | 18.5-22.9 | 23.0-24.9 | 25.0-29.9 | Above 30 | |||||
| N | % | N | % | N | % | N | % | N | % | |
| All Data | 1357 | 66.26 | 517 | 25.24 | 78 | 3.81 | 78 | 3.81 | 18 | 0.88 |
According to BMI-for-age percentile, overall, 6.20% of children and adolescents were at risk of overweight and 4.39% were overweight during health survey while 24.80% are underweight.
Overweight children were highest among urban (6.39%) than rural (2.42%). (Table-2 Graph-2).
Table 2. Prevalence of overweight and obesity according to BMI for age percentile Categories
| Group/Sub Group | Under Wt. | Healthy Wt | Risk Ov.Wt | Over Wt. | ||||
| N | % | N | % | N | % | N | % | |
| All Data | 508 | 24.80 | 1323 | 64.60 | 127 | 6.20 | 90 | 4.39 |
Obesity and overweight result from an imbalance in the energy expenditure equation such that either food intake is in excess; energy expenditure is deficit or both. Obesity presently has been properly documented as an ailment in its own right which is preventable through changes in life style especially diet. Obesity is a major determinant of many non-communicable diseases and induces diabetes mellitus and coronary heart disease.
Physiologically, the body weight is constantly changing. Obesity is the result of excessive expansion of adipose tissue mass. This disorder is often accompanied by abnormalities in systemic carbohydrate and lipid metabolism and the secretion and action of insulin alterations thought to reflect diabetogenic effect of obesity. There remain questions about the best diagnostic criteria for this age group.
According to Dietz and Bellizze, 1999, overweight, during childhood and adolescence, is characterized by a body mass index for age (BMI/age) above the 85th percentile and obesity by a BMI/age above the 95th percentile, based on the National Health and Nutrition Examination Survey (NHANES II-III) standards. Other authors say it is possible to adopt absolute BMI limits for specific age groups, during the growth period, without considerably compromising diagnostic specificity or sensitivity (Monteiro et al, 1999). An expert committee in 1997 declared BMI for age to be the principal measure of obesity in childhood. The adoption of regional BMI standards has also been proposed (Anjos et al, 1998).
Diagnostic criteria should be simple, low cost, reproducible and reliable and offer elevated sensitivity and specificity, thus reducing false positive and negative diagnoses. Based on a pool of studies of BMI profiles by age in a number of different countries, including Brazil, proposed limits for overweight and obesity to be applied to the 2 to 20 age group internationally (Cole et al., 2000).
In this study, the prevalence of obesity was more in boys than in girls. It is possible that the Western feminine self-image and fear of obesity were more marked in girls than in boys. Girls as young as 5 years of age care more about their self-image and associate it to weight status. The same has been reported in other studies where boys had higher prevalence of obesity than girls at all ages (Brown et al, 2002 and Huang et al, 2003).
WHO in 1996 stated that BMI values are not dependent on age or gender. But, they may not narrate equally to levels of obesity in diverse populations (certain racial groups in Africa and Asia) as a result of differing body-proportions. Also, the BMI index may not accurately reflect the fatness levels of people with builds falling far outside the average. As mentioned earlier active persons like sportsmen and sportswomen, will tend to have BMI levels of “overweight” or even ‘obese’, due to their higher levels of muscle mass. BMI categories also fail to account for varying proportions of fat, bone, cartilage, water weight and more.
Centers for Disease Control and Prevention (CDC), 2000 stated that “overweight” is defined differently for children and teenagers than for adults. Due to growth and differing maturation rates, a modified BMI compares heights and weights against growth charts which also consider gender. This index is known as the BMI-for-age percentile (for children 2-19 years of age), and reflects BMI as compared with boys and girls of the same age. Because of that increase, the American Diabetes Association and the American Academy of Pediatrics recommend routine screening of children at higher risk for type 2 diabetes. It is essential to identify the best anthropometric index in any population to predict chronic disease risk.
In the present study, according to BMI-for-age percentile, 24.80% children were underweight in of 10-19 age groups. In the present study 6.20% of children and adolescents were at risk of overweight and 4.39% were overweight during health survey. The results of the present study also shows that it is appropriate to choose BMI / age, based on the international standards, as a diagnostic indicator for overweight and obese children.
Worldwide one in 10 children, aged 5-17 year old, is overweight, a total of 155 million, of which around 30-45 million are obese (Lobstein et al, 2004). The prevalence rate of overweight in children under 5 years of age in developing countries is 3.3% or 17.6 million (Executive Board, 2001). Countries with the highest prevalence of overweight are located mainly in the Middle East, North Africa, and Latin America (de Onis et al, 2000). In the United States, the prevalence of childhood overweight tripled between 1980 and 2000 (Ogden et al, 2002). In Australia, the prevalence of childhood overweight almost doubled between 1985 and 1995 (Magarey et al, 2001). In Europe there are 14 million children who are overweight and 3 million of them are obese. In 2002 nearly a quarter of children within the European Union were overweight, higher than the predicted peak for 2010. (Lobstein et al, 2004). In India prevalence of overweight/obesity was:
Delhi(North) Overweight, 22%; obesity 6%.(Sharma et al, 2007);
Uttar Pradesh (North) Obesity, 7.6% (Gupta et al, 1999).
In the present study, as per the BMI for age percentile, 6.20% of children were at risk of overweight and 4.39% were overweight which less than the other studies. But the necessary steps must be taken at this stage to prevent the agony of obesity and its related complications. Many factors were found to be responsible for the obesity epidemic in children such as increased consumption of energy-dense food, decreasing physical activity and the increasingly easy accessibility of food which can be controlled to prevent it.
Worldwide the urbanization of society is reducing children’s physical activity opportunities (Hossain et al, 2007). Increasing calorie consumption is not matched by increased levels of physical activity in children; in fact, children globally are becoming more physically inactive (Anderson and Butcher, 2006). Schools are offering a less healthy environment where children are not protected from bad diets and not encouraged for physically active lifestyles (Story et al, 2006). Because of the link between food advertising and childhood obesity authorities in the UK have banned the advertising of high fat, salt and sugar products in or around programmes made for children (www.ofcom.org.uk/consult/condocs/foodads).
The growing epidemic of childhood overweight and obesity is a major public health concern. Currently 15% of US youth are overweight, a prevalence nearly twice as high in children and three times as high in adolescents compared to 1980 prevalence rates (US Department of Health and Human Services, 2001). Almost two-thirds (60%) of overweight children have at least one cardiovascular risk factor (e.g., hypertension, hyperlipidemia) and the prevalence of type 2 diabetes mellitus is increasing in youth (American Diabetes Association,2000).These trends may seriously compromise the future health and productivity of the US population and add to health care costs.
RESULTS AND DISCUSSION
A total 2048 children participated in the epidemiological survey. Out of these 2048 children, 1017 were from urban population and 1031 were from rural population.
Table 3. Prevalence of overweight and obesity according to BMI Categories
| Group/Sub Group | Below 18.5 | 18.5-22.9 | 23.0-24.9 | 25.0-29.9 | Above 30 | |||||
| N | % | N | % | N | % | N | % | N | % | |
| All Data | 1357 | 66.26 | 517 | 25.24 | 78 | 3.81 | 78 | 3.81 | 18 | 0.88 |
According to Body Mass Index in the study, 66.26% subjects were found to be malnourished in the total population. The degree of obesity had been observed as Pre-obese 3.81% and Obese-I 3.81% and Obese-II were 0.88%. (Table-I Graph-I).
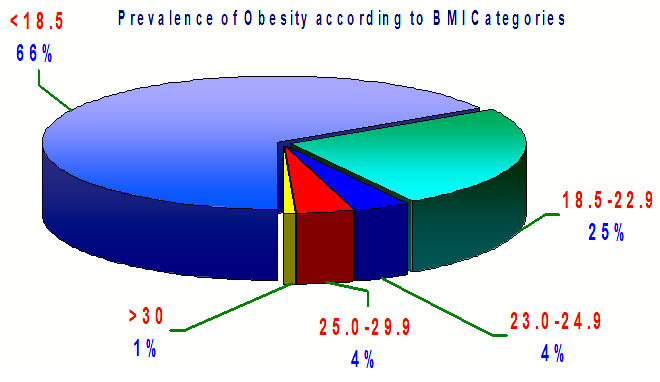
Table 4. Prevalence of overweight and obesity according to BMI-For-Age Percentile Categories
| Group/Sub Group | Underweight | Healthy Weight | Risk Overweight | Overweight | ||||
| N | % | N | % | N | % | N | % | |
| All Data | 508 | 24.80 | 1323 | 64.60 | 127 | 6.20 | 90 | 4.39 |
According to BMI-For-Age Percentile, overall, 6.20% of children and adolescents were at risk of overweight and 4.39% were overweight during health survey while 24.80% are underweight.
Overweight children were highest among urban (6.39%) than rural (2.42%). (Table-II Graph-II).
Obesity and overweight result from an imbalance in the energy expenditure equation such that either food intake is in excess; energy expenditure is deficit or both. Obesity presently has been properly documented as an ailment in its own right which is preventable through changes in life style especially diet. Obesity is a major determinant of many non-communicable diseases and induces diabetes mellitus and coronary heart disease.
Physiologically, the body weight is constantly changing. Obesity is the result of excessive expansion of adipose tissue mass. This disorder is often accompanied by abnormalities in systemic carbohydrate and lipid metabolism and the secretion and action of insulin alterations thought to reflect diabetogenic effect of obesity. There remain questions about the best diagnostic criteria for this age group.
According to Dietz and Bellizze, 1999, overweight, during childhood and adolescence, is characterized by a body mass index for age (BMI/age) above the 85th percentile and obesity by a BMI/age above the 95th percentile, based on the National Health and Nutrition Examination Survey (NHANES II-III) standards. Other authors say it is possible to adopt absolute BMI limits for specific age groups, during the growth period, without considerably compromising diagnostic specificity or sensitivity (Monteiro et al, 1999). An expert committee in 1997 declared BMI for age to be the principal measure of obesity in childhood. The adoption of regional BMI standards has also been proposed (Anjos et al, 1998).
Diagnostic criteria should be simple, low cost, reproducible and reliable and offer elevated sensitivity and specificity, thus reducing false positive and negative diagnoses. Based on a pool of studies of BMI profiles by age in a number of different countries, including Brazil, proposed limits for overweight and obesity to be applied to the 2 to 20 age group internationally (Cole et al., 2000).
In this study, the prevalence of obesity was more in boys than in girls. It is possible that the Western feminine self-image and fear of obesity were more marked in girls than in boys. Girls as young as 5 years of age care more about their self-image and associate it to weight status. The same has been reported in other studies where boys had higher prevalence of obesity than girls at all ages (Brown et al, 2002 and Huang et al, 2003).
WHO in 1996 stated that BMI values are not dependent on age or gender of human. But, they may not narrate equally to levels of obesity in diverse populations (certain racial groups in Africa and Asia) as a result of differing body-proportions. Also, the BMI index may not accurately reflect the fatness levels of people with builds falling far outside the average. As mentioned earlier, active persons like sportsmen and sportswomen, will tend to have BMI levels of “overweight” or even ‘obese’, due to their higher levels of muscle mass. BMI categories also fail to account for varying proportions of fat, bone, cartilage, water weight and more.
Centers for Disease Control and Prevention (CDC), 2000 stated that “overweight” is defined differently for children and teenagers than for adults. Due to growth and differing maturation rates, a modified BMI compares heights and weights against growth charts which also consider gender. This index is known as the BMI-For-Age Percentile (for children 2-19 years of age), and reflects BMI as compared with boys and girls of the same age. Because of that increase, the American Diabetes Association and the American Academy of Pediatrics recommend routine screening of children at higher risk for Type-2 diabetes. It is essential to identify the best anthropometric index in any population to predict chronic disease risk.
In the present study, according to BMI-For-Age Percentile, 24.80% children were underweight in of 10-19 age groups. In the present study 6.20% of children and adolescents were at risk of overweight and 4.39% were overweight during health survey. The results of the present study also shows that it is appropriate to choose BMI / age, based on the international standards, as a diagnostic indicator for overweight and obese children.
Worldwide one in 10 children, aged 5-17 year old, is overweight, a total of 155 million, of which around 30-45 million are obese (Lobstein et al, 2004). The prevalence rate of overweight in children under 5 years of age in developing countries is 3.3% or 17.6 million (Executive Board, 2001). Countries with the highest prevalence of overweight are located mainly in the Middle East, North Africa, and Latin America (de Onis et al, 2000). In the United States, the prevalence of childhood overweight tripled between 1980 and 2000 (Ogden et al, 2002). In Australia, the prevalence of childhood overweight almost doubled between 1985 and 1995 (Magarey et al, 2001). In Europe there are 14 million children who are overweight and 3 million of them are obese. In 2002 nearly a quarter of children within the European Union were overweight, higher than the predicted peak for 2010. (Lobstein et al, 2004). In India prevalence of overweight/obesity was:
Delhi(North) Overweight, 22%; obesity 6%.(Sharma et al, 2007);
Uttar Pradesh (North) Obesity, 7.6% (Gupta et al, 1999).
In the present study, as per the BMI for age percentile, 6.20% of children were at risk of overweight and 4.39% were overweight which less than the other studies. But the necessary steps must be taken at this stage to prevent the agony of obesity and its related complications. Many factors were found to be responsible for the obesity epidemic in children such as increased consumption of energy-dense food, decreasing physical activity and the increasingly easy accessibility of food which can be controlled to prevent it. Overweight and obese children can develop obesity in adulthood and can develop diabetes, hypertension and cardiovascular diseases at an early age (Krushnapriya et al 2015).
Worldwide the urbanization of society is reducing children’s physical activity opportunities (Hossain et al, 2007). Obesity in childhood is the most challenging public health issue in the twenty-first century. It has emerged as a pandemic health problem worldwide (Palanikumar and Sunil , 2021)
Data from 2015 demonstrates that approximately 108 million children and 604 million adults globally had a BMI of 30 to classify them as obese; signifies an increase in the prevalence of obesity in almost all countries since 1980 and a doubling in prevalence in 70 countries during that period (NCD Risk Factor Collaboration, 2016).
Increasing calorie consumption is not matched by increased levels of physical activity in children; in fact, children globally are becoming more physically inactive (Anderson and Butcher, 2006). Schools are offering a less healthy environment where children are not protected from bad diets and not encouraged for physically active lifestyles (Story et al, 2006). Because of the link between food advertising and childhood obesity authorities in the UK have banned the advertising of high fat, salt and sugar products in or around programmes made for children (www.ofcom.org.uk/consult/condocs/foodads).
The growing epidemic of childhood overweight and obesity is a major public health concern. Currently 15% of US youth are overweight, a prevalence nearly twice as high in children and three times as high in adolescents compared to 1980 prevalence rates (US Department of Health and Human Services,2001). Almost two-thirds (60%) of overweight children have at least one cardiovascular risk factor (e.g., hypertension, hyperlipidemia) and the prevalence of type 2 diabetes mellitus is increasing in youth (American Diabetes Association,2000).These trends may seriously compromise the future health and productivity of the US population and add to health care costs. A multidisciplinary approach to promote dietary and physical activity changes in the entire family should be used for the treatment and prevention of overweight and obesity in early childhood (Karel et al 2020).
CONCLUSION
BMI categories also fail to account for varying proportions of fat, bone, cartilage, water weight and more. BMI index may not accurately reflect the fatness levels of people with builds falling far outside the average. The boys and girls of the same age have differing growth and maturation rates. Thus a modified BMI compares heights and weights against growth charts which also consider gender specific. For children 2-19 years of age, BMI-for-age percentile is the measure and it reflects BMI as compared with same aged boys and girls. Hence it is essential to identify the best anthropometric index in any population to predict chronic disease risk.
The findings of the present study showed that BMI categories alone fail to account for varying proportions of fat, bone, cartilage, water weight and more. BMI index may not accurately reflect the fatness levels of people with builds falling far outside the average. The boys and girls of the same age have differing growth and maturation rates. Thus a modified BMI compares heights and weights against growth charts which also consider gender specific. For children 2-19 years of age, BMI-for-age percentile is the measure and it reflects BMI as compared with same aged boys and girls. Hence it is essential to identify the best anthropometric index in any population to predict chronic disease risk. Early detection of obesity in children can prevent the development of various metabolic disorders at later stage.
ACKNOWLEDGEMENT
The author is highly thankful to UGC, New Delhi for providing grant for undertaking the research project.
This study was financially supported by UGC, New Delhi and the author is highly thankful for the support and trust.
Conflict of Interests: I declare no conflicts of interest to disclose. This manuscript has not been submitted to, nor is under review at, another journal. The authors have no affiliation with any organization with a direct or indirect financial interest in the subject matter discussed in the manuscript.
REFERENCES
American Diabetes Association Type 2 diabetes in children and adolescents. Pediatrics and adolescents. . 2000; 105: 671–680.
American Diabetes Association. Type 2 diabetes in children and adolescents. Diabetes Care 2000; 23: 381−389.
Anderson PM, Butcher KE. Childhood obesity: trends and potential causes. Future Child. 2006; 16(1):19-45.
Anjos LA, Veiga, GV, Castro IRR. Distribuição dos valores do índice de massa corporal da população brasileira até 20 anos. Rev Panamer Saude Publica. 1998; 3:42-50.
Brown M, Sibille K, Phelps L, McFarlane K. Obesity in children and adolescents. Clinics in family practice 2002; 4:1–9.
Center for Disease Control (CDC). Body mass Index: BMI for children and teens.2000.apps.nccd.cdc.gov/dnpabmi.
Cole TJ, Bellizzi MC, Flegal KM, Dietz WH. Establishing a standard definition for child overweight and obesity worldwide: international survey. BMJ. 2000; 320:1240-3.
De Onis M, Blossner M. Prevalence and trends of overweight among preschool children in developing countries. Am J Clin Nutr. 2000; 72 :1032-9.
Dietz WH, Bellizzi MC. Introduction: the use of body mass index to assess obesity in children. Am J Clin Nutr. 1999; 70(1):1235-55.
Executive Board Eb109/11 109th Session 11 Provisional agenda item 3.8. Report by the Secretariat. Childhood nutrition and progress in implementing the International Code of Marketing of Breast-milk Substitutes. World Health Organization. Geneva, 2001.
Freedman DS, Dietz WH, Srinivasan SR, Berenson GS. The relation of overweight to cardiovascular risk factors among children and adolescents: the Bogalusa Heart Study. 1999; 103: 1175–1182.
Gupta Prabha S. Nutrition: an Indian prospective. Jnl. of Public Health, 1999; XXXXIII (1): 11-16.
Gupta RK. Nutrition and the Diseases of Lifestyle. In: Bhalwar RJ, editor. Text Book of Public health and Community Medicine.1st ed. Pune: Department of community medicine AFMC, New Delhi: Pune in Collaboration with WHO India Office; 2009. p. 1199.
Gardner K and Bird J Prevalence of overweight, obesity and underweight among 5-year-old children in Saint Lucia by three methods of classification and a comparison with historical rates. Child Care Health and Development 37(1):143-9 DOI:10.1111/j.1365-2214.2010.01154.x
Hossain P, Kawar B, El Nahas M. Obesity and diabetes in the developing world-a growing challenge. N Engl J Med. 2007;356(3):213-5.
Huang YC, Wu JY, Yang MJ. Weight-for-height reference and the prevalence of obesity for school children and adolescents in Taiwan and Fuchien areas. J Chin Med Assoc 2003;66:599–606.
Krushnapriya Sahoo, Bishnupriya Sahoo, Ashok Kumar Choudhury, Nighat Yasin Sofi, Raman Kumar, and Ajeet Singh Bhadoria Childhood obesity: causes and consequencesJ Family Med Prim Care.2015 Apr-Jun; 4(2): 187–192.
Lobstein, T, Baur, L, Uauy R. IASO International Obesity Task Force. Obesity in children and young people: a crisis in public health Obesity Reviews 2004; 5:4-104
Magarey AM, Daniels LA, Boulton TJ. Prevalence of overweight and obesity in Australian children and adolescents: reassessment of 1985 and 1995 data against new standard international definitions. Med J Aust. 2001; 174:561–564.
Monteiro POA, Victora CG, Barros FC, Tomasi E. Diagnóstico de sobrepeso em adolescentes: estudo de diferentes critérios para o índice de massa corporal. Rev Saude Publica. 1999; 34:506-13.
Ogden CL, Kuczmarski RJ, Flegal KM, Mei Z, Guo S, Wei R, Grummer-Strawn LM, Curtin LR, Roche AF, Johnson CL. Centers for Disease Control and Prevention 2000 growth charts for the United States: improvements to the 1977 National Center for Health Statistics version. Pediatrics. 2002; 109:45– 60.
Popkin BM, Doak CM. The obesity epidemic is a worldwide phenomenon. Nutr Rev. 1998; 56:106–14.
Sharma A, Sharma K, Mathur KP. Growth pattern and prevalence of obesity in affluent schoolchildren of Delhi. Public Health Nutr. 2007;10:485-91.
Stevens J, Cai J, Pamuk ER, Williamson DF, Thun MJ, Wood JL. The effect of age on the association between body mass index and mortality. N Engl J Med 1998; 338: 1
Story M, Kaphingst KM, French S. The role of schools in obesity prevention. Future Child. 2006 Spring; 16(1):109-42.
S. Department of Health and Human Services: Diabetes in the United States: A strategy for prevention. U.S. department of health and human services, Public Health Service Centres for disease control and National Center for chronic disease prevention and Health promotion. Divisoin of Diabetes Translation, 1993.
US Department of Health and Human Services . The Surgeon General’s call to action to prevent and decrease overweight and obesity.Rockville, MD, US Department of Health and Human Services, Public Health Service, Office of the Surgeon General; 2001.
World Health Organization Expert Committee on Physical Status.(The World Health Organization Expert Committee on Physical Status. The Use and Interpretation of Anthropometry. Physical Status: Report of a WHO Expert Committee: WHO Technical Report Series 854, WHO, Geneva, 1996).ofcom.org.uk/consult/condocs/foodads

