1Institute of Water and Energy, Sharif University of Technology, P.O. Box 11155-8639, Tehran, I.R. Iran
2Faculty of Environment, University of Tehran, P.O. Box 14155-6135, Tehran, I.R. Iran
Article Publishing History
Received: 01/11/2016
Accepted After Revision: 25/12/2016
Discharge of used cutting oil (oil-water emulsion) to the environment is not allowed without proper treatment. Usually, more than 90% of oil-water emulsion used in machine shop wastes is water. After separation of oil from water, further treatment of aqueous phase could be carried out by biological methods. In this paper, an experimental method is developed in a batch reactor. The ratio of initial substrate to the initial biomass concentration is adjusted to be between 0.9< S0/X0 <10. Biomass concentration, COD, nutrient (nitrogen & phosphor) and suspended solid were determined for different ratio of S0/X0. The achieved data were applied to determination of kinetic model parameters. These parameters can be used in designing treatment plants of oil-water emulsions. In this paper, mathematical model based on live biomass is used for simulation of experimental data from biological treatment of oil-water emulsion in aqueous phase. Newton numerical method is selected for determination of model’s parameters. Results show adjustment of presented model with experimental data. According to the results, constant parameters of specific growth rate and conversion rate of substrate to biomass are determined. Achieved results are in a good accordance with the Monod model and it strongly supports that aqueous phase of oil-water emulsion has a suitable capability of biological treatment.
Biological Treatment; Oil-Water Emulsion; Aqueous Phase; Modeling
Alavi A. N, Mirzai M, Sajadi A. A, Hasanian H. Biokinetic Modeling for Aerobic Treatment of Aqueous Phase of Oil-Water Emulsion. Biosc.Biotech.Res.Comm. 2016;9(4).
Alavi A. N, Mirzai M, Sajadi A. A, Hasanian H. Biokinetic Modeling for Aerobic Treatment of Aqueous Phase of Oil-Water Emulsion. Biosc.Biotech.Res.Comm. 2016;9(4). Available from: https://bit.ly/33JRg6M
Introduction
Water is used in almost all industries and is converted to waste water. Usually it should be treated to the standard level before discharging to the environment or reusing. Emulsion system is generated in widespread type of industries such as cosmetics, pharmaceutics, biological systems, petroleum plants, food industries. Cutting oil waste water is generated in machine shop wastes consists of an emulsion of oil and water (O/W). Main
functions of this cutting oil are lubrication, friction reduction and cooling of mechanical parts. This waste water is classified as a toxic waste due to existence of some additive material used for corrosion prevention as well as bacterial growth. Treatment of this waste water is a special problem for industries located inside cities and towns. Importance of treatment of such oil and wastewater increases due to sewage collection network deficiencies especially in developing countries, (Ariffin et al 2016).
Rheological behavior investigation of O/W emulsions has been carried and it was found that viscosities of emulsion and also the stability of emulsions are strongly affected by shear rate, temperature, water contents, interfacial tensions and particles nature O/W emulsions are thermodynamically unstable and breaking down the emulsion (separation of water and oil) which normally consist 1-10% oil and the rest water, enables the biological treatment of aqueous phase. The biological treatment of aqueous phase in machine shop wastes could be carried out similar to the procedure reported for treatment of agro-industries wastes, such as effluent from olive mills which constitutes a serious environmental problem especially in the Mediterranean Sea region (Mantzavinos & Kalogerakis 2005, Berton-Carabin et al. 2014, Ahmadi-Dastgerdi et al. 2015, and Ariffin et al. 2016).
Importance of cutting oil wastewater treatment is reported in many recent studies. Prediction the rate of pollutants removal from aqueous solutions is necessary in order to design a treatment plant (Souza et al. 2016). Biodegradability of oil-water emulsion is under the question due to high pollution (COD=60g/l) and also presence of undesirable material such as antibacterial material in the emulsion and it has led the researchers to use physicochemical processes such as membrane separation (reverse osmosisultra filtration) (Portela et al. 2001, Hadj et al. 2004), electro coagulation hydrothermal oxidation (Deepak et al., 1994, Sanchez et al. 2007) and using nanoparticles. Other researchers have also reported biological treatment application for solving this environmental concern (Krstic et al., 2007, Hesampour et al. 2008, Kobya et al. 2008, Rios et al. 1998, Rella et al. 2003, Bensadok et al. 2007, Abdel-Aziz et al. 2016), Kalliola et al. 2016).
Biodegradability of wastewater in a batch reactor were evaluated to show its efficiency, i.e., for investigation of biodegradable material such as nitrate (Kristensen et al. 1992), soluble organic carbon (Servais et al. 1987) and bacterial counting (Munch & Pollard 1997). Quality and progress rate in a batch reactor is controlled by ratio of initial substrate (So) according to COD or BOD to initial biomass concentration (X0) according to MLVSS or MLSS (Chudoba et al., 1992, Spanjers & Vanrolleghem 1995, Kappeler & Gujer 2005).
Low quantity of S0/X0 usually makes microorganism’s growth investigation impossible, on the other hand at higher quantities of (S0/X0>1) microorganism’s growth will be measurable and it can be used in explanation of experimental results and modeling of reaction rate (Wentzel et al. 1995).Verification of biological treatment in this region develops results to the conventional systems similar to SBR with so many advantages have reported about its function (Irvine et al. 1983). One of the major advantages of SBR systems is the ability to treat wastewaters with varying organic loadings with different ratios of S0/X0 (Jamrah & Abu-Ghunmi 2005). Since having a sedimentation tank is not required in this process, therefore, it is suitable for use in small scale industries located inside of towns.
Concentrations of substrate in influent and in outflow as well as retention time are important keys in performance of activated sludge process. These data often are sufficient to produce simple models like Monod. However for models with complicated concepts, it is necessary to study more about other factors like as inhibition effect. It is known that Inhibition can affect mass transfer and concentration of substance during start up time which affects microorganism growth. Therefore it is obvious that accommodation of experimental data with the complicated models and determination of their parameters is a difficult process. Due to the fact that mathematical models are complex and it is too hard to solve them with analytical methods, researchers prefer to solve them by advanced regulated and numerical methods. As a matter of fact, application of numerical method is a procedure to solve occurred problems during the process of experimental data.
Mathematical models such as the Monod kinetic model, first-order substrate removal model, Grau second-order model, and Stover-Kincannon model have been used to design specific unit operations, optimize and control treatment processes, understand the underlying biotechnology, and transport mechanisms within the reactor (Fu et al. 2013). Monod model is based on the results of batch reactor system for pure culture which fed by simple nutrient. While the Monod model has some success in describing steady state growth rates, it has been found to be inadequate to predict where the initial data does not correspond to the globally attracting steady state (Meng et al. 2010). Effect of concentration of contaminant in influent of a reactor on concentration of that contaminant in output of reactor, variation of semi saturation constant (Ks) and effect of inhibitive substance in medium are reported deficiencies of this model (Orhon & Tunay 1979). Constant logarithmic growth rate is basic thesis of this model whereas this concept is a challenging subject. Researchers have proved that there is not a specific constant growth rate for mixed bulk of bacteria (Grady & Williams 1975). There is a straight relation between constant growth rate and initial concentration of contaminant. If the concentration of contaminant increases, the constant of growth rate will decrease. It means contaminant with high concentration operates as an inhibitor.
Variation trend of X/X0 to S/S0 should be increasing otherwise it is probable that there is an inhibitor factor in the environment which affects on the microorganism’s growth and activity. Research have presented that aforementioned trend inclines to an asymptote, it reveals that there is a factor that affect the live biomass production. Goal of this study is to investigate biological treatment of liquid phase of oil-water emulsion in a batch reactor and to presents a model which consists of effective factors by numerical methods
Material And Methods
Experimental Setup
Cutting oil from a local supplier was used in this study. Oil-water emulsions were made artificially in this laboratory and then it was broken by adding Calcium Chloride to separate two phases and obtain the aqueous phase. Sewage (oil-water) consists of 2% oil and 98% water. To fulfill this task, 1 g of CaCl2 was added to emulsion for each percent of oil and after complete mixing it was left for one day in decanter ampoule to separate the aqueous phase.
Gradual increasing of oily water concentration was used to study compatibility of activated sludge with sewage. For this purpose 3 lit sludge (MLSS=1.8g/l) mixed with 3 lit sewage (30% oily water plus 70% water) and aerated for one day. After aeration period and 2 hours for settlement, 3 lit of reactor replaced by sewage with 40% oily water. This process continued up to reaching sewage with 100% oily water. This compatible and aerated sludge was used in experiments. Schematic drawing of experimental set up is shown in Figure 1.
 |
Figure 1: Experimental setup. |
All experiments were performed in ambient temperature at about 21˚C. The pH for aqueous phase was neutral and almost constant (6.9-7) therefore, it didn’t need further adjustment. Dissolved oxygen during the experiment was measured between 6.5-7.2mg/l. Required parameters such as COD, nutrient (nitrogen & phosphor) and suspended solid were measured according to the Standard Methods and were controlled before each test (APHA 1999). During the experiment, ratios of initial substrate concentration to initial biomass concentration were 0.9, 1.3, 2.2, 5.86, 10 and samplings were done by an ampoule at the one third heights from the surface.
Newton’s Method To Solve Equation
Newton iterative numerical method is used to determine parameters of presented model. In Newton method, for a continues and differentiable function on the interval (a,b), function f is approximated by its tangent line in an arbitrary initial value x0, initial guess could be reasonably close to the true root to better convergence.
By computing x-interception of tangent line, a better approximation to the function’s root obtained in each step and iteration can be continued to reaching a reasonable approximation of root as Xn+1:
Developing Monod Model
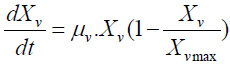
Explanation of some basic concept is necessary before presentation of the model which based on the obtained experimental data. The most current available model is the Monod model which stated in equations 2 and 3 (Tchobanoglous & Burton 1991):
![]()
µ: specific growth rate (time inverse)
µmax: maximum specific growth rate (time inverse)
Ks: semi saturation constant (mg/l )
X: biomass concentration (mg/l )
S: substrate concentration (mg/l )
Concentration of biomass in reactor is usually measured by MLSS. This parameter comprises all live, just active, microorganisms and remained cells; therefore it is not a representative parameter for reactions (Weddle & Jenkins 1971). Thus researchers tried to give a more precise definition of existence biomass as follows:
![]()
Where Xv is biomass concentration which can reproduce, Xnv is just active biomass (organic oxidation), Xd is dead or inactive biomass and P is remained cells and biopolymers. Xv and Xd can be realized by painting method (Jones 1987). Measurement of Xnv is so difficult and its quantity is not considerable and usually considered negligible or may be merged by Xd. If P in comparison with Xv+Xd is small, live biomass growth rate can be defined as:
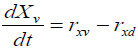
Biomass variation rate in a reactor depends on the reproduction rate (rxv) and death rate (rxd) as follow:
From a practical point of view, determination of biomass growth rate is very difficult; therefore a relationship is described between MLSS and live biomass. For this purpose primary live biomass rate is defined as:
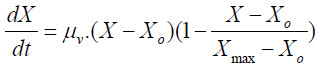
According to classic law of cell reproduction, real rate of live biomass growth can be considered zero-order to substrate and first-order to Xv:
![]()
On the other point of view, velocity of losing production power depends on cell concentration and inhibitor substance as follow:
![]()
Where á is kinetic coefficient of missing reproducibility and I is concentration of produced inhibitor substances which are produced by microbial production as
follow:
Therefore equation 6 is rewritten as follow:
At the steady state and live biomass concentration (Xv) is the maximum, therefore:
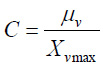
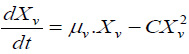
By replacing in equation 11, live biomass growth rate can be written as:
This equation has been used by most of researchers for evaluation of biomass consensus rate (Tulear & Eharaclis 1982, Vavilin & Vsiliev 1983).
By defining and , equation 13 is rewritten as:
By integration from equation 14, real concentration of biomass during the time is obtained as:
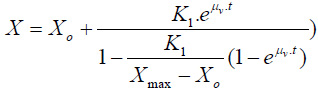
By using this equation and experimental results, parameters μv and K1 can be calculated by adjusting numerical methods and verified by substrate removal rate model. To achieve this goal, mathematical equation for substrate removal model should be determined. Conversion rate (Yobs) is defined by observed substrate removal rate and biomass growth rate as follows (substrate removal rate usually is measured by COD or BOD).
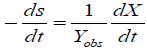
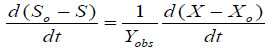
Yobs remains constant during the experiments and is equal to:
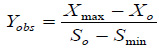
By replacing in equation 14 and integration, function of substrate removal during the time can be determined as:
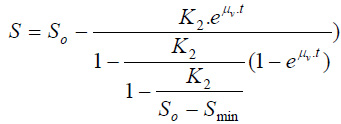
Where is the indicator of primary amount of substrate which can produce primary live biomass (Xvo) by digestion. Applying Newton method as a numerical method to equation 15 and 19 facilitates finding kinetic parameters of reaction such as biomass growth rate and substrate removal rate.
Results And Discussion
Experimental Results
As it was stated before, ratios of during experiments were 0.9, 1.3, 2.2, 5.86 and 10. For instance, variation of biomass concentration (MLSS) and substrate concentration (COD) versus time for =1.3 which are the basis of kinetic modeling of reaction are shown in Figure 2.
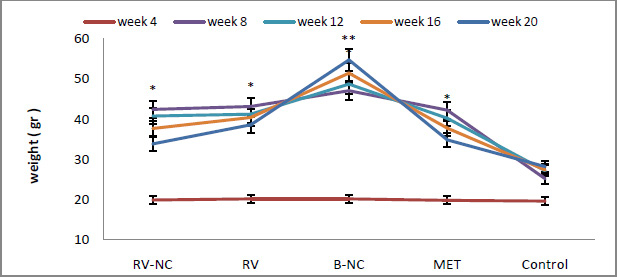 |
Figure 1: Biomass and substrate variation during time for |
Verifying Monod Model With Experimental Results
Conversion rate of substrate to biomass usually is used to solve differential equation of Monod equation according to variable X. This equation is simplified as follow in exponential growth phase:
![]()
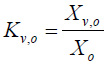
If is determined, calculating the biomass concentration during the time by equation 21 will be possible can be determined as gradient of following equation:
![]()
Figure 3 shows aforementioned function in exponential growth phase for = 5.86 and Table 1 lists µmax for different value of .
 |
Figure 3: Biomass variation versus time for = 5.86. |
Calculation was based on presumption that conversion rate of substrate to biomass (Yobs) during the experiment is constant, confirming this presumption is necessary. Yobs can be calculated from equation 22. Table 1 lists for different value of Parameters of model must be verified, so parameters resulted from experiments must be usable in model for calculating other variables in order to accept the model. Equation 23 is used in exponential growth phase in Monod model for forecasting substrate concentration during the time.
| Table 1: Yobs and removal efficiency for different values of S0/X0. | |||
| μmax | Yobs | Difference | |
| hr-1 | % | ||
| 0.9 | 0.099 | 0.61 | 90 |
| 2.2 | 0.12 | 0.83 | 83 |
| 5.86 | 0.11 | 0.39 | 85 |
| 10 | 0.14 | 0.41 | 90 |
![]()
Comparison between calculated and measured substrate during the time is necessary for verification of model and experimental results. This comparison presented for = 5.86 in Table 2. Differences in exponential growth phase are about 5.8%.
| Table 2: Calculated and measured S during the time for | |||
| Time | S (Experiment) | S (model) | Difference |
| Hr | mg/lit | mg/lit | % |
| 2 | 1256 | 1304 | 4 |
| 4 | 1067 | 1224 | 13 |
| 5 | 956 | 1080 | 11 |
| 6 | 832 | 968 | 14 |
| 7 | 694 | 732 | 5 |
| 8 | 539 | 580 | 7 |
| 10 | 174 | 320 | 46 |
Certainty of Monod model is under discussion from the past as it was stated in introduction. Main idea of Monod model is based on that exponential specific growth rate (µ) remains constant. In the present experiments µ can be considered near constant.
Discussion About The Presented Model
Analysis of biomass growth rate according to presented model should be discussed. Figure 4 illustrates both experimental data and results which derived from numerical analysis of presented model.
 |
Figure 4: Comparison between experimental data and results from presented model for biomass growth |
As it is shown, the presented model is well compatible with experimental data. Numerical analysis outcome is optimum value for kinetic parameters namely K1=27 and h-1. Sanchez (2007) determined equal to 0.01 h-1 and KS= 16 for =1 for an effluent derived from the anaerobic digestion of two-phase olive mill solid residue (Sanchez et al. 2007). Bajaj (2009) determined μmax=0.3095 h-1 for biodegradation of phenol with a mixed bacterial consortium in batch conditions (Bajaj et al. 2009).
If the parameters of biomass growth rate which derived from presented model are correct, they should be verified in the substrate removal modeling. Therefore according to equation 18, Yobs (tangent of function S=f(X)) should remain constant; Figure 5 shows this function.
 |
Figure 5: Substrate concentration versus biomass growth for S0/X0 = 5.86. |
As it is indicated above, Yobs is equal to 0.728 and as it is supposed to be constant, K2 can be calculated as equal to 37 for 1.3.
Afterward, substrate removal can be calculated by equation 22 during the time and can be compared with experimental data.
As it is indicated in Figure 6, experimental results are in accordance with calculated parameters for substrate concentration. It follows that model and is completely verified with experimental results.
 |
Figure 6: Comparison between experimental data and results from presented model for substrate removal |
Conclusion
The research shows that aqueous phase of oil-water emulsion has a suitable capability of biological treatment. Kinetic parameters of biological treatment, which are the basis of modeling, are determined. These parameters can be utilized to increase the efficiency of designing units of treatment plants of O/W emulsions. Compatibility of the process with the Monod model shows that this model is an acceptable descriptor for O/W emulsion and can be used in designing process.In the future studies about biological treatment of aqueous phase of oil-water emulsion, to increase the accuracy and compatibility of the model, kinetic of live biomass which are able to reproduce should be considered with real growth rate of . Also it should be noticed that dead biomass acts as an inhibiting factor.
References
Abdel-Aziz, M. H., El-Ashtoukhy, E. S., Zoromba, M. Sh. and M. Bassyouni (2016). Oil-in-water Emulsion Breaking by Electrocoagulation in a Modified Electrochemical Cell. International Journal of Electrochemical Science, 11, pp. 9634-9643
Ahmadi-Dastgerdi, A., Nasirpour, A., Rahimi, E. (2015). Physical and Rheological Properties of Oil in Water Heat Stable Emulsions Made from Different Stabilizers. Journal of Food Biosciences and Technology,5(1), pp. 45-62
APHA (1999). Standard Methods for the examination of water and wastewater. 20th Edn.
Ariffin, Tajnor S. T., Yahya, Effah and Husin, Hazlina (2016). The Rheology of Light Crude Oil and Water-In-Oil-Emulsion. Procedia Engineering, 148, pp. 1149-1155
Bajaj, M., Gallert, C and Winter, J. (2009). Phenol degradation kinetics of an aerobic mixed culture. Bioch. Eng. J.2(46), pp. 205-209
Bensadok, K., Belkacem, M. & Nezzal, G. (2007). Treatment of cutting oil/water emulsion by coupling coagulation and dissolved air flotation. Desalination, 206(1), pp. 440-
448
Berton-Carabin, Claire C. C., Ropers, Marie Helene & Genot, Claude (2014). Lipid Oxidation in Oil-in-Water Emulsions: Involvement of the Interfacial Layer. Comprehensive Reviews in Food Science and Food Safety 13, pp. 945-977
Chudoba, P., Capdeville B. and Chudoba J. (1992). Explanation of biological meaning of the S0/X0 ratio in batch cultivation. Wat. Sci. and Tech., 26(3-4), pp. 743-751
Deepak, D., Anand, V. and Bhargava, R. (1994). Biodegradation kinetics of metal cutting oil: evaluation of kinetic parameters. The Chem. Eng. J., 56, pp. 91-96
Fu, X., Zhenxing, H. and Hengfeng, M. (2013) Identical full-scale biogas-lift reactors (BLRs) with anaerobic granular sludge and residual activated sludge for brewery wastewater treatment and kinetic modeling, J. of Env. Sci. 25(10), pp. 2031-2040
Grady, P. and Williams, D. (1975) Effects of influent substrate concentration on the kinetics of naturel microbial population in continuous culture, Wat. Res., 9 (2), pp. 171-180
Hadj, Z., Amel, Z. and Moulay, S. (2004). Microemulsion breakdown using the pervaporation technique:application to cutting oil models, Desalination, 170(1), pp. 91-97.
Hesampour, M., Krzyzaniak, A. and Marianne, N. (2008). The influence of different factors on the stability and ultrafiltration of emulsified oil in water, J. of Membrane Sci., 325(1), pp. 199–208
Irvine, L., Ketchum, H., Breyfogle, R. and Barth, F. (1983). Municipal application of sequencing batch treatment, J. of WPCF. 55(5), pp. 484-493
Jamrah, A. and Abu-Ghunmi, L. (2005). One independent variable rate equation describing utilization of biodegradable organic matter in activated sludge processes. Env. Mod. and Ass., 10, pp. 21–31.
Jones, P. (1987). Measures of Yeast Death and Deactivation and Theire Meaning , Pro. Bioch. 22(4), pp. 118-128
Kalliola, Simo, Repo, Eveliina, Sillanpää, Mika, Arora Jaspreet Singh, He, Jibao & John T. Vijay (2016). The stability of green nanoparticles in increased pH and salinity forapplications in oil spill-treatment. Colloids and Surfaces A: Physicochemical and Engineering Aspects, 493, pp. 99-107.
Kappeler, J. and Gujer, W. (2005). Estimation of kinetic parameters of heterotrophic biomass under aerobic condition and characterization of wastewater for activated sludge modelling. Wat. Sci. and Tech., 25(6), pp. 125-139
Kobya, M., Ciftci, C., Bayramoglu, M. and Sensoy, T. (2008) Study on the treatment of waste metal cutting fluids using electrocoagulation, Sepa. and Pur. Tech., 60(3), pp. 285–291
Kristensen, H., Jourgensen, E. & Henze, M. (1992). Characterization of functional microorganism groups and substrate in activated sludge and wastewater by AUR, NUR and OUR. Wat. Sci. and Tech,. 25(6), pp. 43-57(1992).
Krstic, M., Hoflinger, W., Koris, K. and Vatai, G. N. (2007). Energy-saving potential of cross-flow ultrafiltration with inserted static mixer: Application to an oil-in-water emulsion, Sepa. and Pur. Tech., 57(1), pp. 134–139
Mantzavinos, D. and Kalogerakis, N. (2005). Treatment of olive mill effluents: Part I. Organic matter degradation by chemical and biological processes, An overview. Env. Int., 2 (31), pp. 289- 295
Meng, X., Gao, Q. and Li, Z. (2010). The effects of delayed growth response on the dynamic behaviors of the Monod type chemostat modelwith impulsive input nutrient concentration, Nonlinear Analysis: Real World App., 11(5), pp. 4476-4486
Munch, E. and Pollard, C. (1997). Measuring bacterial biomass-COD in wastewater containing particular matter. Wat. Res., 10 ( 31), pp. 2252-2256
Orhon, D. andTunay, O. (1979). Mathematical models of biological waste treatment processes for the design of aeration tanks discussion. Wat. Res., 13(6), pp. 127-135
Portela, J. R., Lopez, J., Nebot, E. & Maertinez, O. (2001). Elimination of cutting oil wastes by promoted hydrothermal oxidation, J.of Hazardous Mat., 88(1), pp. 95–106
Rella, R., Sturaro, A., Parvoli, G., Ferrara, D. and Doretti, L. (2003). An unusual and persistent contamination of drinking water by cutting oil, Wat. Res., 37(3), pp. 656–660
Rios, G., Pazos, C. and Coca, J. (1998). Destabilizationof cutting oil emulsions using inorganic salts as coagulants, Colloids and Surfaces, A: Physicochemical and Eng. Aspects.Colloids and Surface 138(2-3), pp. 383–389
Sanchez, E., Rincón, B., Borja, R., Travieso, L. and Raposo, F. (2007). Aerobic degradation kinetic of the effluent derived from the anaerobic digestion of two-phase olive mill solid residue, Int. Biodet. and Biodeg. 60(1), pp. 60-67
Sanchez, E., Rincón, B., Borja, R., Travieso, L. and Raposo, F. (2007). Hydrothermal oxidation: Application to the treatment of different cutting fluid wastes, J. of Hazardous Mat., 144(3) pp. 639-644
Servais, P., Gilles, G. and Hascoët, M. (1987). Determination of biodegradable fraction of dissolved organic matter in waters, Wat. Res. 21(4), pp. 445-450
Souza, R. S., Porto, P. S., Pintor, A. M., Ruphuy, G., Costa, M., Boaventura, R. A. and Vilar, V. J. (2016). New insights on the removal of mineral oil from oil-in-water emulsions using cork by-products: Effect of salt and surfactants content, Chemical Engineering Journal, 285, pp.709–717
Spanjers, H. and Vanrolleghem, P. (1995). Respirometry as a tool for rapid characterizaton of wastewater and activated sludge, Wat Sci. and Tech., 31(2), pp. 105-114
Srinivasan, A. and Viraraghavan, T. (2010). Oil removal from water using biomaterials, Bioresource Tech., 101(17),pp. 6594–6600
Tchobanoglous, G. and Burton, Franklin L. (1991). Wastewater Engineering Treatment, Disposal and Reuse, McGraw-Hill Inc., 4th Edn.
Tulear, M. and Eharaclis, W. (1982). Dynamics of Biofilm Processes, Journal of Water Pollution Control Federation, 9(54), pp. 1288-300
Vavilin, V. and Vsiliev V. (1983). Dependance of biological treatment rate an species composition in activated sluge or biofilm, Biotech. Bioeng. 25(6), pp. 1521-1538
Weddle, C. and Jenkins, D. (1971). The viability activity of activated sluge, Wat. Res. 5, pp. 621-628
Wentzel, C., Mbewe, A., Lakay, T. and Ekama, G.A. (1995). Batch test for measurement of readily biodegradable COD and active organism concentration in municipal watewater, Water S.A, 21(2), pp. 117-124

