1Datta Meghe Institute of Engineering, Technology and Research, Wardha, India
2Yeshwantrao Chavan College of Engineering, Nagpur, India
3 G. H. Raisoni College of Engineering and Management, Pune, India
4St. Vincent Pallotti College of Engineering & Technology, Nagpur, India
Corresponding author email: ruchi.sinhal04@gmail.com
Article Publishing History
Received: 11/01/2022
Accepted After Revision: 28/03/2022
Since last decades, photoplythesmography (PPG) signals that are extracted from the optical absorption in the tissues are increasingly being used for health diagnosis. Despite a good literature, there are different claims about the use of color channels as red, green and blue for extraction of PPG signal, i.e., pulse rate from the videos captured through high resolution cameras. In this article, we present the technique for extracting the heart beat rate (pulse rate) from the videos captured through the mobile cameras for all three color channels and thier analysis. Experiments were performed on a DMIMS database comprising 720 videos, out of which we used 25 videos for the analysis. The pulse rate estimated from the blue channel, was in good agreement with reference data extracted using an MP20 monitor, used as the gold standard. The findings of the present study demonstrated the non-invasive color intensity method for detection of pulse rate from the pre-recorded video of 30 seconds. The algorithm is tested on the DMIMS dataset which we have captured in uncontrolled setting. The green channel is proven to be statistically significant for the video recorded followed by red and then blue channel. The accuracy of the pulse extracted is still low because of low signal to noise ratio.We therefore conclude that the presented technique is best for pulse rate extraction through a blue channel followed by red and green channels respectively.
Color Channels; Pulse Rate; Remote Photoplythesmography; RGB Colorspace; Vital Signs
Sinhal R. A, Singh K. R, Raghuwanshi M. M, Gupta K. O. Use of Color Channels to Extract Heart Beat Rate Remotely from Videos. Biosc.Biotech.Res.Comm. 2022;15(1).
Sinhal R. A, Singh K. R, Raghuwanshi M. M, Gupta K. O. Use of Color Channels to Extract Heart Beat Rate Remotely from Videos. Biosc.Biotech.Res.Comm. 2022;15(1). Available from: <a href=”https://bit.ly/3wM7spm“>https://bit.ly/3wM7spm</a>
Copyright © This is an Open Access Article distributed under the Terms of the Creative Commons Attribution License (CC-BY). https://creativecommons.org/licenses/by/4.0/, which permits unrestricted use distribution and reproduction in any medium, provided the original author and sources are credited.
INTRODUCTION
Photoplethysmography (PPG) is an optical technology that detects changes in blood volume under the skin bed of microvascular tissue. This non-invasive technology was commonly used in wrist, finger or ear-based pulse oximetries to measure vital signs as pulse-rate and peripheral oxygen saturation (SpO2) (Verkruysse et al. 2008; Sinhal et al. 2017). The PPG theory is based on the optical absorption of arterial blood by some light wavelengths into other areas of biological tissue (Zhang et al. 2014). A light source lights up a pulsatile blood-containing piece of human skin and a camera catch this. There are two steps in rPPG checking; first region of interest detection, and second signal generation to detect a pulse (Finžgar et al. 2021).
The oxygenated blood circulation induces changes in the amount of hemoglobin molecules and proteins as the pulsatile blood circulates in the human cardiovascular system, creating differences in optical absorption and scattering around the light spectrum. We can get a PPG signal that reflects changes in blood volume by emitting light through the skin layers and measuring the amount of light spreading through the tissue. Physiological variables (e.g., pulse-rate/heart-rate, pulse-rate variability/heart-rate variability, respiratory rate, SpO2, blood pressure, etc.) may be further determined by the PPG waveform and cardiovascular states assessed (e.g., arterial diseases, stiffness, aging, etc.) (Wang et al. 2017). The traditional use of a PPG calculation (i.e., pulse oximetry) involves a light source that emits light into the skin (i.e., a Light-Emitting Diode (LED)) and a light receiving photodetector that has spread through the skin. Depending on their geometric location around the skin, the light source and photodetector have two distinct operating modes: transmissive and reflective (Sinhal et al. 2017; Finžgar et al. 2021).
rPPG camera based vital sign monitoring can be categorized in two trends detection of signals through the variations in skin and detecting head motions induced by changes in heart cycle. rPPG method mainly focus on measuring pulse rate, blood rate and heart rate using videos acquired from camera. The authors in (Sinhal et al. 2017) used DSLR cameras to capture three color channels in most of their studies. In our research, we focused on capturing videos with a 5-megapixel lens and a video resolution of 1280×720 pixels via mobile phone HTC. The camera sensors capture each pixel corresponding to one color detecting light in red, green and blue bands. Therefore, specific frequency information was extracted from the pixels. Verkruysee’s previous work has shown that green channel works best for BPV signals in the RGB colorband (Verkruysse et al. 2008). The ICA algorithm was developed by Poh et al., to extract the BPV signal from one independent source (Zhang et al. 2014; Zhang et al. 2021).
For extracting signals from the video, selection of region of interest (ROI) is also important. Many researchers adapted different methods and chosen different region of interest. Wang et al. (2017) proposed a technique which automatically chose the region of interest by detecting live skin. Mannapperuma et al. (2014) chose forehead for extracting pulse rate, as forehead is less influenced from the motion but has highest signal to noise ratio. Bobbia et al. (2016) developed a model that represented living skin tissue and has region of interest favoured to the region where pulse are more prominent. Po et al. (2018) developed and adaptive ROI technique which improved signal to noise ratio and the quality of extracted rPPG signal. They also developed a new frame adaptive ROI system to divert color saturation or cut-off distortion in the process of capturing fingertip video to improve efficiency due to variance and limited dynamic range of camera sensors indifferent smart phone models (Po et al. 2015; Zhang et al. 2021).
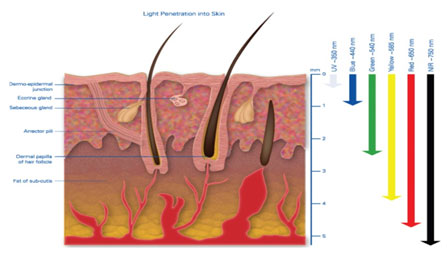
The contributions of this paper are: 1) to show that mobile phone cameras can also work for extracting rPPG signals from videos 2) to show the difference in signals extracted from the traditional DSLR camera and mobile phone camera sensors 3) to present the result of signals extracted from channels compared with the gold standard recorded through pulse-oximeter. From the literature it is evident that progressive work has been done in field of estimating heart rate from the photoplethysmography signals obtained remotely. The researchers have used the good quality sensors for the video acquisition of subjects and therefore the algorithms were able to perform better. In our work we have created database of videos for pregnant women using HTC one mobile phone camera sensor. Also, in Verkruysse et al. (2008) have stated that green channel performs better as compared to blue and red channel which contradicts our finding in the result. Clement et al. (2005) demonstrated the penetration of the different light spectrum in human body for using iPulse technology as treatment. In the finding it has been observed the blue light is extinguished at 4.4mm below the skin surface whereas green extinguishes below 5.4mm. The reference figure for the light penetration into human skin is show in figure 1 below (Zhang et al. 2021).
Figure 1: Light penetration into skin illustrating the depth to which wavelengths penetrate human skin
MATERIAL AND METHODS
In this section, we present the technique to extract pulse rate from remotely recorded videos for three different colours viz; red, green and blue. The videos are recorded in uncontrolled environment with movement. Additionally, there was no filtration or correction done for improvement in videos. Initially, vector frames for recorded video are created. The first frame of the video is displayed to identify the region of interest (ROI) for finding the pulse rate. Here, ROI has been identified manually. For the proposed technique, forehead from the facial portion has been chosen as the ROI. Whenever heart pumps blood, it flushes the blood in entire body and even in the face portion. The changes brought in the body or face due to blood pumping cannot be visualized through naked eyes.
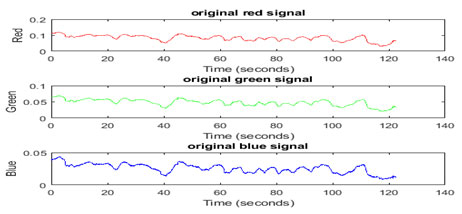
However, these changes can be very well monitored by changes in color channels. Moreover, the forehead region of the face is more in area that is exposed to the light. Therefore, forehead has been selected as the ROI to extract signals with more ‘signal to noise’ ratio. The other regions such as eyes, cheeks, neck, and hand region were not considered for extraction of pulse signals from the video. For example, a sample frame of video for subject with ‘id#5025’ is shown in figure 2 depicting ROI with a rectangular box. This selected ROI is kept constant for the frame vector to extract the intensity vector Ir, Ig and Ib different color channels from the video. The intensity vector is then plotted against time for subject id#5025. The plot of red, green and blue signal is shown in the figure 3 below. The average of all color channels (red, green and blue) pixel values within resulting ROI were calculated from each frame (f1, f2, f3 …fn) from raw signal extracted. The average pixel matrix gave the intensity of each color channels extracted from the pixel (Ir, Ig and Ib). The intensity matrix gave the raw traces of the signals extracted from the ROI as shown in figure 3.
Figure 2: First frame for subject id #5025
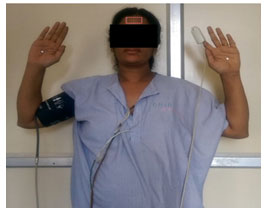
Figure 3: Intensity matrix Original RGB color channels for subject id#5025
In figure 4b, we have plotted the obtained pulse count for id number after filtering them using Butterworth band pass filter and elliptic IIR filters. These values where compared with the real time MP20 recorded values for all 20 patients. We found that butterworth filter outperformed as compared to elliptic filter. Therefore, the original signal is distended filtered with Butterworth bandpass filter to filter out non-physiological frequencies within range of 40 bpm to 180 bpm. Also, it was evident from the signal plotted in figure 4a after applying the elliptic IIR filter the signal was not getting filtered.
The filtered signal as shown in figure 5 is stored in the vector and plotted as a graph. The following figure 5 shows the filtered signal for all three channels for subject id#5025 FSr, FSg, and FSb for red, green and blue channel respectively. The filtered signals were given as input to peak counting algorithm. The peak counting algorithm finds the number of peaks in the filtered signal and count was represented as pulse count for the signal as Pr, Pb, and Pg. This count was compared with the pulse count we had collected for patient during recording of video using ixTrend software.
RESULTS AND DISCUSSION
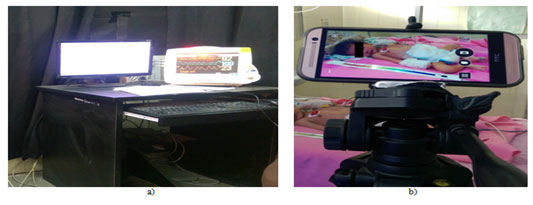
Experimental Setup: We have recorded the videos for remote-PPG in visible light conditions, using the following video recording setup including HTC one mobile camera as shown in figure 6(a) and figure 6(b). Different components of experimental setup will be explained in the following subsection. Recording Environment: The recording environment consists of a computer system with windows operating system of 32 bit. The system was having the software ixtrend installed to record the heart rate, respiratory rate and SpO2 of the subjects. Mp20 monitor is attached to the system for storing the data for patients as shown in figure 6 (a). Camera: HTC one m9 mobile phone was used to capture the videos of 720 healthy pregnant women in AVBRH hospital having period of gestation from 45 to 300 days.
The database has been created at Datta Meghe Institute of Medical Sciences research laboratory in association with HSPH, Boston, funded by USAID which is described in section 3.2. The subjects were in standing position and the video was recorded with mobile phone mounted on tripod. There was no special illumination on the subject face or the area being captured except the daylight in the room from the window. The video is recorded with 1080p 13Mp camera sensor having 30fps frame rate. Figure 6(b) is showing the mobile phone and subject on screen (Finžgar et al. 2021; Zhang et al. 2021).
Figure 4. a): Original red signal obtained from video and filtered using bandpass filter and elliptic filter design for subject id#5025, b) Plot of HR obtained after applying Bandpass filter and Elliptic filter (Between 40 and 180 bpm) in relation with the recorded MP20 value.
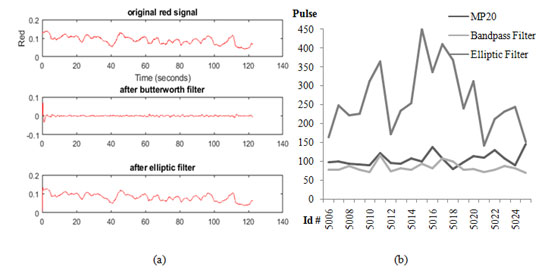
Figure 5: Extracted pulse and filtered pulse for subject id#5025
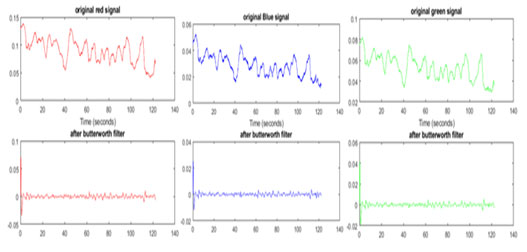
Figure 6. a): Recording environment b) HTC Desire phone and tripod used for recording videos
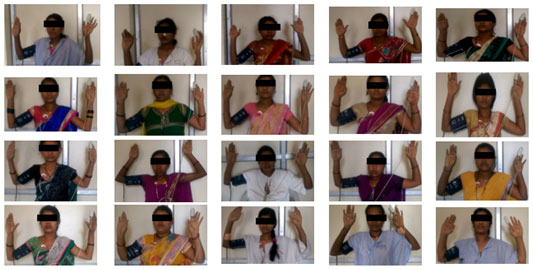
Database Description: The database consists of 720 videos of different individuals or subjects. Each individual or subject is a pregnant woman of Indian origin with varying skin tone categorized from type-I to type-VI according to Fitzpatrick scale (Sachdeva 2009) between 19 to 38 years of age (see Figure 7). The video of each subject was recorded using HTC one M9 mobile phone shown in figure 6(b). The time length of each video is approximately greater than 120 seconds. The reason for keeping the video short is to avoid the physiological changes that occur in longer term. Also, we have recorded the physiological signs thorough iXtrend software which recorded the signs up to one minute. The parameters like heart rate, respiratory rate and SPO2 of each subject were also recorded on the computer digitally with the help of MP20 monitor connected to the system using iXtrend software as shown in figure 6(a). A sample frame of video for subject with ‘id#5025’ is shown in figure 2 depicting ROI with a rectangular box (Finžgar et al. 2021; Zhang et al. 2021).
The proposed technique was experimented using MATLAB R2017b with 32GB RAM, 3.60 GHz Intel Core i7 64-bit processor an 1TB hard disk. As discussed about DMIMS database in section 4.2, a subset of videos of 20 different subjects were randomly selected from database for experimentation. One sample frame from each video of 20 different individuals is shown in figure 8. Each video of one subject is represented as (id #number) as shown in figure 8. First four digits ‘5001’ represent the series. The last digit is verhoff coding to distinguish each subject from another subject. The different properties namely; duration, frame rate, height and width of each video are also shown along with each frame for better understanding of the reader. For instance, id#50063 represents the frame for patient id 50063 having duration of video 121 seconds with frame rate of 30.35fps and resolution of 720 × 1280 pixels (Finžgar et al. 2021; Zhang et al. 2021).
Figure 7: Samples images from DMIMS database with variation in skin tone
This section, presents the experimentation results of proposed technique for detail performance analysis with DMIMS database mentioned earlier. For estimating the pulse rate from the recorded video, the performance of the proposed technique is found for three colour bands. For each color band, intensity signal is extracted which is further filtered using Butterworth bandpass filter as shown in figure 5. The number of peaks in the filtered signal is counted separately for each channel. The number of peaks gives the pulse count for channel which is shown in table 1.
The plotted signal for the intensity values derived for each video frame is the first signal. Using the Butterworth band pass filter, the second signal is extracted and filtered. The derived and filtered pulse plotted for id # 5014 is figure 4. Table 1 demonstrates the accuracy of the pulse derived from the video. The algorithm was tested with three red, green and blue colour channels. More consistency is found for the blue channel, i.e. 89% without any corrections in the video. The accuracy of the red channel is 79.22%, and the accuracy of the green channel is 76.82%. The blue channel, followed by the red channel and then the green channel, offers the highest accuracy respectively.
Figure 9 displays the plot of the discrepancy between the pulse rate obtained from the three video colour channels and the original pulse rate used as the gold standard. The minimum difference is observed in the signal of the blue colour channel filtered by the Butterworth filter followed by a red colour channel and a green colour channel. The blue colour channel was therefore good for extracting the pulse rate from the video database that was captured in the research by adding only the Butterworth filter to the ROI signals (Finžgar et al. 2021; Zhang et al. 2021).
A paired t-test was run on a sample size of 20 middle aged (25.3 + 4.49) pregnant women to determine whether there was statistically significant mean difference between the pulse count of the subjects acquired from the MP20 monitor (106.35 + 16.99) and the color intensity peak count algorithm applied on video for red (84.25 + 12.14), green (81.7 + 10.99) and blue (94.75 + 14.03) channel. A statically significant increase of 22.1 (95% CI, 11.98 to 32.21) bpm, t(19)=4.57,p<0.0005 has been found for red channel. Similarly, statically significant increase of 24.65 (95% CI, 15.49 to 33.81) bpm, t(19)=5.63,p<0.0000 has been found for green channel. And statically increase of 11.6 (95% CI, 1.7 to 21.5) bpm, t(19)=2.45,p<0.024 is found for blue channel (Zang et al. 2021). The intensity matrix gave the raw traces of the signals extracted from the ROI as shown in figure 3.
Figure 8: Thumbnails from DMIMS database with its video properties
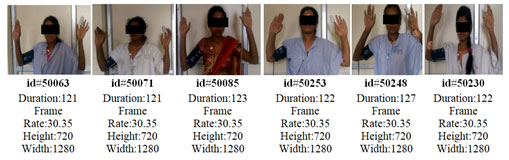
Figure 9: Difference between the gold standard and color channel pulse rate extracted
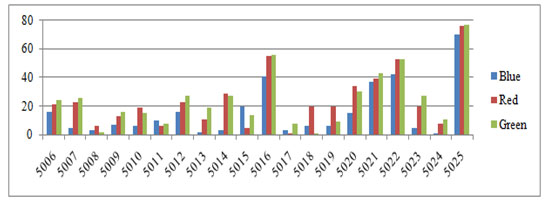
Table 1. Accuracy of proposed methodology with three different channels using Butterworth filter
| ID | IxTrend Pulses | Pulse Count | ||
| Red | Green | Blue | ||
| 50063 | 99 | 78 | 75 | 83 |
| 50071 | 101 | 78 | 75 | 96 |
| 50085 | 94 | 88 | 92 | 97 |
| 50092 | 92 | 79 | 76 | 85 |
| 50102 | 91 | 72 | 76 | 85 |
| 50118 | 122 | 116 | 114 | 132 |
| 50125 | 97 | 74 | 70 | 81 |
| 50139 | 94 | 83 | 75 | 96 |
| 50141 | 108 | 79 | 81 | 105 |
| 50156 | 100 | 95 | 86 | 120 |
| 50160 | 138 | 83 | 82 | 97 |
| 50173 | 109 | 108 | 101 | 106 |
| 50187 | 81 | 101 | 80 | 87 |
| 50194 | 99 | 79 | 90 | 93 |
| 50207 | 114 | 80 | 84 | 99 |
| 50217 | 111 | 72 | 68 | 74 |
| 50224 | 131 | 78 | 78 | 89 |
| 50230 | 108 | 88 | 81 | 103 |
| 50248 | 91 | 83 | 80 | 90 |
| 50253 | 147 | 71 | 70 | 77 |
| Accuracy | 79.22% | 76.82% | 89.09% | |
Table 2. Table of analysis between the rPPG signals and gold standard
| rPPG Signal | Mean(+StdDev) | t-value | p-value | Std Error | Conf. Interval |
| Red | 22.1(+21.61) | 4.57 | 0.0002 | 4.83 | 11.98-32.21 |
| Green | 24.65(+ 19.58) | 5.63 | 0.0000 | 4.378 | 15.49-33.81 |
| Blue | 11.6(+ 4.73) | 2.45 | 0.024 | 4.73 | 1.7-21.5 |
CONCLUSION
The findings of the present study demonstrated the non-invasive color intensity method for detection of pulse rate from the pre-recorded video of 30 seconds. The algorithm is tested on the DMIMS dataset which we have captured in uncontrolled setting. The detected pulse rate is filtered with the three different IIR filters out of which Butterworth filter demonstrated best results. The results obtained where compared with the gold standards recorded form MP20 monitor and was compared for three color channels. The green channel is proven to be statistically significant for the video recorded followed by red and then blue channel. The accuracy of the pulse extracted is still low because of low signal to noise ratio.
Conflict of Interest: The authors declare that they have no conflict of interest.
Data Availability Statement: The database generated and /or analysed during the current study are not publicly available due to privacy, but are available from the corresponding author on reasonable request.
Funding: The authors did not receive support from any organization for the submitted work.
Financial Interests: The authors declare they have no financial interests.
REFERENCES
Balakrishnan, G., Durand, F. and Guttag, J., (2013). Detecting pulse from head motions in video. In Proceedings of the IEEE Conference on Computer Vision and Pattern Recognition, pp. 3430-3437.
Bobbia, S., Benezeth, Y. and Dubois, J., (2016). December. Remote photoplethysmography based on implicit living skin tissue segmentation. In 2016 23rd International Conference on Pattern Recognition (ICPR) (pp. 361-365). IEEE.
Clement, M., Daniel, G. and Trelles, M., (2005). Optimising the design of a broad‐band light source for the treatment of skin. Journal of Cosmetic and Laser Therapy, 7(3-4), pp.177-189.
De Haan, G. and Jeanne, V., (2013). Robust pulse rate from chrominance-based rPPG. IEEE Transactions on Biomedical Engineering, 60(10), pp.2878-2886.
De Haan, G. and Van Leest, A., (2014). Improved motion robustness of remote-PPG by using the blood volume pulse signature. Physiological measurement, 35(9), p.1913.
Garbey, M., Sun, N., Merla, A. et al. (2007). Contact-free measurement of cardiac pulse based on the analysis of thermal imagery. IEEE transactions on Biomedical Engineering, 54(8), pp.1418-1426.
Gupta, K.O. and Chatur, P.N., (2020). Gradient self-weighting linear collaborative discriminant regression classification for human cognitive states classification. Machine Vision and Applications, 31(3), pp.1-16.
Kamshilin, A.A., Nippolainen, E., Sidorov, I.S., et al. (2015). A new look at the essence of the imaging photoplethysmography. Scientific reports, 5(1), pp.1-9.
Li, X., Chen, J., Zhao, G. et al. (2014). Remote heart rate measurement from face videos under realistic situations. In Proceedings of the IEEE conference on computer vision and pattern recognition (pp. 4264-4271).
Macwan, R., Benezeth, Y. and Mansouri, A., (2019). Heart rate estimation using remote photoplethysmography with multi-objective optimization. Biomedical Signal Processing and Control, 49, pp.24-33.
Mannapperuma, K., Holton, B.D., Lesniewski, P.J. et al. (2014). Performance limits of ICA-based heart rate identification techniques in imaging photoplethysmography. Physiological measurement, 36(1), p.67.
Pirnar, Ž., Finžgar, M. and Podržaj, P., (2021). Performance Evaluation of rPPG Approaches with and without the Region-of-Interest Localization Step. Applied Sciences, 11(8), p.3467.
Po, L.M., Feng, L., Li, Y., et al. (2018). Block-based adaptive ROI for remote photoplethysmography. Multimedia Tools and Applications, 77(6), pp.6503-6529.
Po, L.M., Xu, X., Feng, L., et al. (2015). May. Frame adaptive ROI for photoplethysmography signal extraction from fingertip video captured by smartphone. In 2015 IEEE International Symposium on Circuits and Systems (ISCAS) (pp. 1634-1637). IEEE.
Poh, M.Z., McDuff, D.J. and Picard, R.W., (2010). Advancements in noncontact, multiparameter physiological measurements using a webcam. IEEE transactions on biomedical engineering, 58(1), pp.7-11.
Qiu, Y., Liu, Y., Arteaga-Falconi, J., et al. (2018). EVM-CNN: Real-time contactless heart rate estimation from facial video. IEEE transactions on multimedia, 21(7), pp.1778-1787.
Sachdeva, S., (2009). Fitzpatrick skin typing: Applications in dermatology. Indian journal of dermatology, venereology and leprology, 75(1), p.93.
Sanyal, S. and Nundy, K.K., (2018). Algorithms for monitoring heart rate and respiratory rate from the video of a user’s face. IEEE Journal of translational engineering in health and medicine, 6, pp.1-11.
Sinhal, R., Singh, D.K.R. and Raghuwanshi, D.M.M., (2019). Heart Rate Measurement based on Color Signal Extraction. Int. J. Innov. Technol. Explor. Eng, 8(10), pp.1990-1993.
Sinhal, R., Singh, K. and Raghuwanshi, M.M., (2020). An overview of remote photoplethysmography methods for vital sign monitoring. Computer Vision and Machine Intelligence in Medical Image Analysis, pp.21-31.
Sinhal, R., Singh, K. and Shankar, A., (2017). October. Estimating vital signs through non-contact video-based approaches: A survey. In 2017 International Conference on Recent Innovations in Signal processing and Embedded Systems (RISE) (pp. 139-141). IEEE.
Soleymani, M., Lichtenauer, J., Pun, T. et al. (2011). A multimodal database for affect recognition and implicit tagging. IEEE transactions on affective computing, 3(1), pp.42-55.
Špetlík, R., Franc, V. and Matas, J., (2018). September. Visual heart rate estimation with convolutional neural network. In Proceedings of the british machine vision conference, Newcastle, UK (pp. 3-6).
Verkruysse, W., Svaasand, L.O. and Nelson, J.S., (2008). Remote plethysmographic imaging using ambient light. Optics express, 16(26), pp.21434-21445.
Wang, W., Stuijk, S. and De Haan, G., (2015). A novel algorithm for remote photoplethysmography: Spatial subspace rotation. IEEE transactions on biomedical engineering, 63(9), pp.1974-1984.
Wang, W., Stuijk, S. and de Haan, G., (2017). Living-skin classification via remote-PPG. IEEE Transactions on biomedical engineering, 64(12), pp.2781-2792.
Wieringa, F.P., Mastik, F. and van der Steen, A.F., (2005). Contactless multiple wavelength photoplethysmographic imaging: A first step toward “SpO 2 camera” technology. Annals of biomedical engineering, 33(8), pp.1034-1041.
Wu, H.Y., Rubinstein, M., Shih, E., et al. (2012). Eulerian video magnification for revealing subtle changes in the world. ACM transactions on graphics (TOG), 31(4), pp.1-8.
Yang, Y., Liu, C., Yu, H., et al. (2016). Motion robust remote photoplethysmography in CIELab color space. Journal of biomedical optics, 21(11), p.117001.
Zhang, B., Li, H., Xu, L et al. (2021). Noncontact Heart Rate Measurement Using a Webcam, Based on Joint Blind Source Separation and a Skin Reflection Model: For a Wide Range of Imaging Conditions. Journal of Sensors 2021, pp 1-18.
Zhang, G., Li, J., Peng, J., et al. (2014). October. 3D human body modeling based on single Kinect. In 2014 7th International Conference on Biomedical Engineering and Informatics (pp. 100-104). IEEE.

