Department oOf Biology, University College Addarb, Jazan University, Jazan 45412 Saudi Arabia
Corresponding author Email: ruqayajabeen@gmail.com
Article Publishing History
Received: 22/07/2019
Accepted After Revision: 21/09/2019
The research aimed at comparing the physiological and biochemical parameters in Bougainvillea glabra grown at a polluted site with the control site in addition to studying its Air Pollution Tolerance Index (APTI) and Anticipated Performance Index (API). The polluted site was selected from the main road in Addarb Jazan, while as, the control site was ensured free from any traffic movement. Parameters like Dust fall, Photosynthetic Pigments, Protein Content, Soluble sugar Content, Free amino Acid Content were studied in addition to the parameters necessary for the calculation of air pollution tolerance index like Total Chlorophyll, pH, Ascorbic acid content and Relative Water Content. Anticipated Performance Index was also calculated. There was an increase in chlorophyll, free amino acid content, soluble sugar content and pH of leaf extract and while as the protein content, ascorbic acid content and the relative water content showed a decrease in polluted plants as compared to the control. Our research finds that despite the polluted plant being under some biochemical stress, it shows a high tolerance to the vehicular pollution depicted by a high air pollution tolerance and anticipated performance index. Hence this plant species can be recommended for inclusion in the urban greenbelt development plan and city landscaping.
Phytomonitoring, Green Belt, Air pollution tolerance Index, APTI
Muhammad A. M, Huwaishli N. A, Ali S. M, Jabeen R. Use of Bougainvillea glabra Plants in Minimizing Vehicular Pollution in Jazan Area of Saudi Arabia. Biosc.Biotech.Res.Comm. 2019;12(3).
Muhammad A. M, Huwaishli N. A, Ali S. M, Jabeen R. Use of Bougainvillea glabra Plants in Minimizing Vehicular Pollution in Jazan Area of Saudi Arabia. Biosc.Biotech.Res.Comm. 2019;12(3). Available from: https://bit.ly/2n7SJU8
Copyright © Muhammad et al., This is an open access article distributed under the terms of the Creative Commons Attribution License (CC-BY) https://creativecommns.org/licenses/by/4.0/, which permits unrestricted use distribution and reproduction in any medium, provide the original author and source are credited.
Introduction
Air pollution is one of the major challenges that the world is facing today. Air pollution is any variation in any atmospheric element than the value which would have existed without human interference. Vehicular pollution amounts to about 2/3rd of air pollution in the urban cities. The main pollutants released by the vehicles include Carbon monoxide, Nitric Oxide, Sulphur Dioxides, Hydrocarbons lead (Pb) etc in addition to the suspended particulate matter (SPM) which has deleterious effects on the human health and ecological balance, (Ravindra, et al., 2001, Desai et al., 2018, Orlinksi et al., 2019).
The World Health Organization estimates that air pollution causes over a million premature infant deaths around the world. Saudi Arabia has seen maximum economic and infrastructure development in recent decades. To accomplish the demands of population growth, infrastructure and vehicles have seen an unprecedented increase. Vehicular pollution is the major contributor of air pollution in Saudi Arabia, because of majority of population use cars, (Ahmad et al., 2016).To check the different plant species about the values of their tolerance to air pollutants is necessary. So that the identification of plants species as sensitive, and tolerant is of vital significance because the sensitive species can serve as indicators and the tolerant ones can be used as sinks to monitor the vehicular pollution in urban cities (Singh et al., 1991, Ogunrotimi et al., 2017, Jain et al., 2019).
World-Wide significant work has been done to identify the plants suitable for phytomonitoring the vehicular pollution (Pathak et al,. 2015 Khalid et al., 2019), but nothing significant has been done to see the phytomonitoring capacity of Saudi Arabian flora. Given this, the research was aimed to study the air pollution tolerance Index of Bougainvillea glabra plants to suggest the use of this plant for urban landscaping.
Materials and Methods
Plant description
Bougainvillea glabra is a genus of thorny ornamental vines, bushes, and trees. It is an evergreen vine and diligently creeps up on fences. The flowers have found use as teas to alleviate mild respiratory disorders. The leaves of some types of bougainvillea plants have been studied to help with diabetes, blood pressure as well as HDL-LDL balancing (Adebayo et al., 2009, Gaurav et al., 2010).
Site Description
Two sites were selected in Addarb, Jazan, Saudi Arabia. The site which served as control had almost zero traffic movement while as the other had a heavy traffic movement. Both sites were from the same climatic condition (desert conditions with virtually no rainfall).
Cars/Minutes
Traffic volume was monitored using a mobile camera. Hourly traffic count was calculated by analyzing the video footage taken during the field observation. Hourly traffic count was expressed in number of vehicles per minute (Kadiyali, 1996).
Dust fall
The leaves of Bougainvillea glabra plants were washed carefully to completely remove dust particles from the leaf surfaces. The plants growing near traffic signals were selected and the leaves growing above 2 feet from the ground were selected. After washing, the plant species were marked with a ribbon tied to it. On the seventh day, the dustiest leaves from the same plant species were collected in the zipper pouches in ice boxes for sampling. Leaves were brought to the Laboratory and were washed with water and filtered on pre-weighed Whatman’s filter paper No 1. The filter paper was then oven dried at 60 0C and later weighed to calculate the dust fall. (Joshi, 1990).
Pigment concentrations
Hiscox and Israelstam’s (1979) method was used to estimate the pigment concentration in the samples. The method involves the estimation of plant pigments without maceration. Leaves were washed with distilled water (DDW) and chopped. 100 mg of chopped leaf material were taken in vials in triplicates and 10 ml of Dimethyl sulphoxide was added to each vial which was heated in oven at 65˚ C. After 30 min, the vials were taken out and the OD of the solution was measured at 480, 510, 663 and 645 nm. The Chlorphyll a, b Toral chlorophyll content and the Carotenoid content was calculated according to these formula:
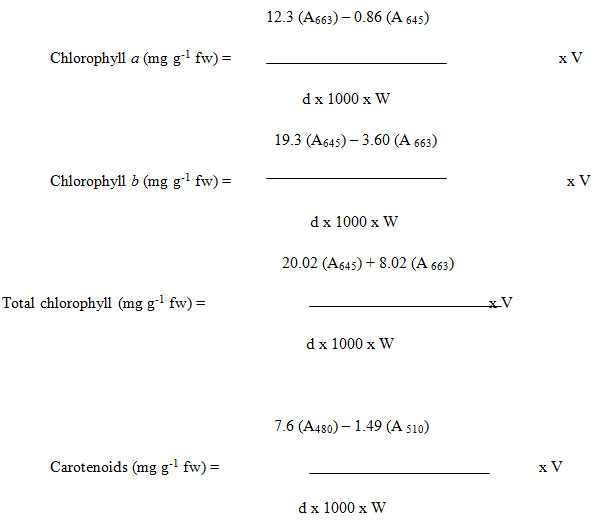
Where d= distance traveled by the light path, W = weight of the leaf material taken, V = volume of the extract and A = Absorbance
Soluble Protein
Bradford (1976) protocol was used for protein estimation.Procedure: 0.2 g of fresh and clean and chopped leaf material was homogenized in 2 ml 0.1 M/pH 7.2 phosphate buffer with the help of a pre-cooled mortar and pestle. Homogenate was transferred to the pre-cooled centrifuge tube and the centrifugation was done at 5000 rpm for 10 min. 1.0 ml of supernatant was added to equal amount of chilled 10 % Trichloroacetic acid (TCA) in a microfuge. It was centrifuged for 10 min at 3300 rpm and the supernatant obtained was thrown while as the remaining pellet washed with acetone. 1 ml of 0.1 N NaOH was used to dissolve the pellet. 0.5 ml Bradford’s reagent was added to 0.1 ml aliquot and was subjected to vortex. The tubes were left to let the color develop for 10 min. OD was taken at 595 nm on spectrophotometer.BSA was used as the standard to calculate protein concentrations and the protein content was expressed as mg g-1 FW.
Soluble Sugar Content
Soluble sugar content in the leaf samples was estimated by the method of Dey (1990).Procedure: 0.1 g of fresh leaf sample was taken to which 10 ml ethanol was added and the mixture was incubated at 60º C for one hour. Final volume was made up to 25 ml with ethanol. From this 1 ml aliquot was taken and 1 ml of phenol was added to it and mixed thoroughly. 5 ml of sulphuric acid was added to the reaction mixture, which was then cooled in air. Optical density was measured at 485 nm on uv-vis spectrophotometer (Model DU 640 B, Beckman, USA).The corresponding concentration of sugar was determined against the standard curve of sugar prepared by glucose (C6H12O6) solution. The amount of sugar was expressed as mg g-1 fw.
Free Amino Acid Content
The free amino acid content was estimated by the method of Lee and Takahashi (1966).Extraction: A 0.5 g of fresh leaf material was kept overnight in 5.0 ml of absolute ethanol and ground with the help of mortar and pestle and transferred to the centrifuge tubes. It was then centrifuged at 5500 rpm for 10 min at 4º C. After that supernatant was taken in a test tube and alcohol was evaporated by incubating the tubes at 100º C for 1h in a water bath. The pellet obtained was dissolved in 10 ml of 0.5 M citrate buffer (pH 5.6).
Estimation
To a 0.5 ml of aliquot, 1.2 ml of 55 % glycerol and 0.5 ml ninhydrin solution were added. The vials were kept in water bath for 20 min at 100º C and after the appearance of blue colour; the volume was made upto 6 mL. Optical density was measured at 570 nm on uv-vis spectrophotometer (λ BIO 20, Perkin Elmer, Germany). The concentration of amino acid was determined against the standard curve prepared by using glycine solution of different concentrations and the amino acid content was expressed in mg g-1 FW.
Ascorbic Acid
Ascorbic acid content was determined by the method of Sadasivam and Manickam (1996). For ascorbic acid content determination, a homogeneous mixture of 1 g of leaves was prepared by addition of 25 mL of 4% oxalic acid, and was dehydrogenated by addition of a few drops of bromine water to form dehydroascorbic acid. For dehydroascorbic acid, 1 mL of 2,4- dinitrophenyl hydrazine (DNPH) was added which led to the formation of compound osazone, which was further dissolved in 7 mL of 80% sulfuric acid. The absorbance of the solution was measured at 540 nm through a spectrophotometer.
Leaf pH
To get leaf extract pH, about 4 g of fresh leaf was homogenized in 40 mL deionized water and centrifuged at 2,500 rpm for 3 min. Extract pH was measured using pH meter.
Relative water content
Fresh weight was obtained by weighing the leaves. The leaf samples were then immersed in water over night and blotted dry and then weighed to get the turgid weight. The leaves were then dried overnight in a hot air oven at 70 0C and reweighed to obtain the dry weight. RWC was determined and calculated by the method as described by Singh et al (1991).
RWC= [(FW-DW)/ (TW-DW)] x 100.
Where: FW-Fresh weight, DW-Dry weight and TW-Turgid weight.
APTI Determination
The air pollution tolerance index (APTI) was computed by using the equation of Singh et al (1991) APTI = [AA (TCh + pH) + RWC ÷10 Where AA = Ascorbic acid content (mg/g), TCh = total chlorophyll (mg/g), pH = pH of leaf extract, and RWC = relative water content of leaf (%).
Results and Discussion
We noticed that there was an average of 28 small vehicles/minute and 0.53 large vehicles/minute plying near our polluted site.While as on the Control site, there was no vehicular movement.
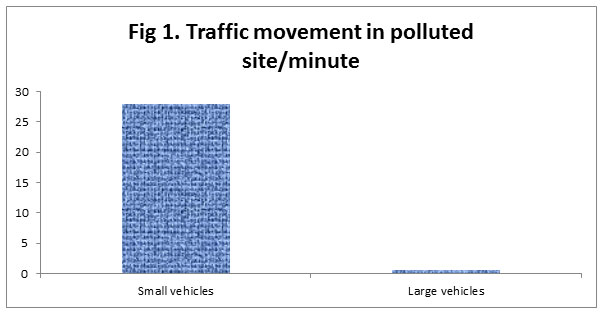 |
Figure 1 |
Dust fall
We recorded a foliar dust fall of 0.14 and 2.18 near Control and polluted sites, respectively. A greater dust retaining capacity is indicative of a plant’s use in phytomonitoring of polluted sites.
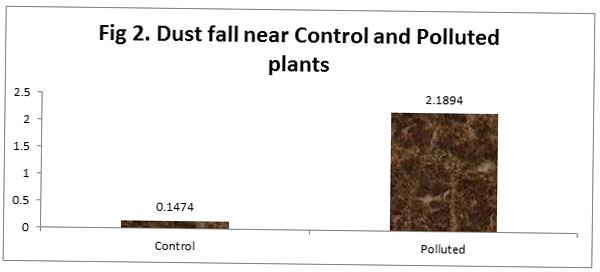 |
Figure 2 |
We also noticed an increase of chlorophyll pigments in polluted plants in comparison to the control while as there was a decrease in the Carotenoid content of the polluted plants in comparison to the control. Previous studies have revealed that chlorophyll content in plant species varies with the pollution status of that area i.e. higher the pollution level in the form of vehicular exhausts, lower the chlorophyll content. It also varies with the tolerance as well as sensitivity of the plant species i.e. higher the sensitive nature of the plant species, lower the chlorophyll content. The shading effects due to deposition of suspended particulate matter on the leaf surface might also be responsible for the decrease in the concentration of carotenoids in the polluted area
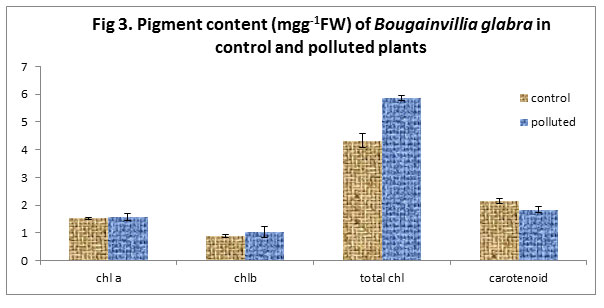 |
Figure 3 |
In the present study, we found a decrease in soluble Protein content in polluted plants in comparison to the control plants. Our results are in line with the findings of Rai et al (2016), who attributed the reduction in protein content of plants at the polluted site to the enhanced rate of protein denaturation as well as the breaking of the already existing proteins to amino acid because of proteolysis under pollution, which is also supported by the findings of Panda and Rai (2015) and Saha and Padhy (2011). Many other researchers have reported a decrease in the total protein content owing to the presence of SO2 and NO2 pollutants (Panda and Rai 2015; Rai and Panda 2015). Agarwal and Deepak (2003) reported that SO2 pollution resulted in decrease of protein levels in two wheat cultivars and attributed this decrease to increased proteolysis and reduced protein synthesis.
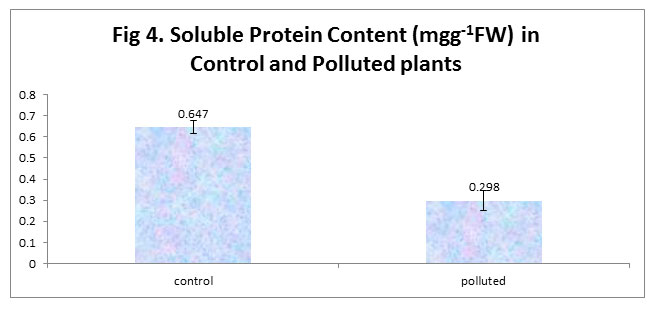 |
Figure 4 |
Soluble sugar is an important component of all living things and also an important source of energy for living things. It is produced by plants during photosynthesis and it is broken down during respiration (Tripathi & Gautam, 2007). In our study, we noticed an increase in the soluble sugar Content. Accumulation of different active ions, sugars and amino acids like proline has an important role in osmotic adjustment in plant cells (Königshofer and Löppert, 2015). These Osmotic adjustments are responsible for maintaining turgor pressure, controlling the cell expansion and photosynthesis and for maintaining the water flow during the shortage of water.
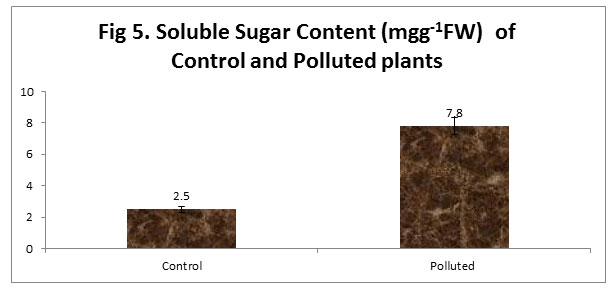 |
Figure 5 |
In our study, we saw an increased free amino acid content in the Polluted plant leaves as compared to control. The reason for this increase may be because of the accumulation of proline, which is increased when the plant is in stress. Also the increased proteolysis under stress results in the increase of free amino acid content. The decreased protein content together with increased free amino acid content in our polluted plants supports this theory.
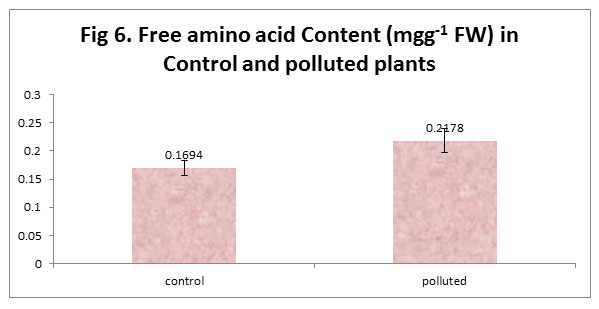 |
Figure 6 |
We noticed a decrease in Ascorbic Acid Content in polluted plants in comparison to the control plants. Ascorbic acid has an important role in cell wall synthesis, plant defense in addition to the cell division (Conklin, 2001). It also serves as a reducing agent in addition to being an important part of photosynthetic carbon fixation (Pasqualini, 2001). The high amount of Ascorbic acid is favorable for pollution tolerance in plants (Keller and Schwager, 1977; Lee et al., 1984).
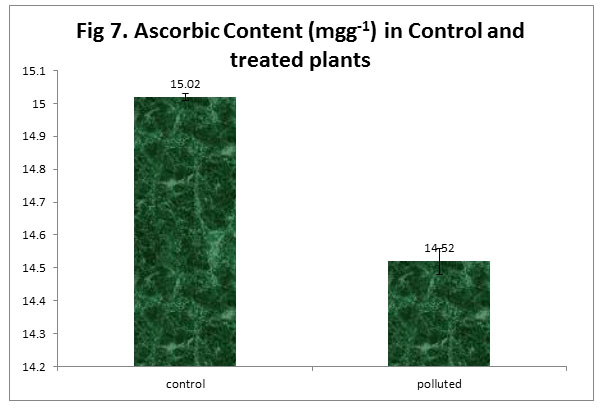 |
Figure 7 |
The leaf extract pH was more in polluted plants than in the control. Leaf extract pH plays a significant role in regulating SO2 sensitivity of plant. Irerhievwie et al (2014) opined that an elevated level of leaf extract pH in plants subjected to pollution may increase their tolerance level to air pollutants.
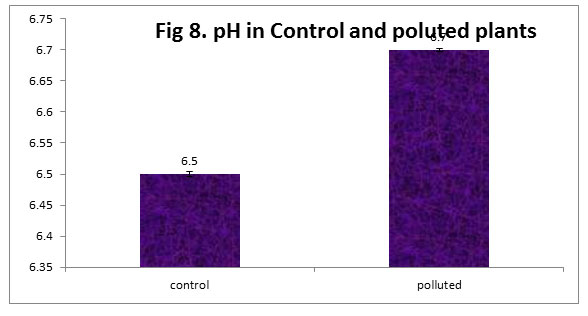 |
Figure 8 |
We found a low relative Content in Control plants with comparison to the polluted plants. Relative Water Content (RWC) of a leaf is the water present in it relative to its full turgidity. Relative water content is related to protoplasmic permeability of cells (Aggarwal et al., 1997). High water content within plants serves as an indicator of drought resistance in plants (Dedio, 1975) and helps to maintain its physiological balance under stress conditions such as exposure to air pollution when the transpiration rates are usually high.
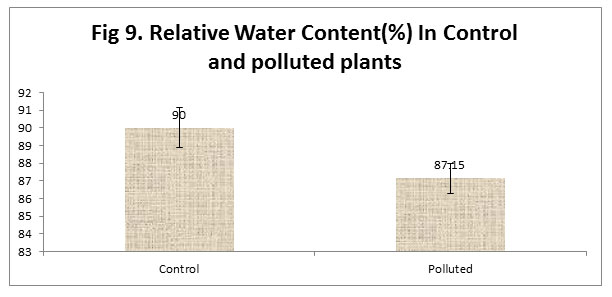 |
Figure 9 |
The air pollution tolerance index of our polluted plants was 26.95 which according to the literature is a strong index (Prajapati and Tripathi, 2008). The APTI values offer a credible method to screen the flora of any location for their tolerance and susceptibility to vehicular pollution (Singh et al., 1991). Given the excellent APTI of Bougainillea glabra, this part can be categorized as a tolerant plant to air pollution.
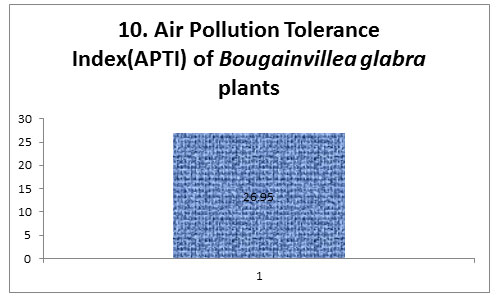 |
Figure 10 |
Anticipated Performance Index
Bougainvillea glabra plant scored 87.5% which is excellent in API grading system according to the criteria of Prajapati and Tripathi (2008). The plant is highly tolerant to the vehicular pollution and can be expected to perform well as a phytomonitoring agent. It has a dense plant canopy and is evergreen and can afford protection from pollution stress. The economic and aesthetic value of this tree is well known and it may be recommended for extensive planting on urban roads for aesthetic and pollution-remediation purposes.
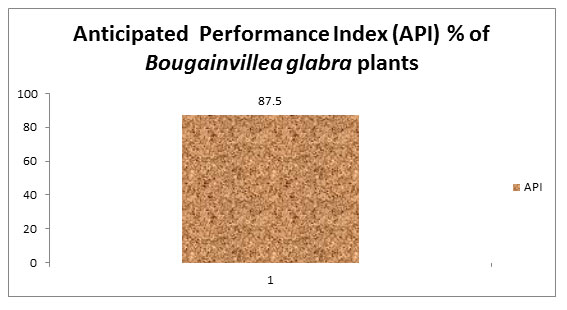 |
Figure 11 |
The research aimed at the study of phytomonitoring potential of Bougainvillea glabra for vehicular Pollution. The physiological parameters and biochemical parameters studied showed that despite the plant being subjected under the stress posed by the vehicular pollution depicted by the reduced Carotenoid content and the protein content, the plants showed tolerance against the stress as depicted by its greater air pollution tolerance index and excellent anticipated performance Index. This plant can be suggested as a model plant to be grown on the roads to reduce the particular matter owing to its high dust trapping capacity in addition to its tolerance as shown by its high APTI and API values.
Acknowledgment
The authors acknowledge Deanship of Research, Jazan University for funding this research. We duty acknowledge the Dean, University College, Addarb, Jazan University, for providing us the laboratory facilities.
References
Adebayo, G. I., Alabi, O. T., Owoyele, B. V., & Soladoye, A. O. (2009). Anti-diabetic properties of the aqueous leaf extract of Bougainvillea glabra (Glory of the Garden) on alloxan-induced diabetic rats. Records of Natural Products, 3(4), 187.
Ahmad, I., Rehan, M., Balkhyour, M., Abbas, M., Basahi, J., Almeelbi, T., & Ismail, I. M. (2016). Review of environmental pollution and health risks at motor vehicle repair workshops challenges and perspectives for Saudi Arabia. Int. J. Agric. Env. Res, 2, 1-23.
Aggarwal S and Tiwari, SL (1997). Susceptibility level of few plants on the basis of Air Pollution Tolerance Index., Indian Forester, 123(4), 319-322.
Aggarwal M, Deepak SS (2003). Physiological and biochemical responses of two cultivars of wheat to elevated levels of CO2 and SO2, singly and in combination. Environmental Pollution, 121:189-197.
Begum A, Harikrishna S (2010). Evaluation of some tree species to absorb air pollutants in three industrial locations of South Bengaluru, India. E-J Chem 7:151–156
Bell JNB and Mudd CH (1976). Sulphur dioxide resistance in plants: a case study of Lolium perenne. In Effects of Air Pollutants on Plants (T. A. Mansfield, ed.), Cambridge: Cambridge University Press. pp. 87-103.
Bhandarkar S (2013). Vehicular Pollution, Their Effect on Human Heatlh and Mitigation Measures. Vehicle Engineering 1(2):33-40.
Bradford MM (1976). A rapid and sensitive method for the quantitation of microgram quantities protein utilizing the principle of protein dye binding, Anal. Biochem. 72: 248–254.
Chen YM , Lucas PW , . Wellburn AR (1990). Relative relationship between foliar injury and change in antioxidants levels in red and Norway spruce exposed to acidic mists. Environ. Pollut., 69:1-15.
Conklin PL ( 2001). Recent advances in the role and biosynthesis of ascorbic acid in plants, Plant Cell Environment 24: 383-394.
Davis DD and Wilhour RG (1976). Susceptibility of Woody Plants to Sulfur Dioxide and Photochemical Oxidants. Corvallis, Oregon, U.S.A.: U.S. Environmental Protection Agency, Ecology Research ServiceEPA-600/3-76-102.
Dedio W 1975, Water relations in wheat leaves as screening test for drought resistance., Canadian Journal of Plant Science, 55(2), 369-378.
Desai, A. A. (2018). A review on Assessment of Air Pollution due to Vehicular Emission in Traffic Area.
Dey PM (1990): Oligosaccharides. In: Dey P.M., Harborne J.B. (eds.): Methods in Plant Biochemistry, Vol. 2, Carbohydrates. Academic Press, London: 189–218.
Dugger WM, Ting IP (1970). Air pollution oxidant – their effects on metabolic processes in plants. Annu. Rev. Plant Physiol., 21: 215-234.
Durzan DJ, Steward FC (1989). Nitrogen metabolism. In: F.C. Steward, R.G.S. Bidwell (Eds.), Plant Physiology: a treatise, vol. VIII, Academic Press, New York (1989), p. 55265.
Eckert RT and Houston DB (1982). Foliar peroxidase and acid phosphatase activity response to low level SO 2 exposure in eastern white pine clones. Forestry Science 28: 661-664.
Gaurav, P., Kumar, J. N., Narendra, N., & Chatap, V. K. (2010). Bougainvillea glabra—a natural indicator. Pharmacogn J, 2(5), 25-28.
Hiscox JH, Israelstam GF (1979). A method for extraction of chlorophyll from leaf tissues without maceration. Canad. J. Bot. 57: 1332–1334.
Irerhievwie, GO, Akpoghelie JO and Esiefarienrhe, E. (2014). Evaluation of Some Plant Species for Soluble Sugar and Air Pollution Tolerance Index in Oleh Metropolis, Isoko South LGA, Delta State, Nigeria. Journal of Emerging Trends in Engineering and Applied Sciences (JETEAS), 5(5), 323-328.
Jain, S., Bhattacharya, T., & Chakraborty, S. (2019). Comparison of Plant Tolerance Towards Air Pollution of Rural, Urban and Mine Sites of Jharkhand: A Biochemical Approach to Identify Air Pollutant Sink. In Advances in Waste Management (pp. 123-142). Springer, Singapore.
Joshi NC (1990). “Experiments in Phytomonitoring of Urban Atmosphere,” Ph.D. Thesis, University of Mumbai, Maharashtra, India.
Joshi PC, Swami A (2007). Physiological responses of some tree species under roadside automobile pollution stress around city of Haridwar, India. Environmentalist, 27 (2007), pp. 365-374.
Kadiyali RL (1996). Traffic engineering and transport planning, Khanna Publication, Delhi, 5:499.
Keller T, Schwager H (1977). Air pollution and ascorbic acid. European Journal of Forest pathology 7:.338-350.
Khalid, S. (2019). Phytomonitoring of air pollution around brick kilns in Balochistan province Pakistan through air pollution index and metal accumulation index. Journal of Cleaner Production.
Königshofer H, Löppert HG (2015). Regulation of invertase activity in different root zones of wheat (Triticum aestivum L.) seedlings in the course of osmotic adjustment under water deficit conditions. J Plant Physiol, 183:130-137.
Lee LP, Takahashi T (1966). An improved colorimetric determination of amino acids with the use of ninhydrin. Anal. Biochem. 14:71-77.
Lee EH, JerseyJA, Gifford C and Bennett J (1984). Differential ozone tolerance in soybean and snapbeans: analysis of ascorbic acid in O3-susceptible and O3- resistant cultivars by high performance liquid chromatography. Environmental Exploratory Botany 2: 331-341.
Ogunrotimi, D. G., Adereti, F. K., Eludoyin, A. O., & Awotoye, O. O. (2017). Urban air pollution control: selection of trees for ecological monitoring using anticipated performance indices in a medium-size urban area in Southwest Nigeria. Interdisciplinary Environmental Review, 18(1), 40-54.
Orliński, P., Gis, M., Bednarski, M., Novak, N., Samoilenko, D., & Prokhorenko, A. (2019). The legitimacy of using hybrid vehicles in urban conditions in relation to empirical studies in the WLTC cycle. Journal of Machine Construction and Maintenance. Problemy Eksploatacji.
Panda and Rai, (2015). Roadside plants – study on eco-sustainability Lambert Publisher, Germany. Indian Bot. Cont., 7 (4): 159-162.
Pasqualini S, Batini P, Ederli L, et al (2001). Effects of short-term ozone fumigation on tobacco plants: response of the scavenging system and expression of the glutathione reductase, Plant Cell Environment 24:245-252.
Pathak, R. K., Tomar, C., & Mahajan, S. (2015). Phytomonitoring of atmospheric pollution in road side perennial trees of Indore city (MP) India. International Journal of Advances in Engineering & Technology, 7(6), 1727.
Prajapati, SK and Tripathi, BD (2008). Anticipated Performance Index of some tree species considered for green belt development in and around an urban area: A case study of Varanasi city, India. Journal of environmental management, 88 (4), pp.1343-1349.
Rai and Panda, 2015. (2015). Assessment of air pollution tolerance index (APTI) with road side plants in East and North East India: an eco-sustainable approach. Journal of Pollution Effects and Control (2015).
Rai, P. K. (2016). Impacts of particulate matter pollution on plants: Implications for environmental biomonitoring. Ecotoxicology and environmental safety, 129, 120-136.
Ravindra, Khaiwal, Atul K. Mittal, and René Van Grieken (2001). Health risk assessment of urban suspended particulate matter with special reference to polycyclic aromatic hydrocarbons: a review. Reviews on environmental health
Sadasivam S, Manickam, A (1996). Biochemical methods. New age international (P) Limited, Publishers, II (ed) New Delhi, pp-152-160.
Saha DC ,Padhy PK (2011). Effects of stone crushing industry on Shorea robusta and Madhuca indica foliage in Lalpahari forest. Atmospheric Pollution Research, 2: 463-47.
Singh SK, Rao DN, Agrawal M, Pandey J and Narayan D (1991). Air Pollution Tolerance Index of Plants. Journal of Environmental Management 32: 45-55.
Tripathi AK, Gautam M (2007). Biochemical parameters of plants as indicators of air pollution. J. Environ. Biol., 28: 127-132.

