Bui Thi Thu Hien1, Pham Thi Diem1, Vu Thi Quyen3, Bui Thi Minh Nguyet4, Le Anh Tung5, Nguyen Thanh Binh6, Pham Van Tuyen7, Nguyen Khac Bat8, Tran Thi Thu Hang9 and Hoang-Dung Tran10,*![]()
1,2, 3,4,5, 6, 7, 8Research Department of Post-harvest Technology, Research Institute For Marine Fisheries, Ministry of Agriculture and Rural Development, 224 Le Lai Street, May Chai Ward, Ngo Quyen District, Hai Phong City 04218, Viet Nam.
9Tran Thi Thu Hang: Faculty of Food Science and Technology, Vietnam National University of Agriculture, Trau Quy Ward, Gia Lam District, Ha Noi City 12406, Viet Nam
10Hoang-Dung Tran: Faculty of Biotechnology, Nguyen Tat Thanh University, 298A-300A Nguyen Tat Thanh Street, Ward 13, District 4, Ho Chi Minh 72820, Viet Nam
Corresponding author email: ptdiem@rimf.org.vn and thdung@ntt.edu.vn
Article Publishing History
Received: 06/04/2020
Accepted After Revision: 27/05/2020
The study aimed to evaluate the variation of sensory, physicochemical, and microbiological quality indices with storage time on Indian Mackerels preserved on ice. The research was done on Indian Mackerel caught in one offshore fishing trip, stored on ice traditionally within 25 days. The quality indices were assessed and recorded on the 0, 3rd, 5th, 10th, 15th, 20th, and 25th day of the storage period. Quality Index (QI), pH, PVB-N, NH3, TMA, NPN, PV, TBA, and TPC were experimented and recorded. Data were analyzed using descriptive statistic method. QI varied from 0-31 points. Visually significant quality changes appeared between 10-15 days of storage. The pH range was from 6.07 ± 0.02 to 7.16 ± 0.04 (p <0.05). The NH3 content was from 16.25 ± 0.04 to 119.03 ± 0.05 percent; the TVB-N value was from 119.03 ± 0.05 to 152.57 ± 2.89 mg per 100g; the TMA value ranged from 6.07 to 20.39 mg per 100g; the NPN content was from 0.24 to 0.77 percent. The PV range was 0.91 ± 0.06 to 5.14 ± 0.09 meq per kg, while TBA was from 63.01 ± 0.51 to 571.87 ± 3.50 μmol per kg. The TPC ranged from 12.4 to 4.1×10⁵ CFU per g. All indices showed a linear increment relationship with time of storage. QI scheme suggested for Indian Mackerels was 0-15 QI points, and the estimated shelf-life was ten days for whole fish storage on ice. The pH and some nitrogen related quality indices (NH3, TVB-N, and NPN) had a slight relationship to the acceptable sensory quality limit while the lipid-related index did not. They could be indicators or estimators to spoilage of fish under the studied conditions. The TPC showed similar to prior studies. Indian Mackerels were foiund to have 10-15 days shelf-life under the studied storage conditions, which was not enough for offshore fishing time, but it could be acceptable in VietNam Fishing industry condition. The sensory, physicochemical, and microbiological indices were extensively assessed and formed a foundation to further research on the preservation and quality evaluation of the Indian Mackerels on the Vietnamese market.
Sensory; Physicochemitry; Microbiology; Quality Index; Indian mackerel; Rastrelliger kanagurta; Ice Storage.
Hien B. T. T, Diem P. T, Quyen V. T, Nguyet B. T. M, Tung L. A, Binh N. T, Tuyen P. V, Bat N. K, Hang T. T. T, Tran H. D. The Variation of Sensorial, Physiochemical and Microbiological Quality Index in Indian Mackerel, Rastrelliger kanagurta in Ice Storage Procedure. Biosc.Biotech.Res.Comm. 2020;13(2).
Hien B. T. T, Diem P. T, Quyen V. T, Nguyet B. T. M, Tung L. A, Binh N. T, Tuyen P. V, Bat N. K, Hang T. T. T, Tran H. D. The Variation of Sensorial, Physiochemical and Microbiological Quality Index in Indian Mackerel, Rastrelliger kanagurta in Ice Storage Procedure. Biosc.Biotech.Res.Comm. 2020;13(2). Available from: https://bit.ly/2VFeXKL
Copyright © Hien et al., This is an open access article distributed under the terms of the Creative Commons Attribution License (CC-BY) https://creativecommns.org/licenses/by/4.0/, which permits unrestricted use distribution and reproduction in any medium, provide the original author and source are credited.
INTRODUCTION
Fresh fish is an essential seafood product, accounting for more than one-third of total fish products on the world trade market (FAO 2012). Fish and seafood are considered rich and economical animal protein sources and play the primary role in nutritional prevention, especially in coastal underdeveloped and developing countries (Alasalvar et al., 2011; Humaid & Jamal 2014). Indian mackerel (Rastrelliger kanagurta) is a species of Scombrid family (Scombridae). In Vietnam, the total yield of Indian mackerels in the fishing industry is 4842 ton/year in the Northern Sea, 4050 ton/year in Central, and the highest in East Southern 6560 ton/year (Nguyen, 2020).
Indian mackerel is one of the top yield food fish species among small pelagic fish and is the most consumed fish in the Vietnamese domestic market. Freshness is an essential parameter in the quality assessment of human consuming foodfish in the market that not only closely related to food safety but also the economic benefits of fishers. Without proper storage and preservation practices, fish start their spoiling process very shortly after being cached. The spoilage has two leading causes: the biochemical cause from the digestive enzymes in the fish and the microbiological reason from the microorganism from the fish intestine and surface, as well as from the storage environment. Both causes are highly dependent on temperature, in which the closer to ice melting temperature (0 oC), the slower the spoiling process. For this reason, ice in various forms is used all around the world for fresh fish storage and preservation and could be applied in Viet Nam as recommended by TCVN 3696:1981. Various prior studies proved the relationship among temperature and time to the changes in Indian mackerel quality in different storage and preservation conditions, (Gopalakrishnan et al.,, 2016; Humaid & Jamal, 2014 Chudasama et al., 2018).
Studies mainly assessed biological characteristics (Chu et al., 1998), resources, and reserves (Nguyen, 2020). Still, there was not yet any research on the changes of quality in Indian mackerel during processing and preservation in Viet Nam. The biochemical transformation in fish species is highly differentiated, depending on the stage of mature, method, season and time of fishing, and conditions of storage and preservation. In the fishing ships, trading markets or processing facilities, long term storage, and exposure to underqualified hygienic procedures might lower the quality of fresh fish. Considering the importance of keeping the highest fresh fish quality possible, this study aimed at evaluating the changes in the sensory, physicochemical, and microbiological quality index in Indian Mackerel (Rastrelliger kanagurta) in ice storage procedure. The quality indices included sensory grading, pH, total volatile basic nitrogen (TVB-N) values, trimethylamine (TMA), ammonia (NH3), non-protein nitrogen (NPN) content, peroxide value (PV), Thiobarbituric Acid (TBA) value, and total plate count (TPC) of microorganism.
MATERIALS AND METHODS
The study was conducted on Indian mackerel fish at size 5-7 individuals per kg, collected from offshores fishing boat in April 2019. The samples were taken from the first over 100kg Indian mackerel batch cached offshores. Sample fish at the size of 5-7 individuals per kg were collected randomly from the batch. Fish was stored in-tray of 5kg with 5 kg ice in alternated layering, one layer of fish one layer of ice. Experimental lots were marked 0; 3; 5; 10; 15; 20 and 25 respective to the number of days, each lot had three repetitions. At each testing period respective to the lot number, the fish was checked for sensory grading; after that, the processed and gutted based on the method described in TCVN 5106-1990 (according to Codex CAC/RCP 9-1976); and deep-frozen for offshore testing.
The samples were then transferred to the Lab of Marine Sciences – Research Institutes for Marine Fisheries for physicochemical indices after the fishing trip had finished (within 25-30 days). All analytical grade chemicals using for evaluating physical-chemical and microbiological parameters were supplied by Merck chemical company, Germany, through a dealer in Viet Nam (THANG LONG Science Technique., JSC).
Sample preparation:Samples for sensory grading were the whole fish randomly selected from respective lots. Samples for physicochemical evaluation were the whole clean fish without internal organs, minced into a fine powder, and tested within 4 hours after processing (according to TCVN 5276-90).
The sensory assessment was done using the Quality Index Method (QIM) (Bernardi et al., 2013). The sensory attributes to be evaluated were skin, eyes, gills, and texture. Each quality was scored from 0 to 3, the lower, the better. All merit scores were then summed to form the demerit score or the QIM points. The pH value was obtained using pH meter (Mi 150 – Martini – Rumania) according to the method described in TCVN 4835:2002 – ISO 2917:1999. TVB-N was measured according to TCVN 9215:2012 (Commission Regulation (EC) No 2074/2005 of 5 December 2005, Annex II, Section II, Chapter III Determination of the concentration of TVB-N in fish and fishery products). Trimethylamine (TMA) value, NPN content and Thiobarbituric acid (TBA) value were determined according to Woyewodal (1986). NH3 value was measured according to TCVN 3706 – 90. Peroxide value (PV) was determined using iodometric (visual) endpoint determination (TCVN 6121:2018 -ISO 3960:2017). Total bacteria were identified using the total plate count method, according to TCVN 4884-1:2015-ISO 4833-1:2013.
Data collected were analyzed using descriptive statistic method (averaging, standard deviation, p-value) using Anova and Statgraphic XV statistical software. Each experiment was done three times.
RESULTS AND DISCUSSION
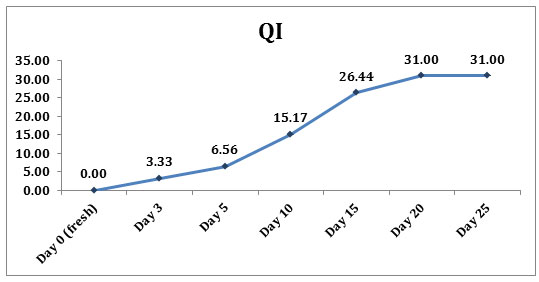
The Quality Index points of Indian Mackarel stored in ice for 0, 3, 5, 10, 15, 20, and 25 days were presented in Chart 1. The fish got the highest quality (0 points) on day 0 and the QI increase linearly with the storage time till reaching its highest points of 31 on day 20 till 25. The fish remained good quality within the initial five days with slow QI increment and reached its transformation point on day 10 with a sharper increase in its QI points.
Chart 1: The Quality Index points of Indian Mackarel stored in ice
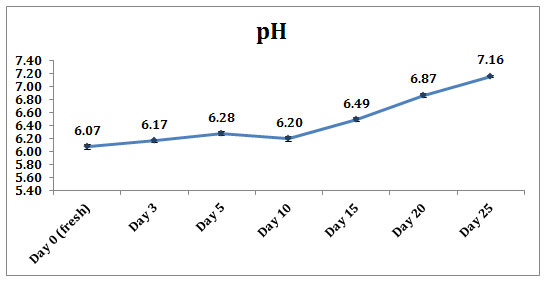
Fresh fish had pH value of 6.07 ± 0.02 (P < 0,05) on day 0. The pH noticeably increased to 6,27± 0,02 (P < 0,05) after 5 days, and slightly decreased to 6.20± 0.03 (P < 0,05) on day 10. After day 10, the pH value sharply increased to 7.16± 0.04 at the end of the storage period on day 25, see Chart 2.
Chart 2: pH value by storage time
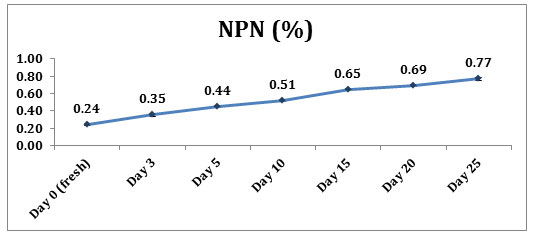
NH3, TVB-N, TMA, and NPN variation were presented in Chart 3, 4, 5 and 6, respectively. NH3 content in the fish’s flesh advanced from 16.25 ± 0,04 percent on day 0 to 119.03± 0,05 percent after 25 days preserved on ice (P<0.05). TVB-N value was from 13.17 ± 0.53 mg per 100g on day 0 to 152.57 ± 2.89 mg per 100g on day 25. The acceptable quality value of 34-35 mg per 100g fell in between day five and day 10 of the storage period. TMA value presented a flat curve between 6.07 on day 0 and 20.39 mg per 100g on day 25 with a slight increase by time. The significant increase was noted on day five and day 25 of the storage period. NPN content increased linearly with storage time, from the initial value of 0.24± 0.005 % to 0.77 ± 0.003 % at the end of the storage period on day 25.
Chart 3: NH3 content by storage time
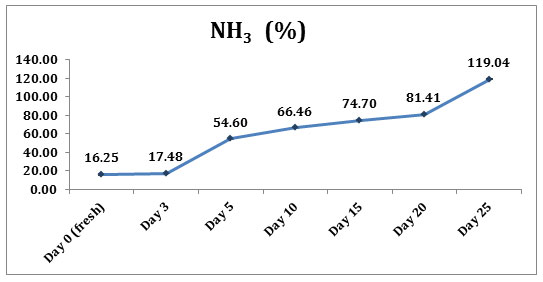
Chart 4: TVB-N value by storage time
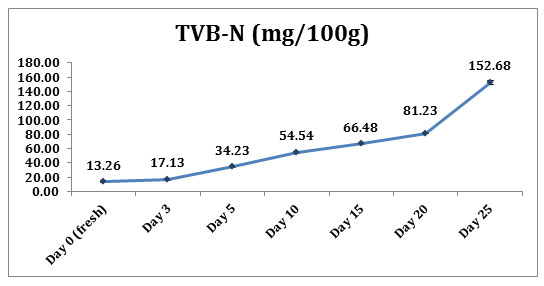
Chart 5: TMA value by storage time
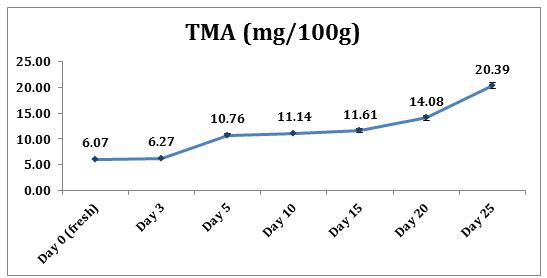
Chart 6: NPN content by storage time
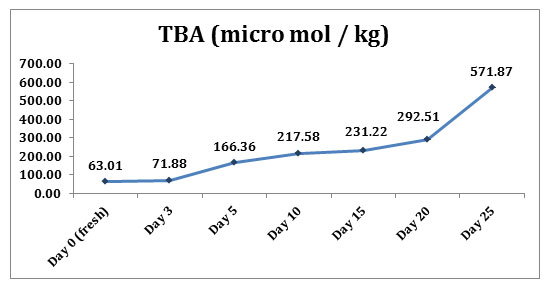
PV and TBA value results were shown in Chart 7 and Chart 8, respectively. PV increased linearly with storage time. On day 0, PV was 0.91 ± 0.06 meq per kg lipid and slowly rose to 1.70±0.03 on day 15. PV showed a sudden turn after day 15 and quickly increased to 5.14±0.09 on date 25 of the storage period. TBA value showed a significant difference (p<0.05) during the storage period. Initial TBA value was 63.01 ±0.51 μmol per kg, and then it increased linearly by time to 571.87 ± 3.50 μmol per kg on day 25.
Chart 7: PV value by storage time
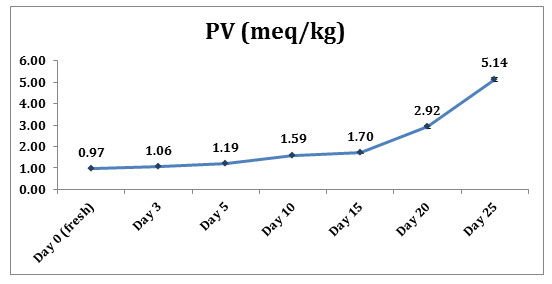
Chart 8: TBA value by storage time
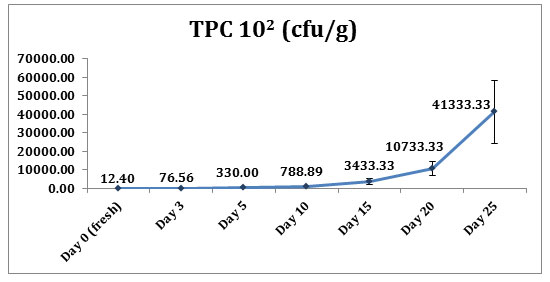
There was a clear increment in TPC among the time marks. When freshly caught, the fish have shown TPC of only 12.4 CFU per g. TPC escalated rapidly to 4.1×10⁵ at the end of the storage period. The total plate count (TPC) result was shown in Chart 9.
Chart 9: TPC by storage time
As the aim of the QIM system, a linear relationship between QI and storage time on ice was established and observed for whole Indian mackerels in this study. QI point variation was between 0-31 with a significant increment between days 5 and 10. The entire Indian mackerel fish have normally shown noticeable spoilage in skin and belly within 10-15 days. The result was comparable to the previous report of Indian mackerel recommended good quality after 5-6 days of storage at 4oC (Humaid & Jamal, 2014) and estimated seven days shelf life for gutted Horse mackerel chilled on ice (Bernardi et al., 2013). In our study, we suggested the QI scheme of 0-15 QI and an estimated ten days shelf –life for Indian mackerel.
The pH value in raw fish had small variations, but significant implications in terms of technology. However, pH could not be used as the only indicator of the freshness of fish. The pH results in our study for Indian mackerels were between 6.08 – 7.17, similar to the range of 6.07-7.27 reported by Chudasama et al. (2018) for Indian mackerels stored chilled in ice. In another report, pH value of caught fish, depended in season, species and other factors, varying from 6.0-7.1, of which freshly caught fish value was 6.0-6.5, acceptable quality fish was 6.8 and spoiled fish was over 7.0 (except some fish with basal flesh such as shark or ray)(Simeonidou et al., 1998). In our results, the pH value had high variation between day 10 and 15, similar to the period with high differentiation of sensory quality, as pH is the most critical factor that affects the meat structure and the meat stiffness, an activity of the connective tissues (Huss, 1988).
Ammoniac (NH3) forms in cold storage fish from two pathways and is not considered an essential indicator for freshness. The NH3 increases during the storage and preservation period of seafood, forming due to the deposition of protein, amino acid and other nitrogen compounds under the bacterial activities (Lougovois and Kyrana, 2014) or the self-decomposition of adenosine monophosphate (AMP) in chilled seafood (Huss, 1995). Although no study in Indian mackerel was reported, the variation of NH3 in our study represents the linear increment with storage time, similar to studies in most of the other fish species (Huss, 1995). According to Etienne et al. (2005), NH3 is an indicator of the lack of freshness but not the spoilage in fish (Etienne & Ifremer, 2005)
The TVB-N is a standard method to determine the usable limit of fish in wet preservation and a spoilage estimation indicator (Boee et al., 1982; Fatih & Yesim, 2000). TVB-N included the measurement of trimethylamine, dimethylamine, ammoniac, and other volatile essential compounds formed during seafood spoilage. TVB-N values increase linearly with time and storage temperature. Seafood is in the best quality when TVB-N value is 25 mg per 100g, the limit of good quality is 30 mg per 100g, the acceptable limit is 35 mg per 100g and over that is considered spoilage according to Amending regulation (EC) No 2074/2005 (2008). In our study, TVB-N value increased from the best quality level of 13.17 ± 0.53 mg/100g on day 0 to acceptable limit of 34-35 mg/100g on day 5-7, comparable to Chudasama et al. (2018). It showed a close estimation of the time of the significant sensory change at day 10. The observation was also similar to reports from other authors that TVB-N value had a close correlation to the sensory points and number of microorganisms (Amegovu et al., 2012) and was related to the later phase of spoilage (Rehbein & Oehlenschlager, 1982).
TMA is an odorous reduction product of trimethylamine oxide (TMAO) in most marine species due to bacteria activities. TMA is often used as an indicator of bacterial spoilage in fish but due to the different initial amount of TMAO in each fish species as well as other seasonal effects, the correlation between TMA and sensory quality of seafood is not significant (Woyewodal, 1986). In our study, the range of TMA was from 6.07 to 20.39 mg per 100g, with a slightly steeper increase on day five and day 25 of the storage period.
The nature and composition of non-protein nitrogen (NPN) in fish affect the taste, quality and preservative potential, which plays a vital role in deciding the eatability of the fish. NPN accounts for 9-18% of total nitrogen content in fish. In living fish, the main composition of NPN is creatine and a large number of free amino acids (Vivekanandan & Jayasankar, 2008). In preserved fish, the NPN content included compounds formed during preservation or products of the decomposition process, such as ammonia, trimethylamine, derivatives of guanidine and imidazole, urea, amino acids, purine and pyrimidine. The changes in concentration of these compositions reflect changes in the fish muscles before spoilage appears in sensory measures. Therefore, NPN can be used as an estimator for fish quality. The distributions of different nitrogen composition are distinct among fish species and depended to the environment, reproductive cycle, season, size and age of the fish (Petricorena, 2015; Velankar NK and Govindan TK, 1958). In this study, the NPN value showed a slight decrease in day five and continuously increased from day 10. The variation theme might present the change in the composition of NPN in the relationship with the decomposition process and line with sensory observation.
Peroxide value in fish is considered an index to evaluate the spoilage that very sensitive to the environment and time and mostly applied to fatty fish (Hras et al., 2000). In our study, the PV gradually increased with storage time and significantly higher at the end of the storage period, comparable to a prior report of PV value in Indian Mackerels (Binsi et al., 2016)
Similarly, the PVA is an indicator of the decrease of lipid in fish muscle. The TBA value in Indian mackerels is higher than other fish species thanks to the concentration of unsaturated fatty acid and antioxidants in the meat. In this study, the TBA value increases linearly with storage time, comparable to prior research on Indian mackerel (Sathishkumar et al., 2017). The two lipid-related indices, PV and PVA, had no swift changes at day 10-15 that marked the significant transforming in the sensory quality of the fish. Therefore, we assumed that these two indices have a weak correlation with the sensory index.
Total plate count results showed rapid growth in the number of bacteria after 25 days of storage, similar to other studies on Indian mackerels (Humaid & Jamal, 2014; Sathishkumar et al., 2017). The storage of the whole fish is one of the reasons to increase the risk of bacterial spoilage as bacteria in the gut and internal organs will quickly develop and speed up the spoiling process (Lougovois & Kyrana, 2014). The TPC is affected by the hygienic conditions of the storage cellar, the quality of ice or chilled water used to preserve and other environmental factors.
CONCLUSION
In this study, we assessed the indices to evaluate the quality of Indian mackerels in traditional ice storage conditions within 25 days, equivalent to a regular offshore fishing trip. The sensory variety of the fish showed significant step down after 10-15 days of storage. These results suggested that the current storage method could not cope with the traditional offshore fishing period and prosed high risk of quality and economy lost. Still, it could be acceptable in Viet Nam industry fishing condition. Some physicochemical indices such as pH and nitrogen related indices (TVB-N, PNP) showed an anticipated relationship to the signification sensory quality changes time while the lipid-related indices and TPC did not. Our study as extensively assessed the sensory, physicochemical and microbiological indices on Indian mackerels. It formed a foundation to further research on the preservation and quality evaluation of the specie on the Vietnamese market.
ACKNOWLEDGMENT
We would like to express our sincere thanks to the Vietnamese Ministry of Agriculture and Rural Development for supporting the financial and favorable conditions for the successful completion of this research “Research and evaluate the post-harvest losses level on offshore fishing boats (falling net, purseiner, trawler, pair-trawler, handliner)” (20/HĐ-KHCN, 22/01/2018).
REFERENCES
Alasalvar C Miyashita K Shahidi F and Wanasundara U (2011). Handbook of seafood quality, safety and health applications. Blackwell Publishing Ltd New Delhi 13-29.
Amegovu AK Sserunjogi ML Ogwok P and Makokha V.(2012) Nucleotide degradation products, total volatile basic nitrogen, sensory and microbiological quality of Nile pearch (Lates niloticus) fillets under chilled storage Journal of Microbiology, Biotechnology and Food Sciences Vol 2 No 2 Page 2653-2666.
Amending regulation (EC) No 2074/2005 as regards the total volatile basic nitrogen (TVB-N) limits. In: Communities, T. C. O. T. E. (ed.) 1022/2008. Official journal of the European Union.
Bernardi D Marsico E and Freitas M (2013) Quality Index Method (QIM) to Assess the Freshness and Shelf Life of Fish Brazilian Archives of Biology and Technology Volume 56 Page 587-598.
Binsi PK Nayak N Sarkar PC Sahu U Ninan G and Ravishankar CN (2016) Comparative evaluation of gum arabic coating and vacuum packaging on chilled storage characteristics of Indian mackerel (Rastrelliger kanagurta) J Food Sci Technol Vol 53 No 4 Page 1889–1898.
Boee B Losnegrad N and Xu XL (1982) Determination of indole as freshness assessment of shrimp Fiskeridir Skr Vol 2 Page 35-38
Chu TV Bui DC and Nguyen PD (1998) Proceedings of research work “Marine fisheries” Episode 1 (1998) – Research Institute for Marine Fisheries (in Vietnamese).
Chudasama BG Dave TH and Bhola DV (2018) Comparative study of quality changes in physicochemical and sensory characteristics of iced and refrigerated chilled store Indian Mackerel (Rastrelliger kanagurta) Journal of Entomology and Zoology Studies Vol 6 No 4 Pages 533-537.
Etienne M and Ifremer N (2005) Project 6.3-Valid Volatile amines as criteria for chemical quality assessment. http://citeseerx.ist.psu.edu/viewdoc/download?doi=10.1.1.621.1787&rep=rep1&type=pdf
FAO (2012) The State of World Fisheries and Aquaculture 2012, Access date, May, 14, 2014, from : http://www.fao.org/docrep/016/i2727e/i2727e00.htm
Fatih O and Yesim O (2000) Comparision of methods used for determination of total volatile basic nitrogen (TVB-N) in rainbow trout (Oncorhynchus mykiss) Turky journal of zoology Vol 24 Page 113-120.
Gopalakrishnan S Sasidharan V Sunder J Mudavath M and Kumar RR (2016) Effect of storage temperature on sensory and microbial quality of Rastrelliger kanagurta (Cuvier, 1816) from Andaman Coast Advances in Animal and Veterinary Sciences Vol 4 No 9 Page 468-475.
Hras AR Hadolin M Knez Ž and Bauman D (2000) Comparison of antioxidative and synergistic effects of rosemary extract with α-tocopherol ascorbyl palmitate and citric acid in sunflower oil Food Chem Vol 71 Page 229–233.
Humaid SA and Jamal MT (2014) Effect of Storage Temperatureon Histamine Formation and Bacterial Growth in Whole Three Fish Species (Rastrelliger kanagurta, Sardinella gibbosa and Lethrinus lentjan) Life Sci. J. Vol 11 No 9 Pages 927-937.
Humaid SA and Jamal MT (2014) The Effect of Storage Temperature (4°C, 15°C and 25°C) on The Shelf Life of Whole Marine Fish (Rastrelliger kanagurta) IOSR Journal of Environmental Science, Toxicology and Food Technology Vol 8 No 11 Ver. I (Nov. 2014) Page 46-51.
Huss HH (1988) Fresh Fish Quality and quality changes. FAO Fisheries Series No 29 FAO Rome.
Huss HH (1995) Quality and quality changes in fresh fish. Food and Agriculture Organization (FAO). Fisheries Technical Paper 1995.
Lougovois VP and Kyrana VR (2014) Freshness Quality and Spoilage of ChillStored Fish Nova Science Vol 2 Page 35-86
Nguyen (??) (2020) Investigate the overall changes in the current state of Vietnam’s seafood, from 2016 to 2020. (In Vietnamese)
Petricorena ZC (2015) Chemical Composition of Fish and Fishery Products. In: Handbook of Food Chemistry Pp 403-435 (Edited by) Cheung PCK and Mehta BM. Springer-Verlag Berlin Heidelberg.
Rehbein H and Oehlenschlager J (1982) Zur Zusammensetzung der TVB-NFraktion (fulchtige Basen) in sauren Extrakten und alkalischen Destillaten vonSeefischfilet Archiv fur Lebensmittel-Hygiene.
Sathishkumar RS Bhowmik S Dasgupta S Sundaramanicka A Meena M and Saranya K (2017) Influence of Storage Temperature on Quality Index of Commercially Important Food Fish Indian Mackerel (Rastrelliger kanagurta) (Cuvier 1817) International Journal of Scientific Research in Science Engineering and Technology Vol 3 No 8 Page 926-932.
Simeonidou S Govaris A and Vareltzis K (1998) Quality assessment of seven Mediterranean fish species during storage on ice Food Research International Vol 7 Page 479-484.
Velankar NK and Govindan TK (1958) A preliminary study on the distribution ò non protein nitrogen in some marine fisher and invertebrates. Proc Ind Acad Sci Vol 47B Page 202 – 209.
Vivekanandan E and Jayasankar J (2008) Impact of Climate Change on Indian Marine Fisheries Lecture Notes Lecture Notes Lecture Notes Part 1 Compiled and Edited Central Marine Fisheries Research Institute (CMFRI) (Indian Council of Agricultural Research) P.B. No. 1603 Cochin – 682 018.
Woyewodal AD (1986) Recommended Laboratory Methods for Assessment of Fish Quality (1986) Page 21-25.

