1* King Abdulaziz University, Jeddah Saudi Arabia. 1+University of Carthage, Tunisia.
Article Publishing History
Received: 06/10/2019
Accepted After Revision: 24/11/2019
This paper describes the recent Tunisian reform and available options on major issues within this reform framework A country’s economic growth and political stability are two very important factors in the smooth running of an economy. Tunisia stands crippled by a climate of economic uncertainty. This has led the economy to suffer very serious collateral damage. Supply and demand seem to be affected, weakening all macroeconomic balances. The National Pension and Social Security Fund known as the CNRPS is in a critical situation and raises many fundamental and complex questions, which have been the subject of an ongoing hot debate. The objective of this study was to analyse and describe the reform of the general pension scheme and health insurance fund in Tunisia. The reform of the general pension scheme and health insurance fund is among the first in Africa countries. In order to find the best possible evidence, this was a review of online grey literature on regulatory approaches to reform the national pension and Social Security Fund known as the CNRPS and propose solutions related to the general pension system. The whole working career is the basis for the pension and the benefit drawn at a given age. Tunisian health insurance as CNRPS organization should robust retirement income system that delivers good benefits.
Health Insurance, General Pension, Reform, Contribution Rate, Retirement, Revision of Pension
Rahmoun M, Amira B. The Reforms of the General Pension Scheme: Evidence From the Tunisian Health Insurance Fund. Biosc.Biotech.Res.Comm. 2019;12(4).
Rahmoun M, Amira B. The Reforms of the General Pension Scheme: Evidence From the Tunisian Health Insurance Fund. Biosc.Biotech.Res.Comm. 2019;12(4). Available from: https://bit.ly/31LxZ35
Copyright © Rahmoun and Amira This is an open access article distributed under the terms of the Creative Commons Attribution License (CC-BY) https://creativecommns.org/licenses/by/4.0/, which permits unrestricted use distribution and reproduction in any medium, provide the original author and source are credited.
INTRODUCTION
The rapid economic growth of a country plays a very important role in its national and international development. Some several researches have more or less explicitly – 2004 pointed to other aspects of recent pension restructuring. Privatization (Hinrichs, 2004), the segmentation between contributory and non-contributory benefits (Palier, 2002) and policies addressing new social risks (Bonoli, 2003, 2004) can be mentioned as selective examples. All persons who work in corporate enterprises, including company directors, are considered to be employees (OECD, 2018 ;2019). However, Tunisia’s economic situation has changed and has thus affected the CNRPS pension fund. Since then, this latter has been facing a threat that still remains serious with regard to the imbalance in the general pension system (Department of Public Expenditure and Reform, 2019). Knowing that the main source of funding for the fund’s plan is the pay-as-you-go scheme, which is originally the concatenation of the two words: contribution (by the employee with a rate of 8.2%) and contribution (by the employer with a rate of 12.5%). It is therefore the time to ask the following question: What pension plans does the CNRPS have? What are the causes of the budget deficit of this system? What are their consequences on the cash register? And what must be done to face this deficit in order to help the fund survive?
The Fund’s Plans
The CNRPS operates social security schemes for public officials, local authorities, public administrative institutions, and national companies. These are essentially four pension plans to mention:
The death benefit plan: This plan is financed through contributions deduced from the salaries of the active insured and retired employees and investments generated by the growth of the plan’s reserves.
The subsidized scheme: The pensions provided by the latter are financed entirely from the State budget.
The general regime: General pension plans are plans whose beneficiaries are employees of large public institutions. In Tunisia, the legal retirement age is still 60 years, but it is expected to be extended to 62 years very soon.
The special regime: Special pension schemes are pension schemes from which members of a governorate benefit. Some different pension schemes keep the unequal conditions without any coordination. (As Pension Reform in France)
The fund reserves: Reserves are built up from plan surpluses and depend on the length of time and investment rate and the size of the gap between the contribution rate required to maintain equilibrium and the current contribution rate. These reserves can be used to cover the annual deficits of a scheme in times of economic difficulties and can be a source of funding for the social security system through the income they generate when they bear fruit.
The fund system: Since Tunisia’s independence in 1956, social security systems have diversified and social security coverage has continued to expand to cover the largest number of the employed population. In this regard, it is possible to consider two models of pension systems: pay-as-you-go or funded.
The pay-as-you-go system: In a pay-as-you-go pension system, the financing of pensions is ensured by compulsory deductions from the working population. These deductions are then redistributed to pensioners in the form of a pension. Working people do not contribute for themselves when they retire, but for today’s retirees. Their retirement will be ensured by the working people of tomorrow.
The funded system: Unlike the pay-as-you-go system, the funded system bears on the fact that active population institute savings, individual or collective, that are invested on the financial markets. When they reach retirement age, they draw on it to finance their retirement. Pensions are therefore funded by previous savings, not by a redistribution of contributions to retirees. Retirement, whether funded or distributed, is ensured by the income from working people, and of course for everyone.
Retirement pillars: To fully understand the role of the pension system in financing pensions, it is necessary to go through the pillars of the notion of retirement. These are four: The term “pillars” is a common vocabulary in pension financing. The pillars represent the different sources of income available to pensioners. We distinguish four pillars: Minimum seniority, past contributions-based pensions, individual savings, and work revenues.
Deficit Causes and Their Consequences on the Fund
The main causes fall into three categories:
- Cyclical causes, which combine circumstances because of the country’s economic situation. Indeed, on the one hand, unemployment and poverty are increasing, then the fund has fewer contributions at its disposal. On the other hand, wages also stagnate and so do social contributions deduced from wages and so do contribution revenues, which lead to slower growth and subsequently to a widening deficit.
- Exogenous structural causes which represent a set of causes caused by external factors related to the CNRPS system. These can be the increase in health expenditure and the deficit of the sickness branch as well as the old age branch which also generate an increase in the deficit of the system in question.
Endogenous structural causes, which are a set of causes formed within the fund system without external factors. They manifest themselves in the social contributions levied on salaries resulting in a decrease in revenues, the reimbursement of health care (see free care) and compensation for sick leave, leading to abuse. These in turn imply increased expenses, implying thus that all the causes presented above have generated a huge deficit in the general balance of the fund.
RESULTS AND DISCUSSION
Bearing on the detailed analysis of the deficit of the general pension system, we discuss two main components: revenues and expenditure. We present first the analysis of the evolution of revenues in response to the effect of the growth rate and the effect of the contribution rates. Second, we present the evolution of expenditure in terms of pensions and in terms of the evolution of the demographic component, which is very important.
Deficit analysis by revenue: The evolution of the deficit in response to the effect of revenue growth rate:
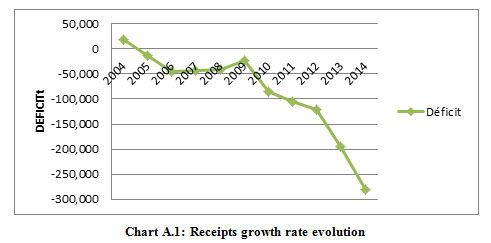 |
Figure 1: Receipts growth rate evolution |
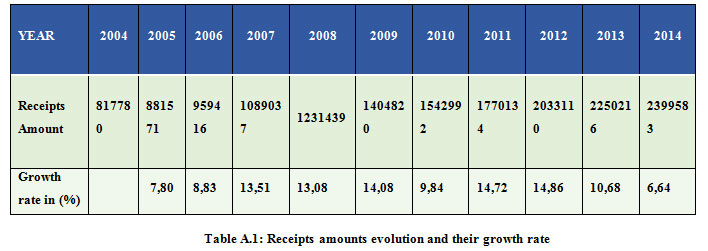
In Table 2.1, the amount of annual revenue has increased. It went from 817780 MD in 2004 to 2399583 MD in 2014. In the graph, revenue growth rate fluctuates from year to year. It is 7.80% in 2005, 14.72% in 2011 and 6.64% in 2014. Table A.2 shows the increase in pension subsidy rate by 1% during the second half of 2011:
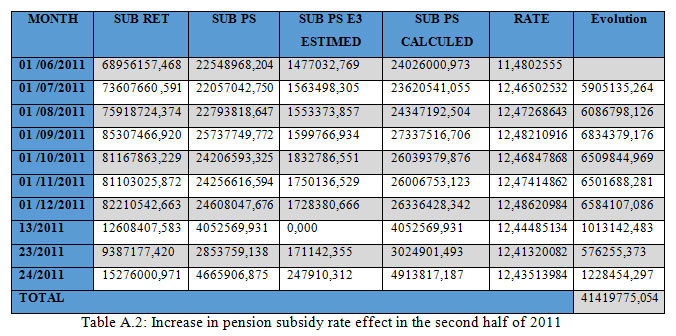
NB: the increase in the effect of the employer pension subsidy rate increased by 1% compared to the 2nd half of 2011, otherwise employer rate became 12.50% instead of 11.50% for the general scheme.
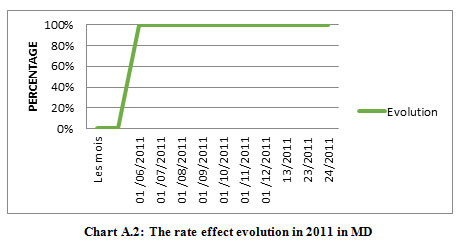 |
Figure 2: The rate effect evolution in 2011 in MD |
Therefore, bearing on Table A.2, a 1% increase in this rate has a positive and significant effect on the fund’s revenues, which is reported in the figure below.In the figure below, we can see that each time the rate changes, whether for the general or special regime, the revenues change gradually. Moreover, the positive effect of an increase in the rate only appears after two years and does not persist because of many demographic factors beyond the control of the fund. These factors are ageing of the population and change in life expectancy of pensioners.
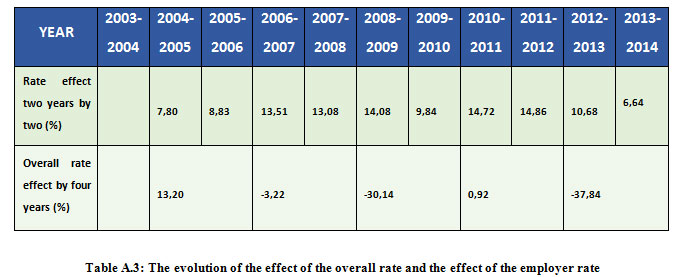
Summary Table A.3 and Chart A.3, below, represents the evolution of the overall effect and the effect of the employer rate:
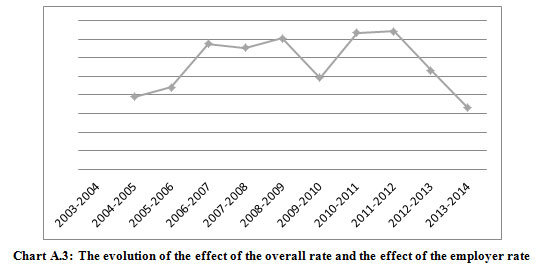 |
Figure 3: The evolution of the effect of the overall rate and the effect of the employer rate |
In Table A.3 and Figure A.3 above, it can be seen that with each change in the rate, whether for the general or special regime, revenues change gradually and the positive effect of an increase in rates only appears after two years and does not persist because of many demographic factors beyond the control of the fund. These factors are aging of the population and changes in pensioners’ life expectancy.
The evolution of the deficit by contribution rates:
At this level, a distinction should be made between two terms commonly understood by economists, namely contributions deduced from the employee’s salary, which is set at 8.20%, and the contribution paid by the employer to CNRPS, which is currently set at 12.5%.So, The income related pension financed by contributions.( here is like The new system for public pensions in Sweden)
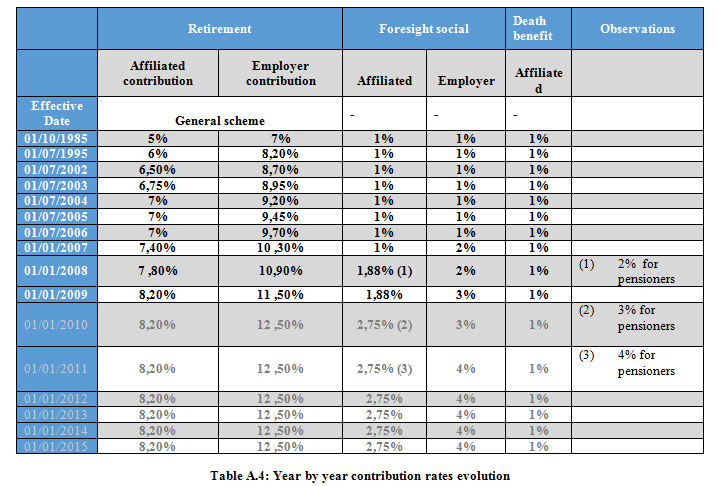
According to the above table, taken from the CNRPS’s control management department, we notice that from July 2011 to 2015, contribution rates for the two agents (employee and employer) are static otherwise they have not moved.
Deficit analysis by expenditure
The evolution of the deficit in terms of pensions

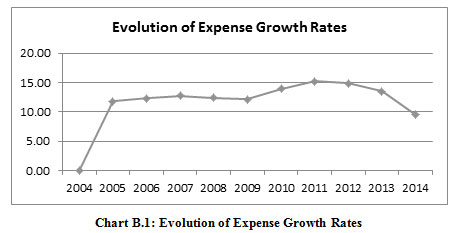 |
Figure 4: Evolution of Expense Growth Rates |
In Table B.1, expenditure amounts have increased annually. It went from 799915 MD in 2004 to 2679490 MD in 2014. Graph B.1 shows that the expense growth rate fluctuates from one year to the next. It is 11.82% in 2005, 15.20% in 2011 and 9.54% in 2014.
The real evolution of the deficit:
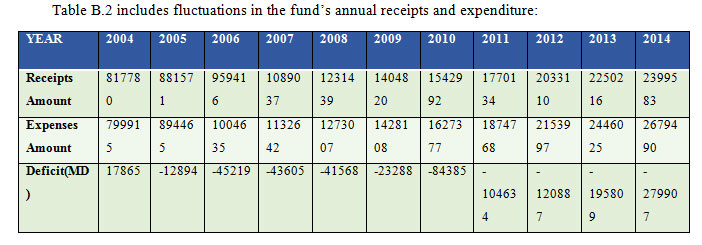
Table B.2 includes fluctuations in the fund’s annual receipts and expenditure:
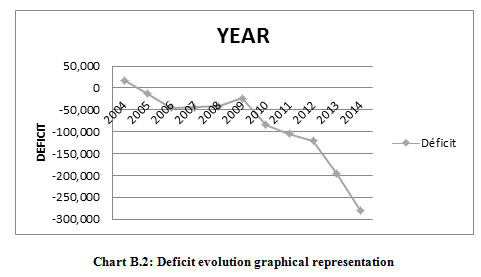 |
Figure 5: Deficit evolution graphical representation |
In Table B.2 and Graph B.2, the deficit has increased annually from 12,894MD in 2005 to 279,907MD in 2014.
The evolution of the deficit by the demographic factor
The demographic component has a very important role in analyzing expenditure effect on the fund’s deficit. In fact, the demographic component represents the mortality table; also known as the life table. This latter is defined as “a construct that makes it possible to follow the fate of a population in detail”. This tool is mainly used in demography and actuarial science to study the number of deaths, probabilities of death or survival and life expectancy by age and gender. There are two types of mortality tables: the current mortality table and the generation mortality table where the question arises: what is the difference between the two tables?
The current mortality table is constructed on a fictitious generation of 100,000 individuals, then on monitoring the evolution of such a population under the effect of a single elimination factor, namely the mortality factor. We can conclude that in the case of CNRPS, since it is still in deficit (the difference between income and expenditure is negative), it manages this deficit to some extent, either through the monthly reserve of 40 to 50 billion Tunisian dinars that it has at its disposal in the event of late payment by public institutions, or through a delay in payment to the CNAM, or through a loan from the Ministry of Finance. Hence, the present question: Is it possible to mend this deficit?
Proposed solutions for the reform of the general pension system
The whole working career is the basis for the pension and the benefit drawn at a given age( Karl Gustaf Scherman : Honorary President of the International Social Security Association; former Director of the National Social Insurance Board in Sweden said it about the Sweden system reform).In order to control the balance of the general pension system in the long term, a number of solutions should be envisioned to adjust any possible imbalances. This can be done by acting on the factors reducing the revenues of this system, such as, for example, the retirement age limit, the contribution rates, as well as acting on the factors increasing expenditure, like revising the pension calculation parameters. In this regard, we will present solutions that consider the revenues and expenditure, with 2009 as the base year for any forecast.
Revenue-based solutions
Solution 1: a 1% increase in the employer and employee contribution rates (i.e. instead of 20.70% we have 21.70%):
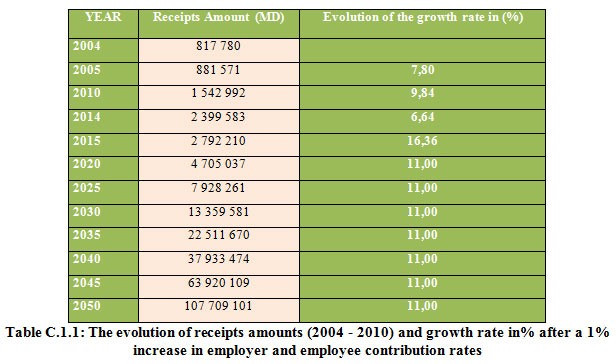
After projections made, we notice that after increasing the contribution rate by 1%, a revenue of 2,792,210 MD will be achieved in 2015 compared to 2,399,583 MD in 2014. Thus, we earned 392,727 MD in one year. Solution 2: a 2% increase in the employer and employee contribution rates, i.e. instead of 20.70%, we have 22.70%:
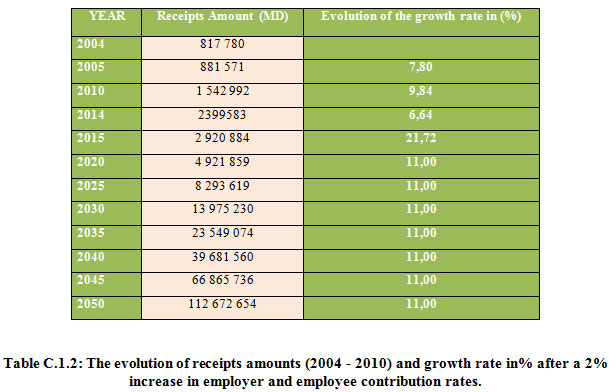
Similarly after the projections made, we notice that after increasing the contribution rate by 2%, we achieve a revenue of 2,920,884 MD in 2015 against 2,399,583 MD in 2014. As a result, we gain 521,301 MD in one year.
Expenditure-based solutions
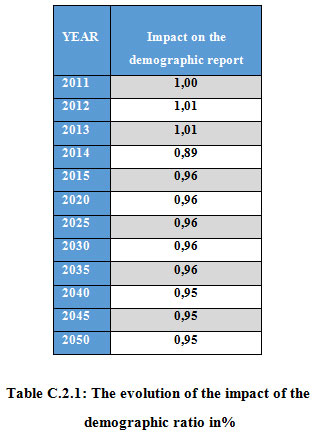
Solution 1: The legal retirement age is set to 62 instead of 60:Similar to our analysis of the revenue-based solutions, extending the retirement age, we notice that until the year 2050, there are 0.96 working people, i.e. only one active person to pay a pension for a single pensioner as projected in Table C.2.1. below:
Looking into the table of changes in expenditure amounts and their average, the annual equalization amounts and their average, the retirement amounts and their average and the effect of equalization amounts and their annual and average growth rates (%), we notice that the growth rate of the retirement amounts effect in (%) has increased annually. It rose from 6.50% in 2009 to 13.15% in 2014.
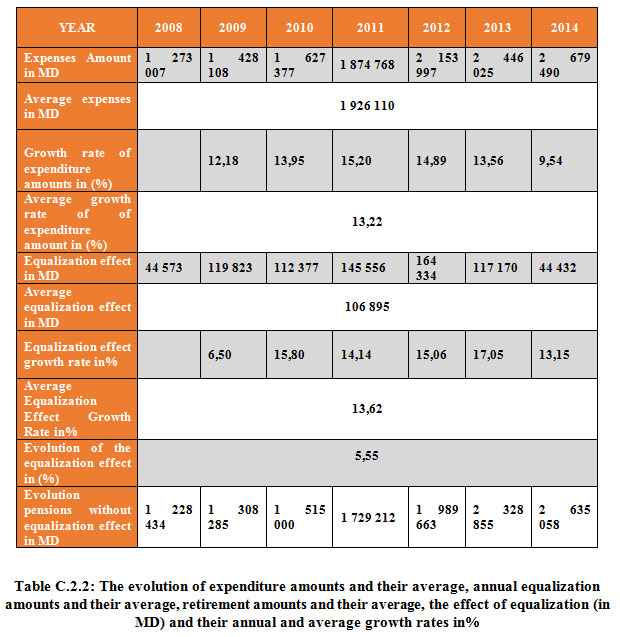
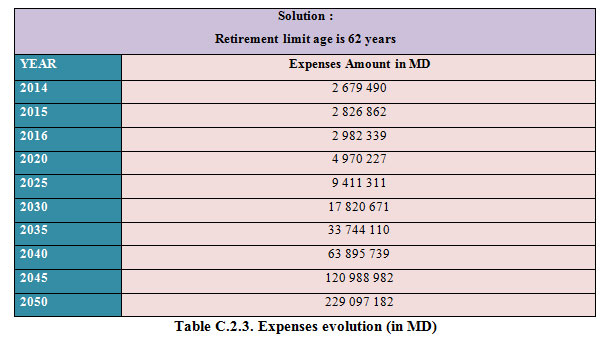
To examine the evolution of expenditure during 2015 and 2016, a rate of 5.55% was set for the evolution of the equalization effect, which is an average rate, and then an average growth rate of the retirement amounts effect was set at 13.62% to make projections until 2050.Accordingly, the table below shows that expenditure (in MD) evolved from 2015 to 2050. We notice that for the two years 2015 and 2016 and by increasing the rate of the equalization effect, expenditure amount increased by 147,372 MD in 2015, by 302,849 MD in the following year compared to 2014 and 155,477 MD in 2015 compared to 2016. Therefore, spending has increased annually. Indeed, expense amounts went from 2 679 490 MD in 2014 to 229 097 182 MD in 2050.
Like in the French pension system and 2003 reform (Francois Jeger and Michele Lelievre) for getting more flexibility they with introduce the deductions and bonuses according to duration of contribution with actuarial neutrality. Anyone older than 60 years can retire, with a deduction of 5% per year for fewer than 40 years of contributions and with a bonus of 3% per year for greater than 40 years of contributions.
Solution 2: Revision of pension calculation
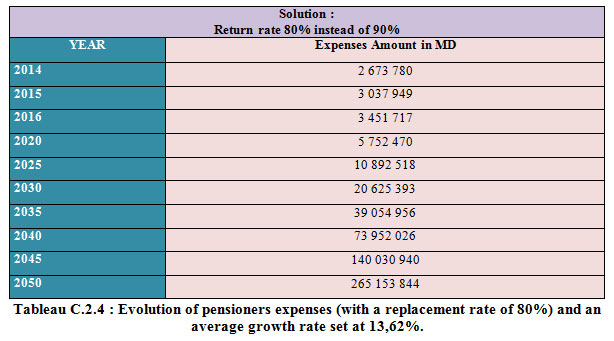
The main aim of revising pension calculation is to re-amend or re-improve it to reduce pension expenditure. Referring to our projections and the table below describing the evolution of expenditure for pensioners (with a replacement rate of 80%) with an average growth rate set at 13.62%, we notice that from 2015 onwards, expenditure amount is increasing.
Combined solutions
Below is a summary table that presents the projections of the combined solutions:
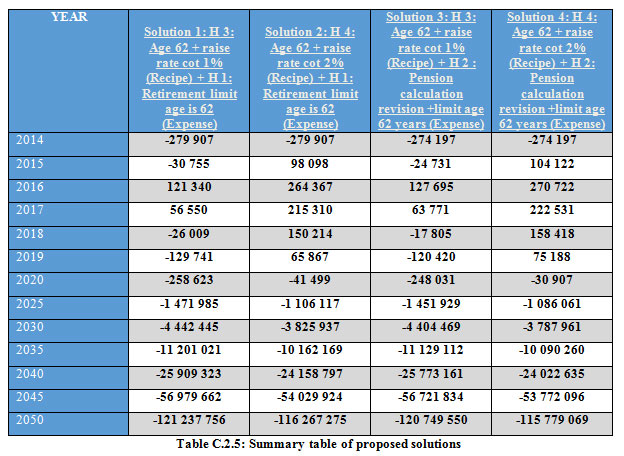
- Solution 1: H 3 : 62 years old + an increase in contribution rate 1% (Receipts) + H 1 : The retirement age limit is 62 years old (Expense)
In our summary table, for the two years (2016 and 2017), CNRPS will achieve a surplus of 177,890 MD, which will allow it to cover two more years for an amount of 155,750 MD.
- Solution 2: H 4 : 62 years old + an increase in contribution rate 2% (Receipts) + H 1 :The retirement age limit is 62 years old (Expense)
In our summary table, for the five years (from 2015 to 2019), CNRPS will achieve a surplus of 793 856 MD, which will allow it to cover another three additional years for an amount of 561 413 MD.
- Solution 3: H 3 : 62 years old + an increase in contribution rate 1% (Receipts) + H 2 : Revision of pension calculation + age limit 62 years old (Expense)
In our summary table, we forecast that for the two years (2016 and 2017), CNRPS will achieve a surplus of 191 466 MD and which will allow it to cover another 2 years for an amount of 138 225 MD.
- Solution 4: H 4 : 62 years old + an increase in contribution rate 2% (Receipts) + H 2 : Revision of pension calculation + age limit 62 years old (Expense)
In our summary table C.2.5, we observe that for the five years (from 2015 to 2019), CNRPS will achieve a surplus of 830,9821MD and which will allow it to cover another 3 years for an amount of 525,113 MD.
Then, it seems that solution four is the best solution because its obtained projected figures are much higher than those of the other proposed solutions (solution four’s figures(830 9821 MD) are greater than those of solution one (= 177 890 MD), those of solution two (793 856 MD) and those of solution three (= 191 466 MD)).
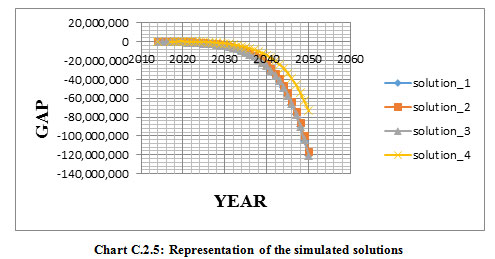 |
Figure 6: Representation of the simulated solutions |
The graph also shows that solution four (yellow line) is the best as a reform solution for the general pension system. It allows CNRPS to cover more years in terms of deficit. We notice that from 2015 to 2019, the curve has shrunk.
CONCLUSION
As a conclusion, in this paper and thorough analysis, we presented the current situation of the CNRPS and simulated some relevant proposals to mend for the deficit of the general pension system, which has been a serious problem for years and years. So the CNRPS should have a first class and robust retirement income system that delivers good benefits, is sustainable and has a high level of integrity. (Denmark country system have a grade A with index value >80).
ACKNOWLEDGEMENT
This work was supported by the Deanship of Scientific Research (DSR), King Abdulaziz University, Jeddah, under grant No. (D-7-156-1440). The authors, therefore, gratefully acknowledge the DSR technical and financial support.
REFERENCES
Alain Leclair nommé, (2005). De La Prestation Definie A Lacotisation Definie : Un Nouveau Defi Pour La Gestion, Revue d’économie financière, 79. pp. 23-33
Bonoli, Giuliano (2003). Providing Coverage against New Social Risks in Mature Welfare States Paper prepared for the Conference on the Political Regulation of New Social Risks, Lugano, September. Pp. 25-27.
Bonoli, Giuliano, (2004). The Politics of New Social Risks and Policies Paper prepared for the presentation at the International Sociological Association, RC 19 meeting in Paris, September 2-4.
Department of Public Expenditure and Reform, (2019). https://www.gov.ie/en/policy-information/a97614-public-service-pensions/?referrer=/en/pensions/
Desmond Brunton and Pietro Masci, (2005). Workable Pension Systems Reforms in the Caribbean
Francois Jeger and Michele Lelievre, (2003). The French pension system and reform. The Japanese Journal of Social Security Policy, Vol.4, No.2.
Hinrichs, Karl, (2004). Active Citizens and Retirement Planning. Enlarging Freedom of Choice in the Course of Pension Reforms in Nordic Countries and Germany Bremen, ZES-Arbeits papier. 11/2004.
Melbourne Mercer, (2012). Pension Reforms in India. Melbourne Mercer Global Pension Index.
OECD (2018), Financial Incentives and Retirement Savings, OECD Publishing, Paris, https://doi.org/10.1787/9789264306929-en.
OECD (2018), Financial Markets, Insurance and Private Pensions: Digitalisation and Finance, https://www.oecd.org/competition/financial-markets-insurance-and-pensions-2018.htm.
OECD (2019), Self-employment rate (indicator), http://dx.doi.org/10.1787/fb58715e-en.
Hawley, Shyam Kamath et Andrew T.williams nommé, (2005). Fonds Souverains Et Fonds De Pension : Conceptualiser Les implications Pour L’investissement responsable. Revue d’économie financière. pp. 395-415.
Palier, Bruno, (2002). Gouverner la sécurité sociale. Paris.
Robert Holzmann, (2012). Global Pension Systems and Their Reform Worldwide Drivers, Trends, and Challenges”. RH Institute for Economic Policy Analysis, University of Malaya, IZA.
Sdiri Khaled nommé, (2014). Analyse Economique &Pilotage Des régimes De Retraite


