1Department of Food Science & Technology, Warner College of Food & Dairy Technology, Sam Higginbottom University of Agriculture, Technology & Sciences, Allahabad, India-211007
2Amity Institute of Food Technology, Amity University, Noida, India-
3Department of Molecular & Cellular Engineering, Amity Institute of Food Technology, Amity University, Noida, India-201303 Jacob Institute of Biotechnology & Bioengineering, Sam Higginbottom University of Agriculture, Technology & Sciences, Allahabad, India-211007
4Department of Soil Science & Plant Nutrition, Selcuk University, Turkey-401602
Corresponding author Email: avinash.singh@shiats.edu.in
Article Publishing History
Received: 10/01/2018
Accepted After Revision: 27/03/2018
In recent past; change in lifestyle has paved the way for many diseases like obesity and diabetes with huge demand for reduced calories low fat sugar free products. Therefore, to meet the demand of the current market a low-fat sugar free ice-cream was prepared. The per kg final formulation provided by response surface methodology (RSM) to prepare desirable low-fat sugar free ice cream is 751ml skim milk, 31gm cream, 65gm SMP, 18.2ml sorbitol, 30gm maltodextrin, 70gm polydextrose, 12.5gm WPC-70, 0.009gm sucralose and 5gm emulsifier. RSM was used to investigate the influence of predictor variables (sorbitol and sucralose) on ice-cream color and appearance, body and texture, flavor and taste and melting resistance. 1-3% level of sorbitol and 0.005-0.015% sucralose was varied. Finally, 2.33% sorbitol and 0.009% sucralose were obtained as optimum levels. Available literature indicated levels of Maltodextrin as fat replacer was found effective at 3% and polydextrose at 7% in providing bulk to the ice-cream without affecting the sensory attributes and Physico-chemical parameters. Low calorie sweeteners sorbitol and sucralose on comparison to sucrose were effective in imparting sweetness without adding calorie to the prepared ice-cream. Prepared ice-cream was effective in mimicking mouth feel of full fat ice-cream. The Optimized ice-cream was analyzed for various parameters including Total solids, fat, protein, moisture, titrable acidity, ash, carbohydrate and overrun as 30.44, 2.40, 4.69, 69.56, 0.135, 1.34, 22.01 and 61.6g/100 g respectively. The total plate count (TPC) of freshly prepared ice cream was 1.5×10³, yeast & mould was absent and coliform count was found nil. The calorific value of ice-cream was reduced from 200 kcal to 116.74 kcal/100 gram
Ice Cream, Low Fat, Rsm, Sorbitol, Sucralose
Khan S, Rustagi S, Choudhary S, Pandey A, Khan M. K, Kumari A, Singh A. Sucralose and Maltodextrin-An Altrernative to Low Fat Sugar Free Ice-Cream. Biosc.Biotech.Res.Comm. 2018;11(1).
Khan S, Rustagi S, Choudhary S, Pandey A, Khan M. K, Kumari A, Singh A. Sucralose and Maltodextrin-An Altrernative to Low Fat Sugar Free Ice-Cream. Biosc.Biotech.Res.Comm. 2018;11(1). Available from: https://bit.ly/2Z5jxFG
Introduction
Ice-cream is a frozen dairy product obtained by appropriate mixing and processing of cream and other milk food along with sugar and flavor, in presence or absence of stabilizer or color and with absorption of air during freezing (De, 2015). Ice-cream is loaded with high fat, protein and carbohydrate which add to its calorific value. On average the calorific value of Ice Cream is 200 kcal/100g (Pinto and Dharaiya, 2014). The fat rich diet has been recognized as alarming reason for high energy intake, positive energy balance and a major cause of obesity. These troubled eating habit coupled with lack of physical activity and stressed life has resulted in various health issues across globe especially among the natives of Asian continent (Thomas et al.,1992; Siggaard et al.,1996; Wylie-Rosett, 2002). In India alone about 48.14 percentage residents consume high fat diet (Chatterjee, 2007). Survey of Indian Council of Medical Research affirmed that in urban locality 49 percentage of female and 36 percentage of male population suffers from obesity. Obesity can be explained as a store of several other health issues like hyperlipidemia, hypercholesomia, diabetes, hypertension, cancer and gallstones. WHO has estimated a world-wide heavy upsurge in the diabetic cases, expected to raise by 57.2 million till 2025 in sharp contrast to the diabetic cases of 19.4 million as in 1995. India has already become the home to diabetes with 69.1 million patients and which is expected to surge by 79.4 million till 2030, (Mohan et al., 2010 and Kaveeshwar et al., 2014 Sonwane and Hembade, 2014 Tripathy et al., 2017).
In recent years, with growing demand of low calorie, low fat products the dairy industry has come up with numerous low-fat and fat-free ice cream products. With increased consumer attentiveness for improved and efficient foods various new technologies has come to the fore for manufacture of such products. Ice cream is one of the most served and loved desserts but is high in fat content (10–14%) and sugar (30%) therefore; formulating its low fat and sugar free version will serve in good cause for reducing the extra-calorie intake and make it healthier. Removal of sugar to prepare sugar free ice cream counts for some defects like adjustment in total solids and loss in freezing point depression. The prior can be compensated by using bulking agent like polydextrose and later by adding freezing point depressant like sorbitol (Tharp, 1991, Pinto and Dharaiya, 2014; Patil and Banerjee, 2017).
Bulking agents impart creaminess, smoothness, improve texture and provide a mouth feel and protection against temperature fluctuation to please customers, (Goff and Jordan, 1985). Sorbitol or mannitol containing Sugar-free products contain low glycemic index (GI). Low GI foods are important in dietary management as they allow slow movement of glucose into the blood resulting in very low rise in blood glucose and insulin levels. The use of artificial sweeteners in food are very useful as it imparts sweetness without adding sugar which result in calorie reduction, helps in weight loss and diet control. Artificial sweeteners are considered safe as some of them are not digested by our body like sucralose. Fat has a major part in the structure of ice cream and its removal from the ice cream lowers the characteristics of the product which requires a substitute to be added. The substitute on addition preserves the characteristics of ice cream known as fat replacer. Fat mimetics are indigestible, low calorie and posses’ dissimilar chemical structure than fat. These are of different types of carbohydrate or protein-based. Physiological characteristics and desirable eating qualities like viscosity, mouth feel and appearance of fat are copied by these fat mimetics.
In the wake of outlined research prospect, the present study was carried out with the comprehensive objective to prepare low fat sugar free ice-cream and to understand the role of various artificial-sweeteners, fat replacers and bulking agenton Physico–chemical, textural and microbiological properties of ice–cream.
The major highlight of the study is that the calorific value of the prepared ice–cream is 116.74 kcal/100 gmuch lower as compared to average calorific value of 197.13 kcal/100 gfor an average ice cream.
Material and Methods
Ice-Cream Formulation: The Central Composite Rotatory Design (CCRD) of Response Surface Methodology (RSM) was used to obtain 13 different combinations of sorbitol and sucralose to prepare the experimental low-fat sugar free ice-cream. Identical composition of Maltodextrin, Polydextrose and WPC were used in all the thirteen different combinations. Fat and total solid were used as per the standards given by Food Safety and Standards Authority of India (FSSAI), 2006 (Table I). Ice-cream with 13 different compositions was processed using the method given by Arbuckle, (2013).
In this table (Table I) CCRD design is presented with 13 different experimental runs of independent variables (Sorbitol) Factor A and (Sucralose) Factor B and its coded level. All the responses are shown with sensory score allocated by the judges.the independent variables and their decoded or actual levels are depicted below as note.
| Note: | |||||||
| S. No. | Variables
Actual Coded |
Levels
-1.41 -1 0 +1 +1.41 |
|||||
| 1. | Sorbitol | A | 0.58 | 1 | 2 | 3 | 3.41 |
| 2. | Sucralose | B | 0.0029 | 0.005 | 0.01 | 0.015 | 0.017 |
| Table I: Experimental Design Matrix and Sensory Score of the Low-Fat Sugar Free Ice-cream | ||||||||||||
| Std | Run | Factor A Sorbitol
(%) |
Factor B Sucralose
(%) |
% Maltodextrin | % Polydextrose | % WPC | % Fat | % Total Solids | Color and Appearance | Body and Texture | Flavor and Taste | Melting Resistance |
| 10 | 1 | 0 | 0 | 3 | 7 | 1.25 | 2.5 | 28.14 | 8.5 | 7.5 | 7.5 | 7.89 |
| 6 | 2 | 1.41421356 | 0 | 3 | 7 | 1.25 | 2.5 | 28.14 | 7.44 | 7.5 | 7.5 | 7.25 |
| 1 | 3 | -1 | -1 | 3 | 7 | 1.25 | 2.5 | 28.14 | 7.38 | 6.5 | 7 | 7.5 |
| 2 | 4 | 1 | -1 | 3 | 7 | 1.25 | 2.5 | 28.14 | 7.5 | 7.03 | 6.37 | 6.75 |
| 7 | 5 | 0 | -1.414213562 | 3 | 7 | 1.25 | 2.5 | 28.14 | 6.5 | 7.33 | 6.81 | 7.01 |
| 13 | 6 | 0 | 0 | 3 | 7 | 1.25 | 2.5 | 28.14 | 8.01 | 8.25 | 8.25 | 7.5 |
| 12 | 7 | 0 | 0 | 3 | 7 | 1.25 | 2.5 | 28.14 | 8.05 | 8.7 | 8.15 | 8 |
| 9 | 8 | 0 | 0 | 3 | 7 | 1.25 | 2.5 | 28.14 | 7.95 | 8.5 | 7.98 | 7.69 |
| 3 | 9 | -1 | 1 | 3 | 7 | 1.25 | 2.5 | 28.14 | 7.5 | 6.5 | 7.25 | 7.25 |
| 4 | 10 | 1 | 1 | 3 | 7 | 1.25 | 2.5 | 28.14 | 7.38 | 7.16 | 7.34 | 7.14 |
| 8 | 11 | 0 | 1.414213562 | 3 | 7 | 1.25 | 2.5 | 28.14 | 7.25 | 6.88 | 7.01 | 7.01 |
| 11 | 12 | 0 | 0 | 3 | 7 | 1.25 | 2.5 | 28.14 | 8.25 | 8.5 | 8.5 | 8 |
| 5 | 13 | -1.41421356 | 0 | 3 | 7 | 1.25 | 2.5 | 28.14 | 7 | 7.16 | 7.31 | 6.98 |
The sensory analysis was done by the panellist on sensory score card.Numerical scores were allocated for color and appearance, body and texture, flavor and taste and melting resistance of the ice cream based on the nine – point’s hedonic scale. The numerical score was used as an indication of the quality. These scores were further used in the RSM to obtain the optimum levels of sorbitol and sucralose. For obtaining the optimum levels of artificial sweeteners to be used maximum desirability value solution was preferred. Response surface plots were used to explain the effects of independent factors on the response variables. The study was replicated three times to minimize the chance of errors and results were statistically analyzed. All the responses were numerically optimized by maximizing within the critical limits using Design Expert Software. The independent factors were set within the experimental range.
The detailed processing of final ice-cream is mentioned in Fig I.
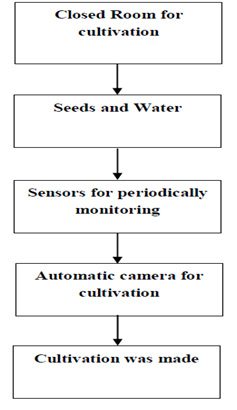 |
Figure 1: Flowchart for preparation of low-fat sugar-free ice-cream |
Physico Chemical Analysis: The prepared ice-cream was subjected to Physico-chemical analysis. Fat content; total solids, total ash, moisture content and titrable acidity of the ice-cream were calculated using FSSAI Laboratory Manual 1. Protein content of the frozen mixture was determinedbyKjeldahl method.Total Carbohydrate was calculated from the difference of proximate composition. Overrun was calculated as per the method of Sommer (1951).For Microbiological analysis, Total Plate Count was performed as per IS 5402:2012, Yeast and Mold was performed as per IS 5403:1999 (RA2013) and Coliforms Test was done using IS 5401(P1):2012. Calorific value of ice cream was calculated using formula given below
Calorific Value = % Carbohydrate × 4 + % Fat × 9 + % Protein × 4
Results and Discussion
The sensory data of the experimental Ice cream along with the CCRD matrix is summarized in Table I. The obtained sensory data was subjected to evaluation by quadratic model and the statistical significance of the terms in the regression equation was examined by analysis of variance (ANOVA) as presented in Table II.
The color & appearance score of the experimental ice cream ranged from 6.5 to 8.5 (Table I). The minimum score was obtained for 2% sorbitol and 0.002929% sucralose treatment combination and the maximum score was obtained for 2% sorbitol and 0.01% sucralose treatment combination. Lack of fit was not significant, (Fcal>Ftab) confirming the significance of model at 5 per cent level of significance. The model terms for sorbitol and sucralose was highly significant in color and appearance score at linear as well as quadratic level. The coefficient estimates of color and appearance score model shows that levels of different variable had significant effect on the score. The linear and quadratic effect of Sorbitol and Sucralose is expressed in graph obtained in Fig II (a). The response surface equation derived for predicting color and appearance score could be given as:
+8.15+0.078*A+0.13*B-0.060*AB-0.37* A2-0.54* B2
 |
Figure 2a: Response surface 3D plot showing effect of sorbitol and sucralose on color and appearance |
The score for Body Texture of the experimental ice cream ranged from 6.5 to 8.5 (Table I). The minimum score was acquired for 1% sorbitol and 0.05% and 0.015% sucralose treatment combination and the maximum score was acquired for 2% sorbitol and 0.01% sucralose treatment combination. The regression coefficient data presented in Table II revealed that the coefficient of determination was 0.8004. Further, it can be figured that the significance of model at 5 per cent level of significance as Lack of fit was not significant, (Fcal>Ftab). The model terms for sorbitol and sucralose was highly significant in body and texture score at linear as well as quadratic level in Fig II (b). The response surface equation estimating Body and Texture score could be given as:
+8.29+0.21*A-0.063*B+0.033*AB-0.59* A2-0.70* B
 |
Figure 2b: Response surface 3D plots showing effect of Sorbitol and Sucralose on body and texture |
The Flavor & Taste score of the experimental ice cream ranged from 6.75 to 8 (Table I). The minimum score received was for 3% sorbitol and 0.005% sucralose treatment combination and the maximum score received was for 2 % sorbitol and 0.01 % sucralose treatment combination. The coefficient of determination was 0.8237 as shown in regression coefficient data presented in Table II. Rathod et al. (2013) has also reported almost similar result (i.e. 0.89) while optimizing levels of artificial sweetener for preparation of sugar free ice–cream.The Lack of fit was not significant, (Fcal>Ftab) confirming the significance of model at 5 per cent level of significance. The model terms for sorbitol and sucralose were highly significant in flavor score at linear level in Fig II (c). The response surface equation for Flavor and Taste score could be given as:
+8.08-0.034* A+0.19*B+0.18* AB-0.38* A2-0.62* B2
 |
Figure 2c: Response surface 3D plots showing effect of Sorbitol and Sucralose on flavour and taste |
The melting resistance score of the experimental ice cream ranged from 6.37 to 8.5 (Table I). The minimum score was for 3% sorbitol and 0.005% sucralose treatment combination and the maximum score was for 2% sorbitol and 0.01% sucralose treatment combination. The coefficient of determination was 0.8058 as depicted in regression coefficient data presented in Table II. The model terms were significant at 5 per cent level of significance as the Lack of fit was not significant, (Fcal>Ftab). The model terms for sorbitol and sucralose was highly significant in melting resistance score at linear and quadratic level in Fig II (d). The Melting Resistance score can be calculated by the response surface equation mentioned below:
+7.82-0.060*A+0.018*B+0.16*AB-0.33* A2-0.38* B2
 |
Figure 2d: Response surface 3D plots showing effect of Sorbitol and Sucralose on melting resistance |
Physico-chemical Analysis
Ice cream was prepared with the finally optimized formulations and was subjected for analysis of parameters like fat content, total solid, protein, total ash, moisture, titrable acidity, overrun and carbohydrate. The total fat content was found to be 2.4 g / 100g. As per the FSSAI standards, the total fat content in low fat ice cream should not be more than 2.5 percent. The total solid content (TSC) in the final formulated ice-cream was reported to 30.44 g / 100g which is as per the standards of FSSAI. However, reduction in TSC can be attributed to the fact that sucrose is replaced by high intensity artificial sweeteners required in very small amount as against sucrose which is used in concentration of 15 % in normal ice cream. The minor diminution in the total solid content can be attributed to the moisture content of dry ingredients i.e. polydextrose and maltodextrin as reported by (Pinto and Dharaiya, 2014).
The Protein content was found to be 4.69 g /100g. The protein content as per FSSAI Standards should not be less than 3 percentages. The final formulated ice cream was enriched with 1.25 % WPC–70. Whey Protein Concentrate (WPC) is rich in essential amino acids such as lysine, tryptophan, cysteine and methionine. Whey solids possess nutritionally and functionally biologically active superior proteins (Steinholthand Holth, 1999)and their incorporation in the ice cream mix would result in superior product in terms of increasing the protein content of the ice cream (Vulnik, 1995). The total ash and total moisture in the ice cream was recorded to be 1.34 g/100g and 69.56 g / 100g respectively. The increase in the ash content is due to addition of fat replacer (Murtaza et al., 2004).
According to FSSAI standards Titrable acidity of ice cream should not be greater than 2.2g/100 g and the titrable acidity in the ice cream was found to be 0.135 g / 100g. The decreased level of fat per cent in ice cream affects titrable acidity content of ice cream.
As level of fat content decreases Titrable acidity also decreases (Chavan et al.,2014).The Over–run in the ice cream was estimated to be 61.6%. In a similar study by Pon et al. (2015)on textural and rheological properties of sugar free ice cream they calculated an average overrun as 65.12%. This estimated value was in concordance with the present study. However; it is also cited that high overrun is difficult in batch–type freezer (Dervisoglu et al. 2005; Guven et al. 2003).The literature also establishes that increased sugar concentration has important role in high overrun (Akin et al. 2007; Guven and Karaca 2002). Schmidt et al.(1993)in his study also indicated that carbohydrate-based fat replacers like polydextrose and maltodextrin, used in the formulated ice cream under study has led to decrease overrun and; thisstudy was further supported by Jamshidi et al. (2012).The Carbohydrate in the ice cream was found to be 22.01 g / 100g.Hence, it can be stated that the physicochemical analysis of formulated “Low Fat Sugar Free Ice Cream” satisfies the standards and claims for low fat sugar free ice–cream.
The final product obtained was subjected to microbiological analysis for parameters like Total Plate Count, Yeast and Mould and Coliform. The Total Plate Count in the optimized low–fat sugar free ice cream was calculated to be 1.5*103 cfu / gm. The permissible standard for TPC as laid down in FSSAI for ice cream is 2*105 cfu/ gm. The Yeast and Mould in the optimized low–fat sugar free ice cream was absent. Yeast and Mould in ice cream should be absent as per the standards laid down by FSSAI. The Coliform count in the optimized low–fat sugar free ice cream was found to be NIL. The permissible standards for Coliforms as laid down in FSSAI for ice cream is 50cfu / gm.
In the present study, 13 treatments of low fat sugar ice-cream were prepared with fat being replaced by maltodextrin at 3%.Removal of fat causes such body and textural problems as coarseness and iciness, crumbly body, shrinkage and flavor defects (Berger 1990; Marshal and Arbuckel 1996). Samples with reduced fat and sugar showed a higher intensity of bitter aftertaste, adhesiveness, and firmness, and lower intensity of creaminess (Cadena et al. 2012). In a similar study, Verma (2002) observed an increasing trend in the sensory score with increase in maltodextrin level with respect to flavor, body and texture, melting quality and overall acceptability. Fat replacers and substitutes are extensively used in the preparation of fat-reduced foods (Rolon et al. 2017). Carbohydrate based or protein-based fat replacers could adequately mimic milk fat in terms of texture and flavor retention in ice creams (Roland et al. 1999; Prindivilleet al. 2000and Elango et al. 2017).
Hence, Maltodextrin effectively worked as fat replacer in low fat sugar free ice cream.
RSM was used for optimization of final formulation of low fat sugar free ice cream. The graphical representation [Fig II (b)]exhibited that high level of sucralose had negative effect on body and texture. Color and appearance and melting resistance graph [Fig II (a), (d)] shows quadratic increase followed by a decrease at certain level. With increasing level of sorbitol and sucralose flavor and taste will enhance [Fig II (c)]. After the optimization, low fat sugar free ice cream was formulated; sugar was substituted by artificial sweetener sucralose at 0.009% and sorbitol 2.33%. The experimental ice cream on consumption was not differentiated by any panelist as sugar free ice cream containing artificial sweetener. The after taste of the artificial sweeteners was effectively masked by flavor. Hence, sucralose and sorbitol were effective in replacing sucrose, as low–calorie sweeteners.
Ice cream, being a rich source of fat, protein and carbohydrate, contributes significantly towards calorific value. The average calorific value of ice cream is approximately 200 kcal/100g. The energy value was calculated by taking the energy value of fat, protein and carbohydrates as 2.4, 4.69 and 22.01 kcal/g respectively. The calorific value of prepared low–fat sugar free ice cream is 116.74 kcal/g much lower than the average calorific value of ice–cream.
Conclusion
The outcome of the present study establishesthat the combination of sorbitol and sucralose given by RSM are effective in preparing low fat sugar free ice cream. Maltodextrin at 3% level is effective as fat replacer, polydextrose at 7% level is effective in providing bulk to the ice cream and combination of sorbitol and sucralose provide sweetness without affecting the sensory attributes and Physico–chemical parameters apart from low total solids and low titrable acidity. Maltodextrin is effective as a fat replacer in mimicking the mouth feel of full fat ice cream. Sorbitol and sucralose effectively works as low-calorie sweeteners. Sucralose is effective sweetener as a substitute of sucrose. The calorific value of low fat sugar free ice cream was efficiently reduced to 116.74 kcal/100g due to addition of low calorie sugar substitutes and fat replacers.
Acknowledgements
Ms. Sheeba Khan acknowledges the financial assistance of UGC Post-Graduate Merit Scholarship for University Rank Holders for PG Programs in academic session 2014-16. The authors duly acknowledge Student training dairy, SHUATS, Sukhjit Agro Industries, Dupont-Danisco, Gulshan Polyols and J. K. Sucralose for providing ingredients in the preparation of low-fat sugar free ice-cream.
Conflict of Interest
The authors do not have any conflict of interest.
References
- Akın, M.B., Akın, M.S. and Kırmacı, Z. (2007). Effects of inulin and sugar levels on the viability of yogurt and probiotic bacteria and the physical and sensory characteristics in probiotic ice-cream. Food chemistry. 104(1):93-99.
- Arbuckle, W.S. (2013). Ice cream. Springer Science & Business Media.
- Berger, K.G. (1990). Ice cream. Food emulsions. 367-444.
- Cadena, R.S., Cruz, A.G., Faria, J.A.F. and Bolini, H.M.A. (2012). Reduced fat and sugar vanilla ice creams: Sensory profiling and external preference mapping. Journal of dairy science. 95(9):4842-4850.
- Chatterjee, S. (2007). Young India is unfit In Life. Times of India, March, 18:1-4.
- Chavan, A.S., Shelke, R.R., Kahate, P.A. and Munnarwar S.R. (2014). Effect of Sugar Free-Low Fat Levels on Chemical Composition, Melting Period and Cost of Production of Softy Ice-Cream. Research Journal of Animal Husbandry and Dairy Science. 5(2):105-108.
- De, S. (2015). Outlines of Dairy Technology, Oxford University, Delhi.
- Dervisoglu, M., Yazici, F. and Aydemir, O. (2005). The effect of soy protein concentrate addition on the physical, chemical, and sensory properties of strawberry flavored ice cream. European Food Research and Technology. 221(3-4):466-470.
- Elango, A., Gayathri, S., Kumaresan, G., Karthikeyan, N., Doraisamy, K. A. and Pugazhenthi T. R. (2017). Effect of tapioca starch and maltodextrin on the physicochemical properties of low fat probiotic ice cream. International Journal of Chemical Studies. 5(5): 1038-1041
- Goff, D. and Jordan, W. K. (1985). Low-Cal Formula Tests Out Well. Dairy Field. 168:98-100.
- Güven, M. and Karaca, O.B. (2002). The effects of varying sugar content and fruit concentration on the physical properties of vanilla and fruit ice‐cream‐type frozen yogurts. International Journal of Dairy Technology. 55(1):27-31.
- Guven, M., Karaca, O.B. and Kacar, A. (2003). The effects of the combined use of stabilizers containing locust bean gum and of the storage time on Kahramanmara‐type ice creams. International Journal of Dairy Technology. 56(4):223-228.
- Jamshidi, M., Hamdami, N., Dohkani, S. and Keramat, J. (2012). Single-and Multi-Objective Optimization of Low Fat Ice-Cream Formulation, Based on Genetic Algorithms. Journal of Agricultural Science and Technology. 14(6):1285-1296.
- Kaveeshwar, S.A. and Cornwall, J. (2014). The current state of diabetes mellitus in India. The Australasian medical journal. 7(1):45.
- Marshall, R.T. and Arbuckle, W.S. (1996). Ice Cream. Chapman and Hall, International, Thompson Publication, New York. 263–268.
- Ministry of Health and Family Welfare (2012). Manual Methods of Analysis of Foods- Milk and Milk Product, New Delhi: FSSAI, Lab Manual 1.
- Mohan, V., Radhika, G., Vijayalakshmi, P. and Sudha, V. (2010). Can the diabetes/cardiovascular disease epidemic in India be explained, at least in part, by excess refine grain (rice) intake? The India journal of medical research. 131:369-72.
- Murtaza, M.A., Huma, N., Mueen-Ud-Din, G., Shabbir, M.A. and Mahmood, S. (2004). Effect of fat replacement by fig addition on ice cream quality. International Journal of Agriculture and Biology, 6:68-70.
- Patil, A.G. and Banerjee, S. (2017). Variants of Ice Creams and Their Health Effects. MOJ Food processing and Technology 4(2):00088.
- Pinto, S. and Dharaiya, C.N. (2014). Development of a low-fat sugar free frozen Dessert. International Journal of Agriculture Sciences. 4:90-101.
- Pon, S.Y., Lee, W.J. and Chong, G.H. (2015). Textural and rheological properties of stevia ice cream. International Food Research Journal. 22(4).
- Prindivillet, E.A., Marshall, R.T. and Heymann, H. (2000). Effect of milk fat, cocoa butter, and whey protein fat replacers on the sensory properties of lowfat and nonfat chocolate ice cream1. Journal of dairy science. 83(10):.2216-2223.
- Rathod, S., Phiri, P., Harris, S., Underwood, C., Thagadur, M., Padmanabi, U. and Kingdon, D. (2013). Cognitive behaviour therapy for psychosis can be adapted for minority ethnic groups: a randomized controlled trial. Schizophrenia Research, 143(2):319-326.
- Roland, A.M., Phillips, L.G. and Boor, K.J. (1999). Effects of fat content on the sensory properties, melting, color, and hardness of ice cream1. Journal of Dairy Science. 82(1):32-38.
- Rolon, M.L., Bakke, A.J., Coupland, J.N., Hayes, J.E. and Roberts, R.F. (2017). Effect of fat content on the physical properties and consumer acceptability of vanilla ice cream. Journal of dairy science. 100(7):5217-5227.
- Schmidt, K., Lundy, A., Reynolds, J. and Yee, L.N. (1993). Carbohydrate or protein-based fat mimicker effects on ice milk properties. Journal of food science. 58(4):761-763.
- Siggaard, R., Raben, A. and Astrup, A. (1996). Weight Loss During 12 Weeks’ Ad Libitum Carbohydrate‐Rich Diet in Overweight and Normal‐Weight Subjects at a Danish Work Site. Obesity. 4(4):347-356
- Sommer, H.H. (1951). The theory and practice of ice cream making. Published by The Author Madison. Wisconsin.
- Sonwane, R.S. and Hembade, A.S. (2014). Sensorial quality of dietetic soft serve ice cream prepared by using different proportions of maltodextrin. International Journal of Current Research and Academic Review. 2:51-55.
- Steinholth, K. and Holth, J.H. (1999). Deconcentrated Whey Syrup in Ice Cream. Meiriposten, 80:555-557.
- Tharp, B. (1991). Dairy Products Sweetened with Aspartame. In: Ice Cream Short Course, Pennsylvania State University, Pennsylvania. 233-237.
- Thomas, C.D., Peters, J.C., Reed, G.W., Abumrad, N.N., Sun, M.I.N.G. and Hill, J.O. (1992). Nutrient balance and energy expenditure during ad libitum feeding of high-fat and high-carbohydrate diets in humans. The American journal of clinical nutrition, 55(5):934-942.
- Tripathy, J.P., Thakur, J.S., Jeet, G., Chawla, S., Jain, S., Pal, A., Prasad, R. and Saran, R. (2017). Prevalence and risk factors of diabetes in a large community-based study in North India: results from a STEPS survey in Punjab, India. Diabetology & metabolic syndrome. 9(1):8.
- Verma, R.B. (2002). Technological studies on the manufacture of frozen desserts using artificial sweeteners (Doctoral dissertation, National Dairy Research Institute; Karnal).
- Vulink, N. (1995). The use of whey powders in ice cream manufacture. Confectionery Production (United Kingdom).
- Wylie-Rosett, J. (2002). Fat substitutes and health: an advisory from the Nutrition Committee of the American Heart Association. Circulation. 105(23):2800-2804.

