Information Systems Department, King Abdul Aziz University, Jeddah, Saudi Arabia
Corresponding author Email: maaabdullah@kau.edu.sa
Article Publishing History
Received: 10/11/2018
Accepted After Revision: 31/12/2018
Selecting important features in an e-learning environment is crucial for predicting student academic performance. E-learning offers personalized and uninterrupted connections and communication between students and other learning contexts. The increasing proliferation of smart technologies has enabled students to acquire and connect to learning materials and instruction anytime, anywhere. Obviously, the student’s interaction behaviors in e-learning environment have been widely considered. In fact, the interaction in the e-learning system and its impact on students’ performance is subject to discussion and interest. This study, for the most part, focusses on two targets: the first is to find critical factors that affect student’s outcomes in the e-learning system for illustration and the second is more tied, building a well-performed prediction model. The main contribution is twofold: to highlight some experimental visions in the influence of a set of variables using features selection techniques and to propose a prediction model involving the most relevant features applying K-fold Cross Validation method. Different variables effect on model performance and correlations between the input and the target output are discussed in detail using student data provided by the Learning Management System. The recommended method is, then, compared with another popular machine learning methods. The results exposed that, the student with greater engagement in the e-learning system leads to significantly higher performance; however, students who get low in the course tend to interact less frequently. Furthermore, study results indicate that some prediction techniques such as the Random Forest method have considerable advantages in student performance prediction reached up to 80% of accuracy. Other students’ features that may be effective in the e-learning system are also discussed.
Data Analysis, Data Features Engineering, Educational Data Mining, E-Learning, Random Forest, Students’ Performance Prediction, Students’ Behaviors
Alzahrani N. A, Abdullah M. A. Student Engagement Effectiveness in E-Learning System. Biosc.Biotech.Res.Comm. VOL 12 NO1 (Spl Issue February) 2019.
Alzahrani N. A, Abdullah M. A. Student Engagement Effectiveness in E-Learning System. Biosc.Biotech.Res.Comm. VOL 12 NO1 (Spl Issue February) 2019. Available from: https://bit.ly/2YKgVcU
Introduction
With the tremendous developments taking place in today’s world, many of the concepts governing human beings have changed. The concept of learning has been greatly influenced by technology development. The incident in information and communication technology; where emerged a large group e-learning term. The e-learning system allows learners to take the lead in finding their own learning requirements, determining learning goals and resources, selecting and applying learning approaches, and assessing learning consequences, [1]. Learners can control their learning process based on their interaction with the system. In order to get most benefits from the system, educators have to know to which level does the students’ interaction behavior affect their performance and if there are other factors might play an important role in their learning progress. This research highlights the most important features of affecting students’ outcomes and explain in detail each feature by applying two types of selected features techniques. Moreover, this study builds Student Performance Prediction Model (SPPM) using K-Fold Cross-validation method in three classifiers: Decision Tree, Random Forest, and Gradient Boosting Machine. The value of using “K-Fold Cross-validation method is that all the examples in the dataset are eventually used for both training and testing and it results in a less biased or less optimistic estimate of the model skill than other methods, such as a simple train/test split” [2].
The main goal of this approach is to classify students based on their interaction with the E-learning system which is approximated on the basis of Learning Management System LMS of student’s activity. By modelling other variables, a deeper understanding of the domain can be gained and useful relationships can be discovered. Also, it is possible to use the proposed model to “fill in” unidentified but essential information. Afterward, SPPM can be used as an indicator for features affected student’s performance. Class level of each student is predicted from two datasets provided in LMS: one with only student interaction behavioral features and the other one with all selected variables. Our experiment was run on data collected from different courses and for a student with different backgrounds, with a sample of 480 different records. The goal in this paper is to apply selected features techniques before building the model to present the effectiveness of a set of student features in E-learning system, then building the proposed prediction model. The rest of the paper is presented as follows: Section 2, particular information about E-learning system and classification methods for prediction are provided. Section 3, reviews the associated works. Section4 describe the materials used in this study. Section 5 details of tools and methodology are present. Section6 results are illustrated and analyzed. Finally, in Section 7 the paper is concluded.
Background
In recent years online learning is considered to be a paradigm of distance learning, which has long been a part of the American education system, and it has become the biggest sector of distance learning [3] [4]. One of the reasons for having a lot of discussion about e-learning is the obvious benefit and its impact on our educational system in general. Furthermore, e-learning has become effective in educating students, useful in professional development, cost-effective to combat high education costs, and possible of providing a world-class education to anyone anywhere with a broadband connection [3] [5] [6] [7].
In E-Learning system, classification has been widely used in order to find a trend in which factor might affect the learning progress. It is considered to be one of the common processes for machine learning which are used in building effective models that categorized the dataset cases according to a class (label). The classification has sub-process including dividing data into 70% or 80% as a training dataset to build the model, then 30% or 20% are remained to be tested by the generated model [8]. For Educational Data Mining, Classification is used for predicting students’ outcomes. Some classification methods are described in the following:
- Repeated k-fold Cross Validation technique -in some situation called Resampling Method (RM)-is used to compare between two or more different bioanalytical methods [2], more importantly, it optimizes the performance of the model as it divides the data set into a number of the fold (k). For example, if we use 5 fold cross validation so it splits the data into five partitions uses four of them to train the model and the last one is a test partition. Then, this process is repeated many times for each chosen classifier method to get more stable results.
- Decision Tree model has a structure similar to a natural tree in terms of branches, leaves, and roots but it is an inverted tree with the root at the top. Student’s performance is classified then represented by leaves whereas branches characterize unions of selected features that lead to classifications. Thus, a series of nodes and branches are ended by a leaf. The predicted class level is defined by tracing the path of nodes and branches to the ending leaf [8].
- Random Forest model is developed by aggregating trees and can be used for classification if the type of the predicted variable is categorical otherwise it can be used for regression. One of the most significant advantages of RF is that it can deal with a large number of attributes and avoiding overfitting. It also helps with features selected based on importance as the predictor variables randomly sampled as candidates at each split and the number of variables tried at each split (mtry) is a square root of the total number of features in the model as each node split using the best among a subset of predictors randomly chosen at that node [9]. Then it chooses best split at each node of variables tried at each split.
- Gradient Boosting Machine(GBM) is also combined a number of trees as Random Forest does but the difference between them according to [10], “is that it incrementally improves the model by weight those cases that badly predicted before and give them a higher weight so to construct the new base-learners to be maximally correlated with the negative gradient of the loss function, associated with the whole ensemble in simple implementation way, which allows one to experiment with different model designs”.
Literature Review
A number of studies have been investigated in performance prediction in E-learning System or at a university level. The recent research in [11] a students’ behavior is connected with 151 models and 111.256 students and the results prove the importance of learning environment design in predicting and understanding student behaviour and performance in online and blended environments, so it links the learner academic enhancement with a well-designed learning environment. The primary indicator of this study is that the academic retention affected by the learner activity on Virtual Learning Environment. An Important study in [12] determine which factors predicted learner satisfaction and academic outcomes, the findings, indicate that the prediction of student satisfaction and their academic outcome affected by learners’ behavior, which is measured by their social presence. Researchers in study [13] found that “students using PeerWise—an online pedagogical tool that recently created which enables students to be more active such as writing, sharing, answering, discussing and rating multiple choice questions with little to no input from the instructor—had better learning outcomes and improved perceptions of learning as well as motivation to learn”.
In research [14], a set of ML classifiers are implemented for two reasons: to predict the students’ outcome in e-learning courses and to determine the impact of the several features involved in the generated model. Estimating students’ behavior and performance when using an LMS, Content Management System (CMS) or Virtual Learning Environment (VLE) imply the potential need for improving the virtual courses in the e-learning environment. Course information such as “log-files” stored in the system databases and could be mined by educators using data mining classification methods (e.g. Decision Trees, Regression, Neural Networks, Naïve Base, etc.) to extract the most significant relationships and patterns, with the main scope of determining the association between students’ knowledge levels, e-learning portal usage times and students’ grades [15]. The author in the study [16] used Bagging, Boosting and Random Forest (RF), to predict students’ academic performance. In addition, the results shown in their study indicates that there is a strong relationship between student’s behaviors and their academic achievement. Moreover, a logging data which taken from the e-learning platform to predict students’ final grades using a combination of classification algorithms based on features selection, is presented in [17].
The study in [18] “determines the association between student’s demographic features, qualification on entry, aptitude test scores, performance in first-year courses and their overall performance in the program. This study identifies an optimal set of admission indicators, which have the potential of predicting student’s performance”. To sum-up, many scholars have been investigated to find the pattern that enhances students’ outcomes in their learning progress in e-courses. However, there is very little researches that highlight the effectiveness of student behavior and parent engagement features during the learning process and its impact on student academic success. This study will concentrate on the effect of student engagement and the role of their parent involvement in the e-learning system.
Materials Overview
The Dataset used in this study, is collected from learning management system (LMS) called “Kalboard 360” as a case study (see http://www.ibrahimaljarah.com [1]) that is multi-agent and use a state-of-art technology to facilitate learning. The dataset contains 480 observations (student records) with 17 variables. These variables are categorized into four major groups: (1) Demographic variables such as place of birth, nationality and gender. (2) Academic background variables such as educational stage, grade level and section. (3) Interaction behavioral variables such as raised hand, visited resources, making a discussion on specific topic and announcement view. (4) Parent involvement variables such as answering survey, school satisfaction and parent who responsible for the student [1]. The target label that we want to predict is Class which denote to the student’s performance level and it is categorized into three classes ‘H’ indicates high performance, ‘M’ indicates medium performance and ‘L’ indicates low performance. More detailed is shown in table 1.
| Table 1: LMS Dataset Description | ||
| No | Attribute | Description |
| 1 | Gender | Student’s gender (nominal: ‘Male’ or ‘Female’) |
| 2 | Nationality | Student’s nationality (nominal:” Kuwait’,’ Lebanon’,’ Egypt’,’ Saudi Arabia’,’ USA’,’ Jordan’,’ Venezuela’,’ Iran’,’ Tunis’,’ Morocco’,’ Syria’,’ Palestine’,’ Iraq’,’ Lybia”) |
| 3 | Place of birth | Student’s place of birth (nominal:” Kuwait’,’ Lebanon’,’ Egypt’,’ Saudi Arabia’,’ USA’,’ Jordan’,’ Venezuela’,’ Iran’,’ Tunis’,’ Morocco’,’ Syria’,’ Palestine’,’ Iraq’,’ Lybia”) |
| 4 | Educational Stages | Student’s educational background (nominal: “Lower level’, ’Middle School’, ’High School”) |
| 5 | Grade Levels | Student’s grade (nominal: “G-01’, ‘G-02’, ‘G-03’, ‘G-04’, ‘G-05’, ‘G-06’, ‘G-07’, ‘G-08’, ‘G-09’, ‘G-10’, ‘G-11’, ‘G-12 “) |
| 6 | Section ID | Student’s classroom (nominal: “A’,’B’,’C”) |
| 7 | Topic | Course topic (nominal:” English’,’ Spanish’, ‘French’,’ Arabic’,’ IT’,’ Math’,’ Chemistry’, ‘Biology’, ‘Science’,’ History’,’ Quran’,’ Geology”) |
| 8 | Semester | School semester (nominal:” First’,’ Second”) |
| 9 | Responsible Parent | Parent who responsible for student (nominal: “Mom’,’Father”) |
| 10 | Raised hand- | Times a student raises his/her hand on classroom (numeric:0-100) |
| 11 | Visited resources | Times a student visits a course content(numeric:0-100) |
| 12 | Viewing announcements | Times a student checks the new announcements(numeric:0-100) |
| 13 | Discussion groups | Times a student participate in discussion (numeric:0-100) |
| 14 | Parent Answering Survey | If parent answer the surveys (nominal: “Yes’, ’No”) |
| 15 | Parent School Satisfaction | Parent’s school satisfaction (nominal: “Good’ ,Bad”) |
| 16 | Student Absence Days | Total absence days (nominal: “above-7, under-7”) |
| 17 | Class | Final grade (nominal : ‘H’ for high, ‘M’ for medium, ‘L’ for low). |
Statistical Summary
In this section, we take a look at each group of features summarizing the most important one for better understanding. Based on the demographic variables: as shown in figure 1, the dataset consists of 36% males and 64% females. The students come from a different background but the majority of them come from Kuwait and Jordan as 36% and 37% sequentially, the remaining 29% of students come from 14 other countries. The data set includes the school attendance feature as the students are classified into two categories based on their absence days: 60% of them are under 7 and 40% of them their absence days above 7 days.
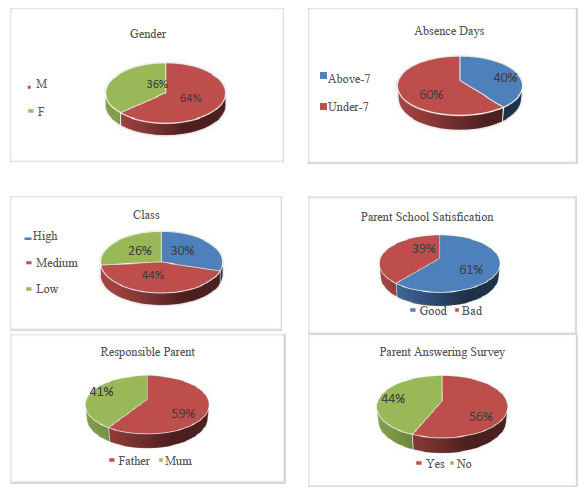 |
Figure 1: Individual Feature Visualization |
Regarding student’s parent related attributes as seen from the figure 1: below 61% of the parent are satisfied with the school and 39% are not. Another parent related feature, there are 44% of them are answered the survey and the remaining are not. The target variable that we want to take into our consecration named ‘Class’ and the students are divided into 3 categories based on their performance as 44% of them are in the medium level, 30% in the high level and 26% of them are in the low level.
Methodology
The primary objective of this research is to determine whether the students’ engagement and parenting behavioral in e-learning systems have a significant impact on their performance or not and to find out if there are any other features played important role in enhancing students’ performance. To achieve that, A Student Performance Prediction Model (SPPM) is proposed using R language [2] and based on enhanced features selection and combined more trees using fivefold cross validation to avoid overfitting and examine three classification methods: Decision Tree (DT), Random Forest (RF) and Gradient Boosting Machine(GBM) for measuring the unknown performance taken from new data sets (test data). In order to improve the quality of features (or students’ attributes) and to optimize the performance of SPPM, the proposed model build through two stages. The first one is selecting the importance students’ attributes by applying three types of correlation measures: Contingency Table Analysis is used to determine the association between the categorical variables and two correlation methods in R language is applied for other numeric variables. These measures are used to improve SPPM classification accuracy and speed up the classification.
The second stage is applying repeated k-fold Cross Validation techniques on the data set as shown in figure 2. The performances of the three different models is generated and compared using six different evaluation metrics.
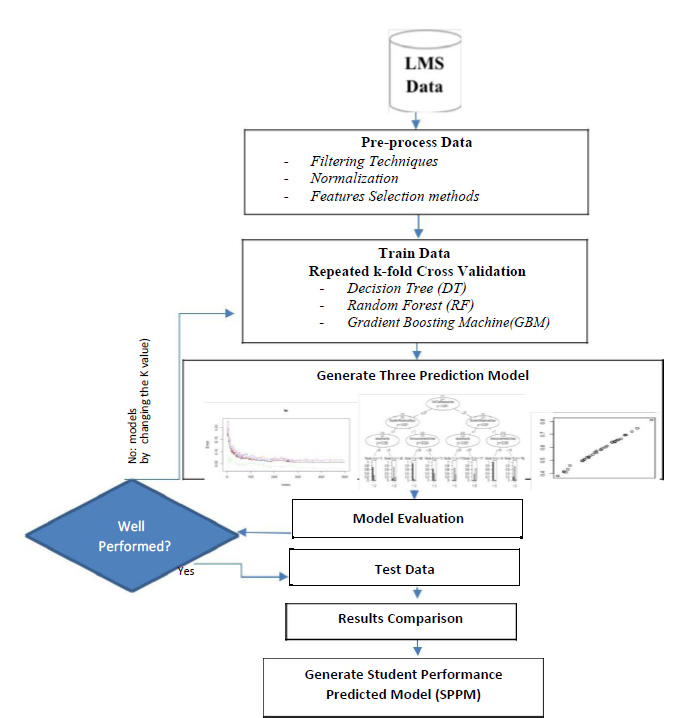 |
Figure 2: SPPM Student Performance Predicted Model |
Data Pre-processing
Data comes from LMS could not be directly apply into machine learning methods. Data preprocessing is very important step before doing so, it transforms the row data into a suitable shape to be used by a particular machine learning algorithm. Data preprocessing used in this study includes data filtering, normalizing and feature selection.
Data Filtering and Normalizing
In order to minimize the impact of errors in the data set on succeeding analyses the filters are presented as psedu code and implemented in R language. This study utilized filtering techniques to make sure that the data set is ready for the model. In the data set we take out 7 variables which are not considering to be a predictor variable because they are out of the scope of our study and not our focus. These variables are: Place of birth, Nationality, StageID, GradeID, Topic, Semester, SectionID. Then, normalization to 0 – 1 scale is performed over attributes such as gender, Relation, Student Absence Days, Parent Answering Survey and Parent School Satisfaction and store them as a factor. The class attribute is the target dependent variable of the study and it has three classes: ‘1’ represents weak students, ‘2’ represents middle level students and ‘3’ represent high-level students.
Features Selection
One of the most effective steps in getting better results is to build a model based on the most relevant features. In this section we apply two correlations techniques in order to choose the most relevant attributes that will affect the model. Regarding categorical predictor’s variables we applied the Goodman and Kruskal’s tau [3] measure as shown in figure 3. As we can see, there is a diagonal K values indicating the number of classes associated with each variable. The off-diagonal elements contain the forward and backward tau measures for each variable pair. In our model we want to decide the association between each independent variable and the target variable. The most obvious feature from this plot is the fact that the variable Student Absence Days is nearly predictable (ô(‘Class’,’ Student Absence Days’)=0.47) from class and this forward association is quite strong but not enough for predicting.
Unfortunately, this approach indicating one variable that is highly correlated with the target variable so that the Contingency Table Analysis [4] as another correlation approach is provided. In figure 4 we provide 5 bar charts from Contingency Table Analysis to utilize the relationship between each variable and the predicted variable.
As we can see in figure 4 only 14% of the female students are getting low mark but the chance on getting low mark is increased in male side by 8%. Figure 5 confirms the previous results shown in figure 3 of the strong association between the students’ absence days and the students’ performance. It shows that only 96% from the students who has less than 7 days of absence get high marks while 91% of the students who has been absent more than 7 days get low mark.
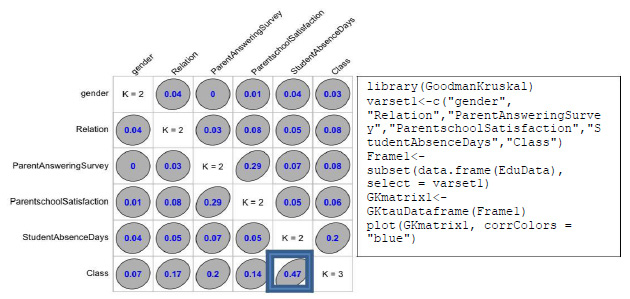 |
Figure 3: Correlation Between Categorical Variables |
 |
Figure 4: Relationship Between Gender and Class Level |
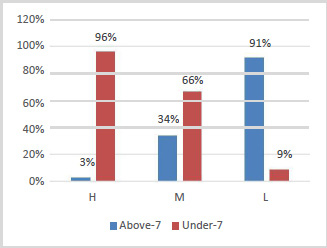 |
Figure 5: Relationship Between Student Absence Days and Class Level |
In figure 6 we can see a strong relationship between parents who did not answering the survey and the students’ grade level as 47% of them are fall in low level and only 13% of them getting high mark. Moreover, in figure 7 indicates that the ‘Relation’ variable has impact on the predicted grade level as only 12% of the students get low marks who their mother is the responsible parent. The students visualized in figure 8, demonstrates the hidden impact of the parent school satisfaction variable on the predicted variable. The parent who has a good background in the school effects the final students’ academic performance. All the previous graphs are representing the relation between the categorical variables and the object variable but to measure the correlation between the numerical variable which are the most important features in this study to examine their impact on the students’ academic performance we applied correlation plot function in R language for all numerical features as shown in figure 9.
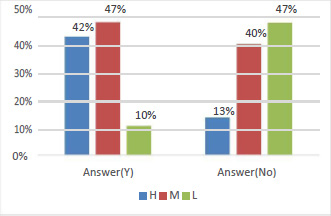 |
Figure 6: Relationship Between Parent Answering Survey and Class Level |
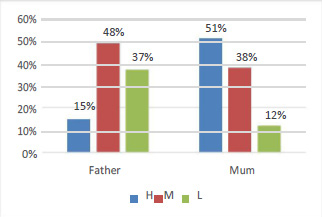 |
Figure 7: Relationship Between Responsible Parent and Class Level |
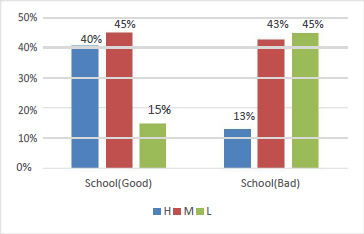 |
Figure 8: Relationship Parent School Satisfaction and Class Level |
As we can see getting dark blue color in some squares and light one on the other, the darkness color indicating the high correlated relation between the variables. Obviously all behavioral attributes are high correlated with the predicted variable as all of them getting more than 0.60 value excepting ‘Discussion’ variable which is a good indicator that this variable has less impact on the students’ performance. The total information shown in the table 2 about the value associated with each relationship are obtained using ‘cor’ function in R language. As we can see from both table 2 and figure 9 the most significant variables are ‘VisITedResources’,‘Raisedhands’, ‘AnnouncementsView ’ and ‘Discussion ’ has the lowest impact among the other behavioral attributes. This is a significant indicator that students’ academic performance will be affected by their interaction with the E-learning System mainly by three factors: raising hands to gather or ask for an information, visiting the resources provided in the system for enrolled course and viewing their uploaded announcements.
| Table 2: Correlation Between Numeric Variables | |||||
| Raised hands | Raisedhands | Vis ITed Resources | Announcements View | Discussion | Class |
| 1.0 | 0.69 | 0.64 | 0.34 | 0.65 | |
| Vis ITed Resources | 0.69 | 1.0 | 0.59 | 0.24 | 0.68 |
| Announcements View | 0.64 | 0.59 | 1.0 | 0.42 | 0.53 |
| Discussion | 0.34 | 0.24 | 0.42 | 1.0 | 0.31 |
| Class | 0.65 | 0.68 | 0.53 | 0.31 | 1.0 |
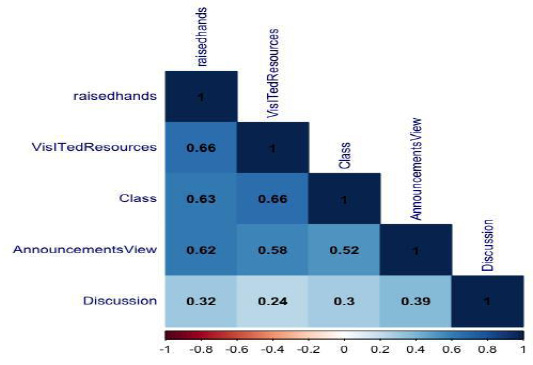 |
Figure 9: Correlation Between Numeric Variables |
In Table 3, we calculate the average value of each students’ behavioral feature for all students with each class individually using the equation ! ∑” as n is the total number of observations with specific class and x is the sum of features for that class A,B,C and D as A referring to raised hands, B referring to Visited Resources, C referring to Announcements View and D for Discussion feature. As we can see in figure 10 the average participation for each student with class level ‘H’ is 64% while the percentage getting lower for whom with class ‘M’ or ‘L’.
| Table 3: Comparison of Prediction Accuracies for Dataset I | |||
| Criterion | Accuracy | Kappa | |
| Validation Data | Test Data | ||
| Decision Tree | 0.67 | 0.64 | 0.44 |
| Random Forest | 0.98 | 0.74 | 0.59 |
| Gradient Boosting Machine | 0.77 | 0.73 | 0.59 |
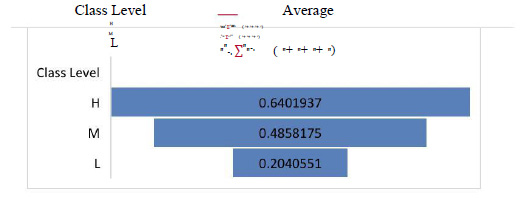 |
Figure 10: Comparison between Interaction Ratio for Individual Class |
Student Performance Prediction Model (SPPM)
In this study, Student Performance Prediction Model SPPM is developed using data mining techniques for classification and predicting the level of the students’ performance in E-learning system (LMS). A generated classifier model makes use of a learning algorithm in finding a model that best defines the impact of two groups of features: students’ behavioral and parent engagement attributes on the students’ performance level. [5] We implemented SPPM based on LMS datasets after minimizing its variables to be only 9 variables including the target one which is selected based on features selection techniques as mentioned in section 4.1. The resampling method or so called cross-validation is the machine learning method used in R language to build our model; the structure of that model was shown earlier in Figure 1.
The algorithm has been trained on the datasets of size consisted of 480 observations. The predictors variables divided into two groups one regarding students’ behavioral features such as raised hands, view announcements, visited resources, discussion and students’ absence days and the second group is regarding parent involvement features such as relation, parent school satisfaction and parent answering survey. We used fivefold cross validation and repeat this process ten times to achieve better results. In the following, we briefly present the four well known machine learning techniques that we used in this study: A Repeated k-fold Cross Validation techniques is applied for three classification methods: Decision Tree (DT), Random Forest (RF) and Gradient Boosting Machine(GBM), and compare between them in order to observe the best results in the study.The resampling methods is implemented two times: the first time, we build SPPM model on Dataset I including only students’ behavioral variables and the second time on Dataset II including all selected variables. In addition to the accuracy measure, we used other evaluation techniques and methods to evaluate the results obtained in Section 5. The results and their evaluations are included in the next section (Analysis and Results) of this paper, where we used Specificity and Sensitivity as other measures.
Analysis and Results
Datasets used in this study contains the students’ behavior, their parent engagement features, other information regarding topics been studied, students’ education background and the performance level of the specific topic. as described in Section 3. In order to identify a subset of variables that could improve the accuracy of all classifiers, we selected those features that were given by the feature selection techniques mentioned in Section 4.1.2. The students’ behavior features and their parent engagement features have been used to predict the students‘ overall performance at the end of the degree.
As mentioned earlier, there is no classifier better than other as the outperform of the classifier depends on several factors, one of the most important one is the attributes. For instance, The accuracy of Decision Tree reached 64 %, while the accuracy of Gradient Boosting Machine reached 73% which is not good comparing to Random Forest method. When we apply the classifiers on the Dataset I which includes only students’ behavior features as shown in table 3 the Random Forest method outperformed among the other classifiers as it reached 74% accuracy. While the accuracy of SPPM increases by 6% using Random Forest algorithms on Dataset II as shown in table 5 with ‘mtry’=2 as graphed in figure 11. In addition, we found that the parent engagement case has a significant impact on the students’ performance.
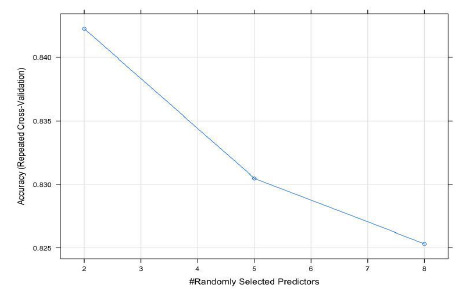 |
Figure 11: Accuracy Rate versus ‘mtry’ |
Summing up, from the 3 models obtained on both Dataset I and Dataset II with k=6, the highest accuracy is obtained using Random Forest method. By looking at the accuracy of each class, we can notice that students with class ‘L’ or ‘H’ getting more prediction balanced accuracy compared to class ‘M’ for all classifiers on both datasets as shown in table 4 and table 6. The reason for that might be related to the difficulty of defining the students who will gain ‘M’ class without using any assessment features such as their results on assignments, midterm exam, quizzes or any other assessment.
| Table 4: Comparison of Three Predictions Measures for Dataset I | |||||||||
| Criterion | Balanced Accuracy | Specificity | Sensitivity | ||||||
| Class | Class | Class | Class | Class | Class | Class | Class | Class | |
| ‘L’ | ‘M’ | ‘H’ | ‘L’ | ‘M’ | ‘H’ | ‘L’ | ‘M’ | ‘H’ | |
| Decision Tree | 0.83 | 0.63 | 0.69 | 0.84 | 0.63 | 0.93 | 0.82 | 0.63 | 0.44 |
| Random Forest | 0.89 | 0.69 | 0.77 | 0.90 | 0.74 | 0.88 | 0.87 | 0.68 | 0.63 |
| Gradient Boosting Machine | 0.89 | 0.73 | 0.78 | 0.93 | 0.75 | 0.88 | 0.84 | 0.70 | 0.67 |
| Table 5: Comparison of Prediction Accuracies for Dataset II | |||
| Accuracy | |||
| Criterion | Validation Data | Test Data | Kappa |
| Decision Tree | 0.64 | 0.61 | 0.44 |
| Random Forest | 0.98 | 0.80 | 0.76 |
| Gradient Boosting Machine | 0.81 | 0.77 | 0.69 |
Additionally, in Decision Tree ,Random Forest and Gradient Boosting Machine model the fraction of the students with class ‘H’ correctly identified by the test dataset is 44% and getting higher in identifying students with class ’L’ which means that might be because the dataset we used is unbalanced. Another reason for that, is students behavioral features and parent engagement features consider to be a good indicator of students academic performance however, they are not enough to predict the performance without other assessment features.
| Table 6: Comparison of Three Predictions Measures for Dataset II | |||||||||
| Evaluation Measures | Balanced Accuracy | Specificity | Sensitivity | ||||||
| Methods Used | Class ‘L’ | Class ‘M’ | Class ‘H’ | Class ‘L’ | Class ‘M’ | Class ‘H’ | Class ‘L’ | Class ‘M’ | Class ‘H’ |
| Decision Tree | 0.84 | 0.58 | 0.81 | 0.76 | 0.86 | 0.81 | 0.92 | 0.30 | 0.81 |
| Random Forest | 0.92 | 0.77 | 0.82 | 0.91 | 0.81 | 0.92 | 0.92 | 0.75 | 0.74 |
| Gradient Boosting Machine | 0.88 | 0.76 | 0.85 | 0.94 | 0.81 | 0.88 | 0.82 | 0.71 | 0.81 |
Conclusions
This research presented the effectiveness of students’ interaction behavior in e -learning system and used machine learning classification techniques to predict a students’ performance. In this paper, three classifiers are applied:(Decision Tree, Random Forest, and Gradient Boosting Machine) with K-fold Cross Validation and found that the Random Forest classifier gives the best results when used with students’ dataset II (behavioral and parent engagement attributes). A student performance predicted model (SPPM) is built, and the results show that the approach of using features selection techniques is very efficient and accurate in predicting student’s performance as well as help in proper identification of student at risk of attrition. Mostly, this study benefits the understanding the great impact of social case in predicting student’s performance by applying the resampling techniques. The results may help the educators to obstacle the low performance issue, by determining students that may be less interactive and send announcements to enhance them to be more active. The accuracy of our proposed model (SPPM) using behavioral features and parent engagement features achieved up to 6% improvement compared to the results when removing parent features, and it achieved up to 80% accuracy using Random Forest method. The most effective behavioral features on our SPPM are visited resources, raised hands and the number of absence days. For future work, it is better to try more classifiers, and working with the balanced dataset or testing a different E-learning sources.
References
- E. Abu Amrieh, T. Hamtini , I. Aljara, “Mining Educational Data to Predict Student’s academic Performance using Ensemble Methods,” International Journal of Database Theory and Application, vol. 9, no. 8, pp. 119-136., 2016.
- “The R Project for Statistical Computing,” The R Foundation, [Online]. Available: https://www.r-project.org. [Accessed 01 10 2018].
- R. Pearson, “The GoodmanKruskal package: Measuring association between categorical variables,” 12 04 2016. [Online]. Available: https://cran.r-project.org/web/packages/GoodmanKruskal/vignettes/GoodmanKruskal.html. [Accessed 01 12 2018].
- I. StatSoft, “Electronic Statistics Textbook.,” StatSoft. WEB, Tulsa, OK, 2013.
- R. Asif, M. Agathe , M. Mahmood, “Predicting Student Academic Performance at Degree Level: A Case Study.,” International Journal of Intelligent Systems Technologies and Applications, vol. 7, no. 1, pp. 49-61, 2014.
- H. M. Hill, “ Chromatography in a regulated environment,” in Handbook of Analytical Separations, vol. 4, Huntingdon, Cambridgeshire: Huntingdon Life Sciences, 2003, pp. 373-411.
- L. Breiman, “Manual on setting up, using, and understanding random forests,” 2002. [Online]. Available: https://www.stat.berkeley.edu/~breiman/Using_random_forests_v 4.0.pdf. [Accessed 05 12 2018].
- J. L. Knowles, Self-directed learning: A guide for learners and teachers, New York, NY: Association Press, 1975.
- S. R. Safavian, D. Landgrebe, “A Survey of Decision Tree Classifier Methodology,” IEEE Systems, Man, and Cybernetics Society, vol. 21, no. 3, pp. 660 – 674, 1991.
- B. Rienties and L. Toetenel, “The impact of learning design on student behaviour, satisfaction and performance: A cross-institutional comparison across 151 modules,” Computers in Human Behavior, vol. 60, pp. 333-341, 2016.
- J. B. Arbaugh, “System, scholar, or students? Which most influences online MBA course effectiveness?,” Journal of Computer Assisted Learning, vol. 30, no. 4, pp. 349-362, 2014.
- S. J. Bartley, J. H Golek, “Evaluating the Cost Effectiveness of Online and Face-to-Face Instruction,” Educational Technology & Society, vol. 7, no. 4, p. 167–175, 2004.
- J. Evans, I. Haase, “Online business education in the twenty‐first century: an analysis of potential target markets.,” Internet Research, vol. 11, no. 3, p. 246–260., 2001.
- C. De la Varre, J. Keane, M. J. Irvin, “Enhancing Online Distance Education in Small Rural US Schools: A Hybrid, Learner-Centred Model.,” Asynchronous Learning Networks, vol. 15, no. 4, p. 35–46., 2011.
- C. Gratton-Lavoie, D. Stanley,, “Teaching and learning principles of Microeconomics online: An empirical assessment.,” The Journal of Economic Education, vol. 40, no. 1, p. 3–25, 2009.
- J, Lorenzetti, “Academic Administration – Running a MOOC: Secrets of the World’s Largest Distance Education Classes,” Magna Publications., 2013.
- S.B., Kotsiantis; C.J. , Pierrakeas; P.E., Pintelas”Predicting Students’ Performance in Distance Learning Using Machine Learning Techniques.,” Applied Artificial Intelligence, vol. 18, no. 5, pp. 411- 426, 2004.
- I. Ionita, “Data mining techniques for e-learning,” Journal of Applied Computer Science & Mathematics , vol. 10, no. 2, 2016.
- Manyika, J.; Chui, M.; Brown, B.; Bughin, J.; R. , Dobbs; C., Roxburgh; A. Byers , “Big Data: The Next Frontier for Innovation, Competition, and Productivity,” McKinsey Global Institute, 2011.
- P. Golding, S. McNamarah, “Predicting Academic Performance in the School of Computing & Information Technology (SCIT),” in 35thASEE /IEEE Frontiers in Education Conference,, 2005.
- E. Abu Amrieh, T. Hamtini and I. Aljarah, “Mining Educational Data to Predict Student’s academic Performance using Ensemble Methods,” International Journal of Database Theory and Application , vol. 9, no. 8, pp. 119-136, 2016.
- J. Parris and M. Feeley, “An Assessment of the PeerWise Student-Contributed Question System’s Impact on Learning Outcomes: Evidence from a Large Enrollment Political Science Course,” 1 Sep 2012. [Online]. Available: https://poseidon01.ssrn.com. [Accessed 12 2018].
- A, Bissacco; M-H, Yang; S, Soatto, “Fast human pose estimation using appearance and motion via multi-dimensional boosting regression,” in IEEE Conference on Computer Vision and Pattern Recognition, Minneapolis, 2007.

