1Department of Soil & Water Conservation Engineering, JNKVV, Jabalpur
2Professor, Department of Soil & Water Conservation Engineering, JNKVV, Jabalpur
3Professor & Head, Department of Soil & Water Conservation Engineering, JNKVV, Jabalpur
Article Publishing History
Received: 20/06/2017
Accepted After Revision: 27/09/2017
Groundwater is an enormously vital water resource available on earth. Due to over exploitation of groundwater, especially in dry regions and in the water scares areas, has led to irretrievable consequences due to deterioration of water quality. The groundwater resources, which are found in shallow depth often have poor in water quality and in most cases the ground water are severely over-exploited. Therefore, the study has been planned to identify the spatial & temporal variation of aquifer responses of the study area to the natural recharge as well as Ground water level trend in last 15 years. This study is conducted in Tawa command area, which lies in Hoshangabad District of Madhya Pradesh. Also facing problem of water logging and shortage in the region. The study identified the spatial behavior of ground water level in pre-monsoon and post monsoon. Insight of the current study, the spatial and temporal graphical analysis for the observation sites of the unconfined aquifer indicated that there is a good hydraulic connection of groundwater level with the rainfall.
Aquifer, Groundwater Resources, Water Logging, Water Level Fluctuation
Nema S, Awasthi M. K, Nema R. K. Spatial and Temporal Ground Water Responses to Seasonal Rainfall Replenishment in an Alluvial Aquifer. Biosc.Biotech.Res.Comm. 2017;10(3).
Nema S, Awasthi M. K, Nema R. K. Spatial and Temporal Ground Water Responses to Seasonal Rainfall Replenishment in an Alluvial Aquifer. Biosc.Biotech.Res.Comm. 2017;10(3). Available from: https://bit.ly/2x02Tbc
Introduction
Water is the most vital resource of both biosphere and human society, without which no life can sustain on the earth. Over 95% of the earth’s useable freshwater is stored as groundwater, of which about 50% exists within the earth’s crust down to a depth of 800 m, while only 1.5% exists in rivers and lakes (World Bank, 2010). Over exploitation of groundwater for irrigation and other purposes, especially in dry climates and in areas which are facing water stress, has led to irreversible consequences. The water stress on different sessions leads to Groundwater-level fluctuations, which basically represent hydraulic responses to changes in groundwater storage due to aquifer recharge and drainage as well as to changes in stress that include water mass loading and unloading above the aquifer surface (Burgess et al., 2017).
In order to meet the requirement of fast growing population and industrialization, the water demand has been increased significantly all over the globe. Overexploitation of groundwater in many part of the world has resulting a threatening condition of falling groundwater levels, saline water infringement, crop demand-supply gap, drying of the shallow aquifers, increasing power consumption due to increase in cost of lift, decrease in free flow and even local subsidence in some places (Singh and Singh, 2002).
In many regions there is a lack of surface water resource and the water bearing sub-surface zones are having severe water contamination. Shallow groundwater resources are often of poor quality and above that they are severely over-exploited. In a recent study based on the analysis of GRACE satellite data revealed that the groundwater resources in the states of Rajasthan, Punjab and Haryana are being depleted at a mean rate of mean rate of 4.0+1 cm yr-1 (Rodell et al., 2009).
Thus, it is evident that the current patterns of water development and consumption are not sustainable in several countries of the world, including India. Impending global/regional climate change, increasing population and growing socio economic changes are expected to exacerbate existing groundwater depletion through considerable rise in water demand (Sauer et al., 2010; Brown et al., 2013) and alterations in the spatio-temporal availability of freshwater resources (Healy, 2002; Elliott et al., 2014; Schewe et al., 2014; Bouwer, 2002; CGWB, 2012; Singh, 1997; Kumar, 2002; Vanderzalm et al. 2015 Nema 2017, and Smith et al., 2016).
Therefore, there is an urgent need for efficient management of freshwater resources in India in order to ensure sustainable management of our depleting freshwater resources.In many parts of India, The water table is declining at a very fast rate. In few locations, it has been gone beyond to the depth where it is uneconomical for pumping water for non-commercial and commercial uses. In few states, the situation is so critical that Government has banned ground pumping to stabilize the ground water. Groundwater extraction rate is not only the one factor which is responsible for declining water levels, the low rainfall resulting due to inadequate monsoon is equally responsible. Majority of the ground water stress areas categorized as overexploited and critical units also lies in such states. Considering the importance of Groundwater, the issue of Ground water declination or waterlogging has to be taken with priority considering all the proved water management technologies along with efficient strategies shall be adopted that could help to reduce the prevailing disaster. This current study demonstrate a comprehensive analysis of the effects of spatial and temporal precipitation patterns on Ground water level fluctuations.
Material and Methods
Hoshangabad District which is situated in Upper Narmada Region, M.P., lndia (Fig.1) was selected for this study. Narmada River, the other main river of Hoshangabad is Tawa River, which flows towards north and joins river Narmada near Hoshangabad.District Hoshangabad covers majority of Tawa command areas which are the primary sources of irrigation for entire district. The Hoshangabad district lies between north latitudes 22º 15’ and 23º 00’ and east longitudes 77º 15’ and 78º 42’ in part of survey of India topo sheet Nos, 55F & 55J. Hoshangabad is the district headquarter and Sohagpur, Piparia, Babai, Pachmarhi, Seoni Malwa and Bankheri are some of the major towns. The location map of study area is represented in Fig. 1. Soils of the area are characterized by black grey, red and yellow colors, often mixed with red and black alluvium and ferruginous red ravel or lateritic soils.
 |
Figure 1: Location map of the study area |
Northern part of the study area (i.e. Hoshangabad district), adjoining the Narmada river is covered with alluvium, which makes for more than 50% of the entire district.
Deccan traps occur as lava flows in the west central part of the district. The southern part of the district is hilly and occupied by rocks belonging to Gondwanas. There are two aquifer systems present in the study area. The top phreatic aquifer range in thickness from 4 to 30m and is encountered in the depth range of 4 to 20 mbgl. The phreatic aquifer has intercalations of clay and silt, and at places also of coarse sand or gravel. The Deeper aquifer (i.e. confined aquifer) ranges varies from 30 m to 60 m.
Water Level Fluctuation in the
Study Area
Water table Declination in summer season is a common problem for many part of the state as well as for India. The current study has been done to observe the ground water level of study area with observing the rainfall (pre monsoon and post monsoon) and river gauge impact over ground water level for 16 years period from year 2000 to year 2015. The fluctuations have been observed in relation to rainfall (pre monsoon and post monsoon). The water table fluctuations have been influenced by many factors. The decline of groundwater level occurs when the outflow exceeds or less recharge over the area. The groundwater-level level data of 74 observation wells tapping unconfined aquifer were collected for 15 years (2000-2015) from the Central Ground Water Board (CGWB) and the Ground Water Survey and Investigation (GWS&I), Bhopal, Madhya Pradesh.
Results and Discussion
Seasonal Water Level Fluctuations Due to Rainfall (Year 2000 To 2015)
Monthly variations of rainfall in the study area over 16-year period (2000-2015) at eight rainfall/rain gauge stations along with the line graphs are shown in Fig. 4.2 It is apparent from Fig. 2 that though the rainfall events are somewhat distributed throughout the year, however the magnitude of rainfall is quite less or zero in some places. The rainy season usually starts from mid-June and lasts up to the end of October.
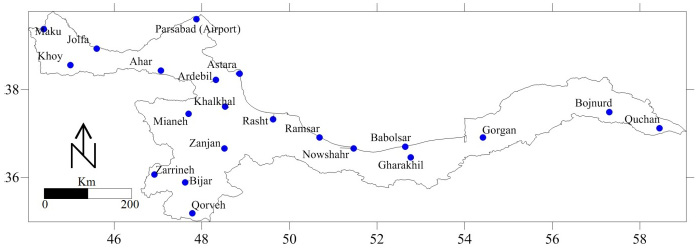 |
Figure 2: Monthly variations of rainfall in the study area over 16 years (2000-2015) |
Thus, the bulk of the annual rainfall is concentrated in a relatively short span of time and hence runoff and groundwater recharge are confined to these months. As sufficient rainfall is available during July, August, September and October, groundwater withdrawal is minimum during these months. The standard line graph indicate monthly variation of rainfall over 16-year period. The large standard line graph during May to October indicated considerable temporal variation of rainfall in these months (Fig. 2). However, during November through April, the variation in monthly rainfall is very small. Furthermore, the rainfall of Pachmari station has the highest rainfall for month of August, followed by Hoshangabad & Seoni Malwa.
Long-term variations in the annual rainfall of the study area from 2000 to 20l5 are shown in Fig. 3 for the eight rain gauge stations. The average annual rainfall over the study area is estimated at about 1099.24 mm based on 16 years (2000-2015) rainfall records. In contrast, the rainfall at Pachmari station was found highest and found above than average annual rainfall for all years. The analysis were also done to find out the spatial variation of mean ground water fluctuation depth class (Mean of 2000-2015) over study area as shown in Fig.4., Fig. 5. & Fig. 6.
 |
Figure 3: Variations of Annual Rainfall during 2000-2015 Period at Eight Rainfall Stations |
 |
Figure 4: Spatial Variations of Mean Pre Monsoon Ground water Depth |
 |
Figure 5: Spatial Variations of Mean Post Monsoon Ground water Depth |
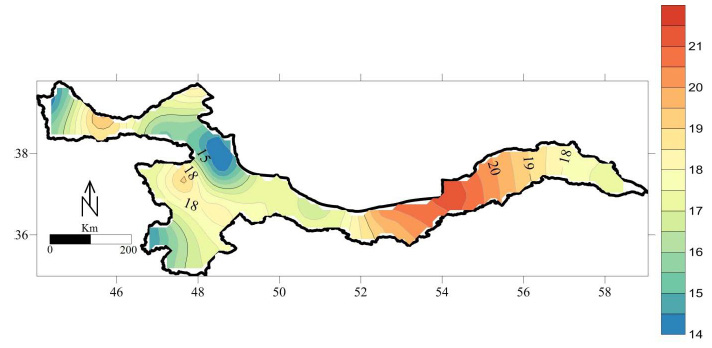 |
Figure 6: Spatial Variation of Mean ground water fluctuations depth classes |
The minimum pre-post water fluctuation was observed in Hoshangabad and Kesla Block. The fluctuation of Pre-Post-monsoon groundwater depths (mean of 2000-2015) was maximum in Bankhedi followed by Babai, Sohagpur and Seoni Malwa block over the study area is shown in Fig. 5 & Fig. 6. It is clearly evident that the Bankhedi block of Hoshangabad showing the maximum water fluctuation depth which may be due to the non-command area exist on Bankhedi (Nema, 2017).
The average annual water level at downstream site varies from 5.5 to 7.0 m in last 15 years. The rainfall amount and ground water level from mean sea level has been found inversely proposal similar to upstream and middle stream sites.
The analysis of groundwater-depth contour maps of pre- and post-monsoon seasons revealed that the mean seasonal groundwater fluctuation in the study area ranges from 3.45 to 7.70 m, with a major portion of the study area having a mean groundwater fluctuation of 4.50 to 6.70 m.
Temporal analysis of Ground water level had been done in to upstream, mid stram and down stram sites represented in Fig 7(a-c). It has been evident from Fig. 7.(a) that in upstream, mean ground water depth varied in the range of 10-13 m from mean sea level (MSL).
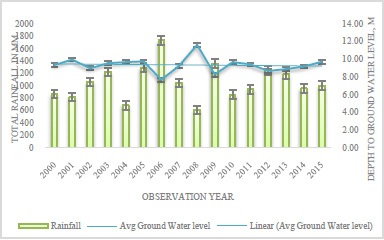 |
Figure 7a: Temporal Response of Average annual ground water level with respect to Rainfall for upstream region |
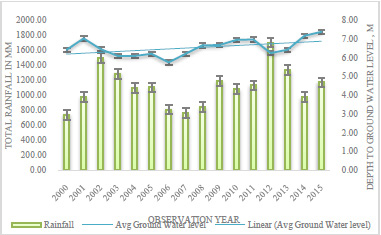 |
Figure 7b: Temporal Response of Average annual ground water level with respect to Rainfall for mid-stream region |
The ground water depth from MSL is seems to be inversely correlated with rainfall. As the rainfall amount increases the depth of water table from MSL has decreases. Fig 7.(b) indicated the similar kind of pattern of ground water behavious with respect to rainfall having avg. depth 6 to 7.8 m. The trend of ground water level wass also found increasing in middle region over the period of time.
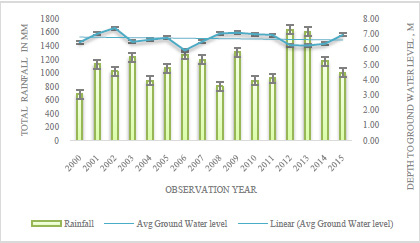 |
Figure 7c: Temporal response of Average annual ground water level with respect to Rainfall for downstream region |
The similar kind of pattern of ground water depth behaviour with respect to rainfall was found in downstream region. The avg. depth to ground water from mean sea level is around 5.5 m to 7 m in last 15 years
Conclusion
Insight of the current study, the spatial and temporal graphical analysis for the observation sites of the unconfined aquifer indicated that there is a good hydraulic connection of groundwater level with the rainfall. It can also be revealed that the rainfall has reasonable correlations with the groundwater level of Aquifer and suggesting a significant contribution of recharge from the rainfall sources to unconfined aquifer. The study also indicated that Bankeri block whichh lies in upstream followed by Babai block having maximium water fluctuation and depth in pre-monsoon & post monsoon which needs to be addressed in future for arresting groundwater declination further.
Refrences
- Bouwer, H. (2002). Artificial recharge of groundwater: hydrogeology and engineering. Hydrogeology Journal, 10:121-142.
- Brown T.C., Foti R, and Ramirez I.A. (2013). Projected freshwater withdrawals in the United States under a changing climate, Water Resources Research, 49: 1259-1276, DOI: I 0.1002/wrcr.20076
- Burgess, W. G., Shamsudduha, M., Taylor R. G., Zahid, A., Ahmed, K.M., Mukherjee, A., Lapworth, D.J. and Bense V.F. (2017). Terrestrial water load and groundwater fluctuation in the Bengal Basin, Nature, Scientific Reports 7(3872), doi:10.1038/s41598-017-04159-w
- (2012). Dynamic Ground Water Resources of India (as on March, 2009). Ministry of Water Resources, Government of lndia, New Delhi.
- Elliott J., Deryng D., Muller C., Frieler K., Konzmann M., Gerten D. and Wisser D. (2014). Constraints and potentials of future irrigation water availability on agricultural production under climate change. Proceedings of the National Academy of Sciences, 111(9): 3239-3244.
- Healy, R. W. and Cook, P. G. (2002). Using groundwater levels to estimate recharge. Hydrogeology Journal, 10: 91–109.
- Kumar, C.P. and Seethapathi, P.V. (2002). Assessment of natural groundwater recharge in Upper Ganga Canal command area. Journal of Applied Hydrology,15: 13-20.
- Nema S. (2017) Ground water utilization using simulation techniques in Tawa command area, Ph.D. thesis, JNKVV, Jabalpur, 205 p
- Rodell M., Velicogua I., and Famiglietti J.S. (2009). Satellite-based estimates of groundwater depletion in India, Nature 460: 999-1002.
- Sauer T, Havlik P Schneider U.A., Schmid E Kindermann G. and Obersteiner M. (2010). Agriculture and resource availability in a changing world: The role of irrigation. Water Resources Research, 46(6), DOI: I0.1029/2009WR007729
- Schewe J Heinke J Gerten D Haddeland I Arnell NW Clark DB and Kabat P. (2014) . Multimodel assessment of water scarcity under climate change. Proceedings of the National Academy of Sciences, 111(9): 3245-3250.
- Singh, B. (1997).Water resources development in India – a perspective. In Proceedings of International Symposium on Emerging Trends in Hydrology, Department of Hydrology, University of Roorkee, Roorkee, India 1: 1-17.
- Singh, D. K. and Singh, A. K. (2002). Groundwater Situation in India: Problems and Perspective, International Journal of Water Resources Development, 18(4): 563-580
- Smith, M, Cross, K, Paden, M & Laban, P (2016). Spring: Managing groundwater sustainably, IUCN, Gland, Switzerland, 135 p.
- Vanderzalm, JL, Dillon, PJ, Tapsuwan, S, Pickering, P, Arold, N, Bekele, EB, Barry, KE, Donn, MJ & McFarlane, D. (2015), Economics and Experiences of Managed Aquifer Recharge (MAR) with Recycled Water in Australia
- World Bank (2010). Deep wells and prudence: towards programmatic action for addressing groundwater overexploitation in India. Washington DC, 120 p.

