1Department of Food Engineering and Technology, Sant Longowal Institute of Engineering
and Technology, Longowal (Sangrur) Punjab India
2Department of Biotechnology, Government Mohindra College, Patiala Punjab India
Corresponding author email: mdeepsibian@yahoo.com
Article Publishing History
Received: 11/07/2020
Accepted After Revision: 10/09/2020
The aim of this study was to observe the effect of chemical stress induced by different salts on the soaking kinetics and germination indices of kidney bean. Water uptake of seed grains greatly affected by the ionic composition of soaking solution used. Water absorption rate and capacities were studied in relation with Peleg’s model using hydration data and plotting graphs at different time interval of soaking. Dimensional analysis like spherecity (Ø), aspect ratio (Ra), volume (V), and surface area (S) was observed using mathematical equations based on linear measurements like length, width and thickness. Effect of salt stress on the germination was observed using various parameters like germination percentage (G), vigor value, mean germination time (t¯), mean germination rate (MR), and coefficient of variation of germination (CV). Grains soaked in different chemicals resulted in the different absorption pattern and Peleg’s constants.
Peleg’s rate constant was lower in NaOH (1.46×10⁻³) and capacity constant was lower in distilled water (2.94×10⁻²). Dimensional characteristic exhibited their dependence on water uptake properties and varied to some extent due to difference in absorption capacities. Germination data also varied for seed grains soaked under different chemical stress. Germination percentage and vigor value were greatly affected due to chemical stresses. Germination percentage was higher in distilled water (78%), whereas vigor value was higher in MgCl2 (0.5%). It was concluded that, salt stress under different chemicals greatly affected the water absorption pattern and as result variation in the germination pattern among different groups was observed.
Salinity, Salt Stress, Soaking Kinetics, Peleg’s Constants, Germination Indices
Sibian M. S, Riar C. S. Soaking Kinetics, Dimensional Analysis and Germination Indices of Kidney Bean Under Different Chemical Stresses. Biosc.Biotech.Res.Comm. 2020;13(3).
Sibian M. S, Riar C. S. Soaking Kinetics, Dimensional Analysis and Germination Indices of Kidney Bean Under Different Chemical Stresses. Biosc.Biotech.Res.Comm. 2020;13(3). Available from: https://bit.ly/3gpayny
Copyright © Sibian et al., This is an open access article distributed under the terms of the Creative Commons Attribution License (CC-BY) https://creativecommons.org/licenses/by/4.0/, which permits unrestricted use distribution and reproduction in any medium, provide the original author and source are credited.
INTRODUCTION
Salt stress is the foremost abiotic stress in the agriculture. It induces adverse effects on the initial developmental stages in plant life cycle. These abiotic stresses were found problematic in seed germination, establishment, reproductive and vegetative growth (Zhu, 2016). Salt stresses may inhibit seed germination and post germinated growth. Germination is correctly defined by Bewley and Black (1994) as the process from imbibition to embryo protrusion in seed grains and post- germination involves the processes after embryo protrusion which leads to plant formation. Thus, soaking kinetics under different chemical stresses needed to be studied and is of practical importance for breeders in the development of salt resistant seeds. Mathematical models based on the theories and diffusion models (Corzo et al. 2004) to interpret absorption data in the form of moisture vs. time was studied periodically for better understanding of absorption behavior of seed grains. According to Rastogi et al. (2000), various researchers used different kind of mathematical models and expressions to understand the rehydration or absorption kinetics of different material (Sanju et al. 1999). Peleg (1988), observed a bivariate mathematical model to observe its potential implication in absorption data (Peleg 1988).
Mixture of salts present in the soil has cumulative effect on the growth of seedling. Cramer (1985) reported that salts affect the functioning and cell wall of seeds. Studies have shown that the influx and efflux of cytosolic solutes were greatly affected by the permeability of membranes which in turn affected by the presence of ions present around (Allen et al. 1995). Apart from permeability salt components could affect the hardening of cell wall (Neumann et al. 1994) and water conductance of plasma membrane (Azaizeh et al. 1992). These changes in the cell membrane and cell wall affect the moisture absorption and germination of seed by affecting the water potential of inner cellular material and cell extensibility (Tobe et al. 2004). Research has also shown the utilization of germinated grains in composite flours to enhance nutrition index of bakery products (Sibian et al. 2020).
Calculating the germination percentage and vigor is not enough to portray the germination profile of seed. Different germination parameters were required to plot the germination characteristic of seed. Germination and vigor test provide only the insight in the performance profile of seed lot and effects the seed storage conditions. Therefore, germination index has been proposed by Riss and Bang-Olsen (1991) to characterize the germination rate. Due to the differences in the germination times of seed among group, the concept of mean germination time has been introduced by Edward (1932) as the concept of extreme times for germination i.e. time for first and last seed to germinate (Tobe et al. 2004).
Prodanov et al. (2004) and Ali et al. (2009) observed the effect of alkalinity and salinity on the composition of certain grains but not much work has been done on the effect of different soaking solutions on the absorption kinetics, and the engineering aspect during soaking along with detailed post germination evaluation of the legume seed. In this research, efforts have been made to observe the effect of individual salts of Na+ and Mg2+ on the soaking kinetics and germination of kidney bean (Phaseolus vulgaris–Cranberry Group). To observe the effect in seed-water relationship, the computational data of different salt stresses and their interaction with the kidney bean was established. Three groups of salt stress treatments were used in comparison with distilled water. Research was distributed into 3 sections viz. soaking and absorption kinetics, dimensional analysis after soaking and computational analysis of germination (Ali et al. 2009).
MATERIAL AND METHODS
Preparation of raw material and soaking solutions: Viable grains of kidney bean (Phaseolus vulgaris–Cranberry Group) were procured from local farmer of Amritsar, Punjab. The age of grains were not more than 6-12 months and were stored in appropriate environment. Different soaking solution groups were prepared viz. NaOH-0.1%; NaHCO3-0.5%; MgCl2-0.5% and distilled water. The concentration of solutions was based on the trial work conducted to optimize the minimal effect of solutions on seed germination.
Soaking of seeds and collection of hydration data: Four sets of pre-weighed seed grains samples (10 grams each) (n=3) were taken and soaked in 250 ml solutions (NaOH-0.1%; NaHCO3-0.5%; MgCl2-0.5%; distilled water) each at 40±2°C in water bath. Temperature of soaking solution was kept constant at 40°C, which was observed as optimum soaking temperature to facilitate the water uptake without exhibiting the boiling effect (Turhan et al. 2002). Measurement of gain in moisture content was observed at different intervals until saturation point was achieved. The hydrated seeds were blotted free of excess surface moisture with tissue paper and then weight was determined using analytical weighing balance (Shimadzu-AUW-D Series). The gain in weight (initial moisture (db) + water uptake) gave the amount of water uptake at that specific time and graphs were plotted between time and moisture gain. The rate of moisture absorption at specific time was calculated as dM/dt i.e. rate of change of moisture at specific time “t”.
Peleg’s constants (K1 and K2): Values of moisture content at different time period were reported as discussed above and then analyzed for the variables of Peleg’s equation in computer based statistical software (Statsoft Statistic ver. 10.0). Moisture content on dry basis was used for the calculation of Peleg’s constants K1 and K2 as per mathematical expression of Peleg (1988):
Where, Mt= moisture content at known time (t) (% db), Mo= initial moisture content (% db), t= soaking time, K1= Peleg’s rate constant, K2= Peleg’s capacity constant.
Dimensional analysis after soaking of seeds: Seeds from each soaking group were randomly measured for Length (L), width (W), and thickness (T). Raw (un-soaked) grains were also measured for dimensional analysis and were compared to observe the effect of soaking. Measurements included the morphological features of grains, which were measured by using digital Vernier caliper (Aerospace 150 mm digimatic) with 0.01 mm accuracy. The average of each measurement group was taken for further dimensional parameters like spherecity, surface area, aspect ratio, volume of seed.
Spherecity (Ø) is the criteria used to describe the shape of seed. The spherecity was calculated using following equation:

Similar to spherecity, aspect ratio is also considered as important criteria to characterize shape of seed grains. The aspect ratio (Ra) of seed grains was calculated as described by Mohsenin (1980) using following mathematical expression:

Surface area of seed grain was calculated using following equations as described by Jain and Bal (1997)

Where,
The measurement of volume and surface area of seed grains is an important criterion to estimate the permeability and moisture absorption pattern of seed. Surface area provide the area of contact of water molecules with the surface of seed grains. Length, width and thickness of seed grains were used as function for the measurement of volume of seed grains. The volume of seed (V) was calculated using following equations as described by Jain and Bal (1997):
![]()
Germination of seed grains: Kidney bean seeds were cleaned and soaked separately in respective solutions. Germination of grains was carried out as per the method described by Sibian et al. (2016) in double chambered seed germinator (Alpha chem 956) under controlled conditions (Temp: 28±1°C /RH: 45±5%) for 96h. Data was generated by repeatedly counting of seeds on different time intervals and emergence of plumule was taken as indicator of germination.
Analysis of seed germination: Germination percentage (G) is the measure of proportion of number of seeds germinated during assay. Vigor value is an important agronomic feature of seeds for establishment of plant and seed germination. Vigor value was observed using following formula (Bradbeer, 1988):

Where; a, b, c, d and x respectively represent the proportion seed germinated after 1, 2, 3 and n days of germination, S is the total number of germinated seeds.
Mean germination time (t¯) is the calculation of average time required for the germination of seed to take place. Mean germination time (t¯) is the measure of rate and time-spread of germination. It was calculated by using following expression as described by Ranal et al. (2009):
Where, ni= number of seeds germinated in the time i,
k= last time of germination
Mean germination rate (MR) is the reciprocal of mean germination time. It is widely used to describe the speed of germination in relation with mean germination time (t¯).
Coefficient of variation of germination time is used to estimate the uniformity or variability of germination time. Coefficient of variation of germination time was calculated by Dorneles et al. (2005) using following relation.
![]()
Where; st= Standard deviation of germination time; t¯=Mean germination time
The analysis was carried out in replicates with weighted average sets for all the samples. A multiple comparison procedure of the treatment means was performed by Duncan’s new multiple range test (Duncan, 1955). Significance of the differences was defined as (P≤0.05). Statistical analysis was carried out in IBM SPSS-16 software.
RESULTS AND DISCUSSION
Soaking kinetics and Peleg’s constants: Moisture absorption in kidney bean was reported higher in distilled water-soaked grains followed by MgCl2 (0.5%). From the absorption data as shown in figure 1, it was also observed that grains soaked in NaOH (0.1%) had lesser absorption of moisture which was slightly lower than NaHCO3 (0.5%). There was lesser difference between the absorption curves of distilled water and MgCl2 (0.5%). Moisture absorption in NaHCO3 (0.5%) soaked grains was higher during the early stages of soaking as compared to NaOH (0.1%) but slightly varied at the end of soaking process. Saturation point or equilibrium was attained in lesser time in distilled water-soaked group and required longer time in NaOH (0.1%) group.
Figure 1: Moisture absorption pattern in kidney bean (dry basis) in different soaking medium (NaOH-0.1%; NaHCO3-0.5%; MgCl2-0.5% and distilled water) at different time intervals.

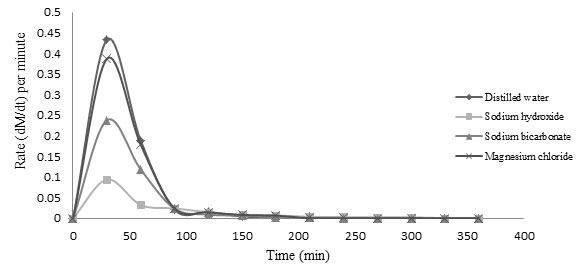
Rate of absorption was observed in all treatment groups as shown in figure 2. Distilled water showed higher rate of absorption and thus attained saturation point at earliest followed by MgCl2. Rate of hydration was lower in NaOH (0.1%) and NaHCO3 (0.5%) soaking group. Kamkar et al. (2009) and Mendoza-Sánchez et al. (2016), observed the negative impact of chemical stresses on the common bean due to structural and compositional changes to the seed coats. Sibian et al. (2016) concluded the fact that ions dissociated in soaking solution formed complexes with seed coat components and obstruct the process of active water uptake (Sibian et al. 2016).
Figure 2: Rate of moisture absorption (dM/dt) during soaking in different soaking medium/solution (NaOH-0.1%; NaHCO3-0.5%; MgCl2-0.5% and distilled water) at different time intervals in kidney bean
Further confirmation of water uptake and hydration pattern was analyzed in Peleg’s model equation. Peleg’s constant K1 & K2 conveyed the information of soaking kinetics in term of two parameter empirical equation. Kidney bean grains are larger grains among other legumes and provided optimum surface area for water absorption but lower absorption rate due to the seed surface composition. Peleg’s rate constant and capacity constant are inversely related to the rate of absorption and absorption capacities.
Table 1. Summary of Peleg’s Constant (K1 & K2) for kidney bean (cranberry bean) in different medium/soaking solutions.
| Rate Constant (K1) | Capacity Constant (K2) | r 2 | |
| Distilled water | 1.57×10⁻² | 2.94×10⁻² | 0.98 |
| NaOH-0.1% | 1.46×10⁻³ | 4.29×10⁻² | 0.98 |
| NaHCO3-0.5% | 2.95×10⁻² | 4.52×10⁻² | 0.98 |
| MgCl2-0.5% | 1.86×10⁻² | 2.99×10⁻² | 0.99 |
Peleg’s constants were in inverse relationship with hydration rate and capacity i.e. lower value of constants corresponds to higher water absorption rate and water absorption capacity (Sibian et al. 2013). Peleg’s rate constant (K1) in kidney bean soaking kinetics was lower in distilled water which could be justified due to higher initial water absorption rate. NaOH (0.1%) soaking solution gave the higher value of Peleg’s rate constant, corresponding to its lower rate of absorption. Peleg’s rate constant (K1) for MgCl2 (0.5%) was lower than distilled water-soaked grains followed by NaHCO3 (0.5%).
Peleg’s capacity constant (K2) was lower in distilled water and Mgcl2 soaked grains followed by NaOH (0.1%) which was slightly lower than NaHCO3 (0.5%) soaked kidney bean grains (Table 1). The mathematical expression of Peleg’s constants, justified the hydration pattern as observed in figure 1 and 2. Non-ionic soaking medium like distilled water did not participated in complex formations with seed coat of kidney bean. If rapid uptake of water occurs it correspond to the fact that ions facilitate the movement of water without being affected by nature of seed wall components otherwise the interaction imparts negative effect on soaking behavior of grains as in present case of kidney bean. Variation in Peleg’s constant due to chemicals were previously reported in pearl millet (Sibian et al. 2013) and chickpea (Sibian et al. 2016).
Dimensional Analysis: Dimensional analysis (Table 2) was done along the 3 geometric axis of seed grains to determine its length, width and thickness. Change in the length (Δl) varied insignificantly among all soaking solutions except NaHCO3 (0.5%) soaked grains. Variation in width (Δw) was observed higher in distilled water and MgCl2 (0.5%) soaked group (Δw=0.47±0.00 and 0.46±0.02 respectively). Value of variation in width observed in NaOH (0.1%) was 0.43±0.04 which was slightly higher than NaHCO3 (0.5%) (Δw=0.38±0.01). Linear increase in the dimension was analyzed in all soaking groups during the soaking of grains. Bolaji et al. (2017) observed the similar pattern of increase in the dimensions of maize as a result of soaking (Bolaji et al. 2017).
Table 2. Comparison of variation in dimensions of kidney bean (cranberry bean) after soaking in different soaking medium/solutions (NaOH-0.1%; NaHCO3-0.5%; MgCl2-0.5% and distilled water)
| Characteristics | Material | Distilled water | NaOH (0.1%) | NaHCO3 (0.5%) | MgCl2 (0.5%) |
| Length (l)mm | Raw | 15.84±0.02 | 15.81±0.01 | 15.83±0.03 | 15.82±0.03 |
| Soaked | 16.15±0.04 | 16.11±0.01 | 16.10±0.01 | 16.13±0.02 | |
| Δl (mm) | 0.31±0.03abc | 0.30±0.01cab | 0.27±0.04d | 0.31±0.04bca | |
| Width (w)mm | Raw | 7.35±0.01 | 7.32±0.02 | 7.34±0.02 | 7.33±0.02 |
| Soaked | 7.81±0.01 | 7.75±0.04 | 7.72±0.04 | 7.79±0.01 | |
| Δw (mm) | 0.47±0.00ab | 0.43±0.04c | 0.38±0.01d | 0.46±0.02ba | |
| Thickness (t)mm | Raw | 4.47±0.02 | 4.55±0.01 | 4.52±0.01 | 4.56±0.04 |
| Soaked | 5.14±0.01 | 5.09±0.01 | 5.10±0.01 | 5.12±0.01 | |
| Δt (mm) | 0.57±0.02ba | 0.54±0.01d | 0.58±0.02ab | 0.56±0.05cb | |
| Spherecity (φ) | Raw | 0.51±0.00 | 0.51±0.00 | 0.51±0.00 | 0.51±0.00 |
| Soaked | 0.54±0.00 | 0.53±0.00 | 0.53±0.00 | 0.54±0.00 | |
| Δφ | 0.03±0.00ab | 0.02±0.00cd | 0.02±0.00dc | 0.03±0.00ba | |
| Aspect ratio (Ra) | Raw | 0.46±0.00 | 0.46±0.00 | 0.46±0.00 | 0.46±0.00 |
| Soaked | 0.48±0.00 | 0.48±0.00 | 0.48±0.00 | 0.48±0.00 | |
| ΔRa | 0.02±0.00abcd | 0.02±0.00bacd | 0.02±0.00cabd | 0.02±0.00dacb | |
| Volume (V)mm3 | Raw | 294.40±0.23 | 291.44±0.34 | 291.38±0.21 | 292.83±0.51 |
| Soaked | 354.97±0.20 | 347.78±0.46 | 346.38±0.21 | 352.23±0.45 | |
| ΔV (mm3) | 60.57±0.21ab | 56.33±0.41c | 54.99±0.20d | 59.40±0.47ba | |
| Surface area (S) mm2 | Raw | 11.14±0.02 | 11.08±0.03 | 11.05±0.01 | 11.11±0.06 |
| Soaked | 12.38±0.02 | 12.26±0.01 | 12.24±0.05 | 12.33±0.04 | |
| ΔS (mm2) | 1.24±0.02a | 1.22±0.03bc | 1.18±0.04d | 1.22±0.05cb |
Values are expressed as mean ± standard deviation. Means having different letters within the same row differ significantly at p ≤ 0.05 (n = 3). Δ denotes the differences in the respective dimensional parameter’s values.
Increase in thickness was uniform and ranged from 0.54±0.01 to 0.58±0.02. Spherecity (φ) and aspect ratio (Ra) did not vary significantly after soaking and showed uniformity among all groups. Shape of kidney bean plays an important role in the conformational changes during soaking. Volume of grains varied significantly after soaking and ranged from 54.99±0.20 to 60.57±0.21. Higher variation was observed in distilled water-soaked groups followed be MgCl2 (0.5%), NaOH (0.1%) and NaHCO3 (0.5%). Surface area (S) for the grains after soaking varied from 1.18±0.04 to 1.24±0.02. Higher variation was observed in distilled water followed by both MgCl2 (0.5%) and NaOH (0.1%), whereas NaHCO3 (0.5%) showed least variation. Variation in dimensional attributes as a result of moisture uptake were also reported in cowpea (Yalcin, 2007) and popcorn kernel (Karababa, 2006).
Germination analysis: Computational data for germination analysis was generated using Microsoft excel sheet described by Ranal et al. (2009), to observe the relative frequency of germination after soaking under different chemical stresses. Soaking affected the total germination percentage of the seed. Higher germination percentage was observed in distilled water-soaked grains (78%), followed by MgCl2 -0.5% (61%), NaHCO3-0.5% (58%) and NaOH-0.1% (56%) as shown in table 3. The results are contrary to the observation made by Tobe et al. (2004), where halophytes were considered. Relative frequency of germination (ƒi) increases with the time period and is dependent on the type of soaking medium used (Tobe et al. 2004).
From the above calculated data, germination indices were prepared to observe the overall impact of soaking medium on germination. Relative to distilled water-soaked grains, all other germinated groups have shown slightly lower value of germination indices. Vigor value of MgCl2 (0.5%) soaked kidney bean grains was higher and closely followed by distilled water and NaOH (0.1%) soaked grains. NaHCO3 (0.5%) soaked kidney bean grains has lower vigor value. The mean germination time (MT) for all groups was observed same (78.72 hours) except NaOH (0.1%) soaked grains (MT=78 hours), which inferred that slightly lesser time was required for germination in NaOH (0.1%) soaked grains.
Table 3. Analysis of germination data and germination indices of kidney bean after soaking in different soaking medium/solutions (NaOH-0.1%; NaHCO3-0.5%; MgCl2-0.5% and distilled water)
| NaOH (0.1%) | ||||||
| Time in days | No. of seed germinated (n) | n*t | t-MT | (t-MT)2 | n(t-MT)2 | (ƒi) |
| 1 | 2 | 2 | -1 | 1 | 2 | 0.0204 |
| 2 | 7 | 14 | 0 | 0 | 0 | 0.0714 |
| 3 | 22 | 66 | 1 | 1 | 22 | 0.224 |
| 4 | 25 | 100 | 2 | 4 | 100 | 0.2551 |
| Germination Indices | ||||||
| G (%) | V | MT | (ῡ) | CV | ||
| 56 | 34.08 | 78 | 0.31 | 0.46 | ||
| NaHCO3 (0.5%) | ||||||
| 1 | 2 | 2 | -1 | 1 | 2 | 0.0204 |
| 2 | 6 | 12 | 0 | 0 | 0 | 0.0612 |
| 3 | 24 | 72 | 1 | 1 | 24 | 0.2449 |
| 4 | 26 | 104 | 2 | 4 | 104 | 0.2653 |
| Germination Indices | ||||||
| G (%) | V | MT | (ῡ) | CV | ||
| 58 | 33.62 | 78.72 | 0.31 | 0.46 | ||
| MgCl2 (0.5%) | ||||||
| 1 | 4 | 4 | -1 | 1 | 4 | 0.0408 |
| 2 | 6 | 12 | 0 | 0 | 0 | 0.0612 |
| 3 | 20 | 60 | 1 | 1 | 20 | 0.2041 |
| 4 | 31 | 124 | 2 | 4 | 124 | 0.3163 |
| Germination Indices | ||||||
| G (%) | V | MT | (ῡ) | CV | ||
| 61 | 35.11 | 78.72 | 0.31 | 0.48 | ||
| Distilled water | ||||||
| 1 | 5 | 5 | -1 | 1 | 5 | 0.0510 |
| 2 | 4 | 8 | 0 | 0 | 0 | 0.0408 |
| 3 | 33 | 99 | 1 | 1 | 33 | 0.3367 |
| 4 | 36 | 144 | 2 | 4 | 144 | 0.3673 |
| Germination Indices | ||||||
| G (%) | V | MT | (ῡ) | CV | ||
| 78 | 34.62 | 78.72 | 0.30 | 0.47 | ||
Where t= time between sowing and the day of observation G=germination percentage, V=Vigor value, MT=mean germination time in hours, ῡ= Mean germination rate, CV=Coefficient of variation of germination
Mean germination rate (ῡ) was observed same in all cases (ῡ=0.30) with non-significant variation.
Coefficient of variation of germination time (CV) was observed higher in MgCl2 (0.5%) soaked grains followed by distilled water, NaOH (0.1%) and NaHCO3 (0.5%). According to the seed germination studies conducted by Pereira and Santana (2013) on different species of same family, the increased coefficient of variation is not capable of predicting the heterogeneity of variance, but the data can be used to monitor the germination capability of seed grains. In lab seed germination analysis also provide data to the various food production sections where seed germination is required viz breweries. Research has also shown the utilization of germinated grains in composite flours to enhance nutrition index of bakery products (Sibian et al. 2020).
CONCLUSION
Different chemical stresses exhibit different absorption and germination characteristics. The extent of soaking and rate of absorption can easily be estimated from Peleg’s mathematical equation. Ionic strength of solution has proven as detrimental factor to be considered during soaking. Soaking caused changes in the overall dimension of grains. Germination indices provided the detailed insight of germination process. It was also concluded from the obtained data, that germination indices of grains are independent from soaking kinetics. While the seed enables to attain saturation point by the uptake of optimum moisture, the seed will be enabled to germinate despite of the salt stress. However, germination percentage is greatly affected by the chemical stress. Mean germination rate and coefficient of variation of germination were found independent from germination percentage and mean germination time. It was observed that despite having significant difference in the germination percentage and vigor of different groups, there was similarity in some germination indices, which stated the importance of germination index over germination percentage and salt stress management in agriculture.
ACKNOWLEDGMENTS
The authors acknowledge Department of Food Engineering and Technology, Sant Longowal Institute of Engineering and Technology, Longowal for providing necessary infrastructure for this research work. No funds were received from any agency for this work.
Conflict of Interest: The authors declared no conflict of interest with respect to this manuscript.
Ethical Statement: This article does not contain any human and animal subjects for experiment.
REFERENCES
Ali, N.M.M., El-Tinay, A.H., Elkhalifa, A.O., Salih, O.A. and Yousif, N.E. (2009). Effect of alkaline pretreatment and cooking on protein fractions of a high-tannin sorghum cultivar. Food Chemistry, 114: 649-651.
Allen, G.J., Wyn-Jones, R.G. and Leigh, R.A. (1995). Sodium transport measured in plasma membrane vesicles isolated from wheat genotypes with differing K+/Na+ discrimination traits. Plant, Cell and Environment, 18: 105–115.
Azaizeh, H., Gunse, B. and Steudle, E. (1992). Effects of NaCl and CaCl2 on water transport across root cells of maize (Zea mays L.) seedlings. Plant Physiology, 99: 886–894.
Bewley, J.D. and Black, M. (1994). Seeds In: Physiology of development and germination (2nd edition), Plenum Press, New York.
Bolaji, O.T., Awonorin, S.O., Shittu, T.A. and Sanni, L.O. (2017). Changes induced by soaking period on the physical properties of maize in the production of Ogi. Cogent Food and Agriculture, 3:1323571. http://10.1080/23311932.2017.1323571
Bradbeer, J.W. (1988). Seed Dormancy and germination, Chapman and Hall, New York, pp-146.
Corzo, O. and Fuentes, A. (2004). Moisture sorption isotherms and modeling for pre-cooked flours of pigeon pea (Cajanus cajans L mill sp) and lima bean (Canavalia ensiformis). Journal of Food Engineering, 65: 443-448.
Cramer, G.R., Läuchli, A. and Polito, V.S. (1985). Displacement of Ca2+ by Na+ from the plasmalemma of root cells. A primary response to salt stress? Plant Physiology, 79: 207–211.
Dorneles, M.C., Ranal, M.A. and Santana, D.G. (2005). Germinação de diásporos de Myracrodruon urundeuva Allemão (Anacardiaceae) ocorrente no cerrado do Brasil Central. Revista Brasileira de Botânica, 28:399-408.
Duncan D.B. 1955. Multiple range and multiple F test. Biometrics, 11:1-42.
Edwards, T.I. (1932). Temperature relations of seed germination. Quarterly Review of Biology, 7: 428-443.
Jain, R.K. and Bal, S. (1997). Properties of pearl millet. Journal of Agriculture Engineering and Research, 66: 85-91.
Kamkar, B., Vakili, S. and Mirizadeh, A. (2009). Effect of salinity and temperature on germination of three millet varities in: Seed Science and Biotechnology, Global science books, 1-5.
Karababa, E. (2006). Physical properties of popcorn kernels. Journal of Food Engineering, 72: 100-107.
Mendoza-Sánchez, M., Guevara-González, R.G., Castaño-Tostado, E., Mercado-Silva, E.M., Acosta-Gallegos, J.A., Rocha-Guzmán, N.E., and Reynoso-Camacho, R. (2016). Effect of chemical stress on germination of cv Dalia bean (Phaseolus vularis L) as an alternative to increase antioxidant and nutraceutical compounds in sprouts. Food Chemistry, 212: 128-137.
Mohsenin, N.N. (1980). Physical properties of plant and animal materials. Gordon and Breach Science Publishers, New York.
Neumann, P.M., Azaizeh, H. and Leon, D. (1994). Hardening of root cell walls: a growth inhibitory response to salinity stress. Plant, Cell and Environment, 17: 303–309.
Peleg, M. (1988). An empirical model for the description of moisture sorption curves. Journal of Food Science, 53: 1216–1217.
Pereira V.J. and Santana, D.G. (2013). Coefficient of variation of normal seedlings obtained from the validation of methods for the seed germination testing of 20 species belonging to the family Fabaceae. Journal of Seed Science, 35: 161-170.
Prodanov, M., Sierra, I. and Vidal-valverde, C. (2004). Influence of soaking and cooking on the thiamin, riboflavin and niacin contents of legume. Food Chemistry, 84: 271-277.
Ranal, M.A., Gracia De Santana, D., Ferreira, W.R. and Mendes-Rodrigues, W. (2009). Calculating germination measurements and organizing spread sheets. Revista Brasilia Botany, 32: 849-855.
Rastogi, N.K., Angersbach, A., Niranjan, K., and Knorr, D. (2000). Rehydration kinetics of high-pressure pretreated and osmotically dehydrated pineapples. Journal of Food Science, 65: 838- 841.
Riss, P. and Bang-Olsen, K. (1991). Germination profile–A new term in malting barley analysis. In Proceedings 23rd European Brewery Convention. Lisabon, pp-100–108.
Sanju, N., Simal, S., Bon, J., and Mulet, A. (1999). Modelling of broccoli stems rehydration process. Journal of Food Engineering, 42: 27–31.
Sibian M.S and Riar C.S. (2020). Formulation and characterization of cookies prepared from the composite flour of germinated kidney bean, chickpea, and wheat. Legume Science, 1–12. https://doi.org/10.1002/leg3.42
Sibian, M.S., Saxena, D.C. and Riar, C.S. (2016). Effect of pre and post germination parameters on the chemical characteristics of Bengal gram (Cicer arietinum). LWT – Food Science and Technology, 65: 783–790.
Sibian, M.S., Saxena, D.C. and Riar, C.S. (2013). Study of absorption behavior, functional and pasting properties of pearl millet soaking under different chemical stresses. International Journal of Agriculture and Food Science Technology, 4: 347-352.
Tobe, K., Xiaoming, L. and Omasa, K. (2004). Effect of five different salts on seed germination and seedling growth of Haloxylon ammodendron (Chenopodiaceae). Seed Science Research, 14: 345-353.
Turhan, M., Sayar, S. and Gunasekaran, S. (2002). Application of Peleg model to study water absorption in chickpea during soaking. Journal of Food Science, 53: 153-159.
Yalcın, I. (2007). Physical properties of cowpea (Vigna sinensis L.). Journal of Food Engineering, 79: 57-62.
Zhu, J.K. (2016). Abiotic stress signaling and responses in plants. Cell, 167, 313–324. https://doi.org/10.1016/j.cell.2016.08.029

