Ekaterina Anatolievna Pozhidaeva1![]() , Evgeny Sergeevich Popov2
, Evgeny Sergeevich Popov2![]()
and Anton Vladimirovich Sadchenko3![]()
1Department of Technology of Animal Products, Voronezh State University of Engineering Technologies, Voronezh, Russia.
2Voronezh State University of Engineering Technologies, Voronezh, Russia.
3City Clinical Hospital named after S.I. Spasokukotsky Department of Health, Moscow, Moscow, Russia.
Corresponding author email: evgeny.s.popov2@gmail.com
Article Publishing History
Received: 16/03/2021
Accepted After Revision: 18/06/2021
The effective functioning of the body’s physiological systems is determined by the presence of essential substances, including macro- and trace elements, whose deficiency leads to various homeostasis disorders. In this regard, the development of new daily consumed foods with targeted corrective action on the human body’s nutritional status is an essential and urgent task. Fortification of curd products with biologically active substances of plant origin makes it possible to obtain economically widely available bio corrective food systems. The study objects were curd products with a 5% fat mass fraction without adding and with adding 20% plant composition based on flours made of walnut, sesame, and pumpkin seeds. The storage duration was 90 days at minus 20±2℃. Qualities and quantities of individual groups of high volatile compounds (HVC) in the equilibrium gas phase (EGP) over the samples of curd products were assessed using an odor analyzer “MAG-8” with the electronic nose (e-nose) methodology.
It was found that samples No. 1 and 2 are identical by more than 85% in quality of the EGP. The data obtained demonstrate the prevalence of common to curd products organoleptic characteristics, which are in line with traditional ones expected by the consumer. The composition and content of HVC in air samples over the test samples during the entire period of storage, determining the degree of rancidity of the fat fraction and being indicators of shelf life, were assessed. Based on the test data obtained, an information system for modeling and predicting the shelf life of curd food systems was developed. It includes input parameters – type of packaging, storage conditions (temperature and relative humidity of ambient air), and the plant component content. The output parameter is the area of the “visual imprint” of the maximum sensor signals in the EGP of the study sample assessing the total intensity of odor proportional to the concentration of HVC.
Vegetable Biocorrectors, Curd Products, Food Status, Odor Analyzer, Shelf Life.
Pozhidaeva E. A, Popov E. S, Sadchenko A. V . Quality Rating and Shelf-Life Prediction of Curd Products with Biocorrective Action . Biosc.Biotech.Res.Comm. 2021;14(2).
Pozhidaeva E. A, Popov E. S, Sadchenko A. V. Quality Rating and Shelf-Life Prediction of Curd Products with Biocorrective Action. Biosc.Biotech.Res.Comm. 2021;14(2). Available from: <a href=”https://bit.ly/2PXphit“>https://bit.ly/2PXphit</a>
Copyright © Pozhidaeva et al., This is an open access article distributed under the terms of the Creative Commons Attribution License (CC-BY) https://creativecommns.org/licenses/by/4.0/, which permits unrestricted use distribution and reproduction in any medium, provide the original author and source are credited.
NTRODUCTION
Adjusting the diet through the introduction of effective sources of vital biocorrective nutrients (mineral elements, vitamins, and other biologically active substances) into the list of ingredients of daily consumption is a pressing technological and nutritional challenge (Rodionova et al., 2016; Antipova et al., 2018; Eamonn, 2019; Bouillon, 2020).
The enrichment of curd products with biologically active substances opens up new possibilities of a directed positive biocorrective effect on various functions of the body to prevent and treat a wide range of diseases of nutritional nature (Dmitrieva, 2018). One of the most promising sources of biologically active substances and minerals of natural origin is partially defatted flours made of walnut, sesame, and pumpkin seeds (Yu et al., 2020). Walnut flour contains sphingolipids, phytosterols, phospholipids, carotenoids, and a high lysine level, thus accelerating the protein digestion process. It has an antineoplastic action (Rodionova, 2019; Donskaya and Drozhzhin, 2020).
Sesame seed flour is a valuable source of calcium and phosphorus and is recommended for treating osteoporosis, strengthening bones and tooth enamel, normalizing lipid metabolism, preventing atherosclerosis, hypertension, and arthritis (Donskaya and Drozhzhin, 2020). Pumpkin seed flour is a source of native proteins and contains a significant amount of dietary fiber, vitamins A, E, D, K, and B-group vitamins, essential amino acids, essential polyunsaturated fatty acids w-3 and w-6, sugars, phytosterols, organic acids, salts of phosphoric and silicic acids, macro- and trace elements, among which potassium, phosphorus, magnesium, sodium, and zinc should be highlighted (Antipova et al., 2018; Aydar et al., 2021).
The work aims to assess the storage stability and model the storage process of new curd and vegetable products using an e-nose system based on piezo sensors. The study objects were curd products with a 5% fat mass fraction without adding (sample No. 1, control) and with adding 20% functional plant composition based on partially defatted flours made of walnut, sesame, and pumpkin seeds (sample No. 2).
The plant composition formulation was balanced by the content of polyunsaturated fatty acids w-6 and w-3 (the ratio was 5.8:1) as a result of mathematical processing, using a developed software product implementing the object-oriented programming (software languages Ruby 2.2, Ruby on Rails 4.2) (Rodionova & Alekseeva, 2015; Liu et al., 2021). The study objects were stored for 90 days at minus 20±2°C.
MATERIAL AND METHODS
Scent research of test samples was carried out on a laboratory odor analyzer “MAG-8” with the e-nose methodology (Yu et al., 2020; Aydar et al., 2021). Eight sensors based on VAW-type piezoelectric quartz resonators with a reference oscillation frequency of 10.0 MHz with various film sorbents on the electrodes were used as a measuring array. Coatings were chosen according to the test task (possible emission from samples of different organic compound classes): sensor 1 – polyvinylpyrrolidone (PVP); sensor 2–bee glue (BG); sensor 3– dicyclohexano-18-crown-6 (DCH18C6); sensor 4–bromocresol green (BCG); sensor 5– polyethylene glycol succinate (PEGS); sensor 6 – polyethylene glycol PEG-2000 (PEG-2000); sensor 7–Tween-40 (Tween); sensor 8 – trioctylphosphinoxide (TOPO).
During experimental studies, test samples weighing 5.00 g were placed in glass samplers, sealed tightly, and incubated at room temperature (20±1°C) for at least 30 min to saturate the EGP over samples (Liu et al., 2021). 3 cm3 of EGP was taken through the membrane with individual syringes and injected into the detection cell. The sensor array background was from 15 to 30 Hz.s. The measurement duration was 60 s, the recording mode of sensor responses was uniform at 1 s intervals, and the measurement error was 5-10%.
The initial primary analytical information of the e-nose system is a chrono-periodogram. It is the piezo sensor output curve for the time of measuring the dependence of changes in each sensor oscillation frequency on time (figures from the device software). Further, the selective information of the chrono-periodograms is used for processing and decision making (Donskaya and Drozhzhin, 2020; Yu et al., 2020).
The sum analytical signal was formed using an integral signal processing algorithm of 8 sensors represented by a “visual imprint”. In order to determine the total odor composition of samples, full “visual imprints” of the maximums (the largest responses of 8 sensors) were used. “Visual imprints” of the maximums are constructed according to the maximum responses of the sensors in the EGP of samples during the measurement time (60 s).
They make it possible to establish the similarity and difference of the high volatile odor fraction composition over analyzed samples (Tan & Xu, 2020). The areas of the figures are calculated automatically in the device software. The “visual imprint” shape with characteristic distributions along the response axes, determined by the set of compounds in the RGF, was chosen as the criterion for qualitative assessment of the difference in the odor of the analyzed samples. Identification parameters Aij, calculated from the sensor signals in analyzed samples, were used to recognize individual classes of compounds in the mixture.
The quantitative characteristics were: 1) SΣ, Hz.s – the full “visual imprint” total area, evaluating the total intensity of the odor, proportional to the concentration of HVC, including water; it is built according to all signals of all sensors for the full measurement time; 2) the maximum signals of sensors with the most active or specific sorbent films ΔFmax, Hz to assess the content of individual classes of organic compounds in the EGP by rationing method (Yu et al., 2020; Liu et al., 2021). The sensor responses were recorded, processed, and compared in the analyzer “MAG Soft” software.
RESULTS AND DISCUSSION
With the aim to solve the set task, the changes in the e-nose responses in time for test samples are monitored. In order to establish the differences in the composition and content of HVC in the EGP over samples of curd products, the primary e-nose information – the response values of the selected sensors in the array and the value of the quantitative integrated e-nose signal – the “visual imprint” area of the maximum responses is compared (Table 1).
Table 1. Average sensor responses (±1 Hz) and “visual imprint” area of sensor signals in the EGP over samples (SΣ ± 30, Hz.s)
| Sample No. | S1 – PVP | S2 – BG | S3 – DCH18C6 | S4 – BCG | S5 – PEGS | S6 –
PEG-2000 |
S7 – Tween | S8 – TOPO | SΣ, Hz.s |
| 1 | 23 | 5 | 11 | 5 | 10 | 9 | 14 | 10 | 304 |
| 2 | 23 | 5 | 14 | 5 | 12 | 9 | 16 | 9 | 324 |
Odor intensity difference of samples without and with the introduction of a functional plant composition is 6.6%, and it is not significant (Sidnyaev, 2018). In order to establish subtle differences in quality and quantity of the high volatile odor fraction of samples studied, the change in the total content of HVC in the EGP over the samples is monitored (Figure 1). According to the shape of the “visual imprint” figure of the sensors’ responses in the array, no critical differences in all points in the EGP chemical composition over the samples are found out.
Figure 1: “Visual imprints” of maximum sensor signals in the EGP over samples No. 1 (a), No. 2 (b); comparison of samples No. 1 and 2 (c) (On the circular axis – numbers of sensors in the array, on the vertical axis – maximum sensor responses at a certain point of measurement (ΔFmax, Hz).
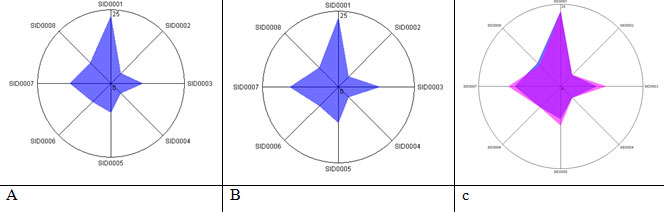
It is found that the “visual imprint” area of the maximum sensor signals in the EGP over sample No. 1 was 304.41 Hz.s, No. 2 – 324.56 Hz.s, and the absolute difference between the areas – 20.15 Hz.s.
The air quantitative composition changes (assessed by the normalization method) over the studied samples are traced then by the content ratio of the major HVC classes, for which the sensor array is tuned (Table 2).
Table 2. The content ratio of components in samples, ω (±0.5) % wt.
| Medium,
sample No. |
S1 – PVP | S2 –
BG |
S3 – DCH18C6 | S4 – BCG | S5 – PEGS | S6 –
PEG-2000 |
S7 – Tween | S8 – TOPO |
| Water | Alcohols, ketones, | Alcohols, ketones, acids | Nitrogenous bases | Amines, ketones | Alcohols, acids | Acids | Aromatic, sulfur-containing | |
| 1 | 26.4 | 5.7 | 12.6 | 5.7 | 11.5 | 10.3 | 16.1 | 11.5 |
| 2 | 24.7 | 5.4 | 15.1 | 5.4 | 12.9 | 9.7 | 17.2 | 9.7 |
Table 2 shows that samples No. 2 and No. 1 differ in the content of the major classes of organic compounds. It confirms the change in both quality and quantity of the high volatile fraction of the odor samples. Thus, slightly high content of nitrogen-containing compounds, acids, alcohols, and ketones, and low content of water and specific aromatic compounds are fixed in the EGP over sample No. 2. However, such changes in the content indicate only a redistribution of the HVC of test samples instead of new groups of compounds that may appear due to the introduction of a functional plant composition (Yu et al., 2020; Aydar et al., 2021).
The parameter Аi/j, which shows the ratio constancy of concentrations of HVC separate classes in the EGP (Table 3), helps to monitor changes in the EGP quality over samples and the appearance or disappearance of HVC fraction.
Table 3. Ratio of signals of several sensors in the matrix for the test samples
| Sample No. | Odor stability-indicating parameter Аi/j | |||||
| Tween/
PVP |
BG/
PEG-2000 |
BCG/
PEGS |
DCH18C6/
Tween |
TOPO/
PVP |
TOPO/
DCH18C6 |
|
| 1 | 0.61 | 0.56 | 0.50 | 0.79 | 0.43 | 0.91 |
| 2 | 0.70 | 0.56 | 0.42 | 0.88 | 0.39 | 0.64 |
If the parameters Аi/j, criteria of odor stability, are close or coincide for compared samples, then the content ratio of these groups of compounds in the samples is the same. If the ratio of the signals differs from such for the samples, the concentration ratio of these groups is different against the corresponding standard (Table 3). If more than 40% of parameters (3-4 parameters out of 7 selected) significantly change, then in the odor samples there are significant quality changes – groups of HVC appear or disappear, which with high probability are recorded in the organoleptic assessment of consumers and tasters (narrative descriptors and a score for the intensity of standard descriptors change) (Yu et al., 2020; Aydar et al., 2021).
It was found out that samples No. 1 and 2 are identical by more than 85% in quality of the EGP. Higher content of alcohols, acids, and a smaller number of sulfur-containing compounds is fixed in sample No. 2 that is consistent with the quantitative composition. It can be stated for sample No. 2 a decrease in the odor of the compounds reinforcing assessments of negative descriptors (e.g., “bitter,” “rancid,” “another”).
The next step in the experimental studies was to assess the composition and content of HVC in air samples over test samples of curd products during the entire period of storage, which determines the rancidity degree of the fat fraction and are indicators of shelf life. Based on the experimental data obtained, an information system for modeling and predicting the shelf life of curd food systems was developed.
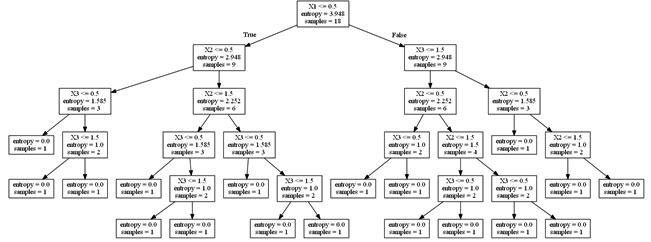
It includes input parameters – a type of packaging (presence/absence of vacuum packaging, X1); storage conditions (temperature and relative humidity of ambient air, X2); content of plant component, X3) and output parameter – a value of quantitative integrated signal of an array of eight mass-sensitive piezo sensors (Y) (Python 3.6 software language) (Rodionova 2019; Donskaya and Drozhzhin, 2020). For modeling the storage process and visualizing the experimental dependencies, a machine learning method, the solver tree, was used (Figure 2).
Figure 2: Basic diagram of information system organization for modeling and predicting the shelf life of curd food systems
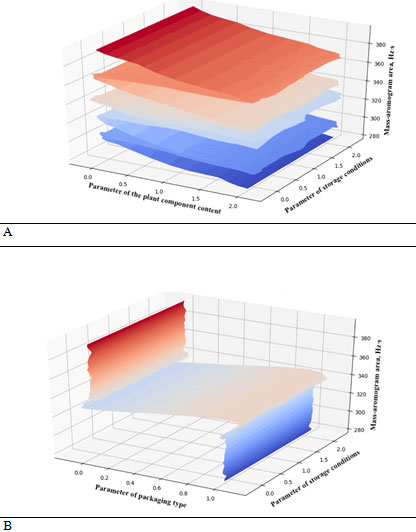
The software result is a graphical display of three-dimensional dependencies of the mass-aromogram area on the storage conditions, plant component content, and type of packaging. Figure 3 shows the software result on the example of the dependencies Y (Х2, Х3) and Y (Х1, Х2). The developed mathematical model makes it possible to obtain, with high precision, the values of the “visual imprint” area of the maximum sensor signals assessing the total odor intensity proportional to the concentration of HVC in the EGP of the study sample depending on specific conditions – a type of packaging, temperature and relative humidity of the ambient air, the content of the plant component, and also to plan storage regimes in the controlled environments.
Figure 3: The software results represented by three-dimensional dependences of the mass- aromogram areas on storage conditions and the plant component content (a); packaging type and storage conditions (b)
CONCLUSION
As a result of the scientific and technological research, the ingredient composition and expediency of using vegetable biocorrectors that generate deficient vitamins, macro- and trace elements, dietary fiber, and expand the range of fermented-milk food systems of functional action has been substantiated. Analysis of components and quantities of HVC in the EGP over test samples, carried out using a complex of sensitive piezo sensors of the odor analyzer, has shown that the introduction of functional plant composition does not have a significant effect on organoleptic parameters of curd products. Application of piezo sensory analysis made it possible to predict the shelf life of curd semi-finished products based on the assessment of composition and content of HVC in air samples over test samples during storage, determining the rancidity degree of the fat fraction.
ACKNOWLEDGEMENTS
This work was supported by a grant from the President of the Russian Federation (registration number MD-5536.2021.5).
Conflict of interests: there is no conflict of interest.
REFERENCES
Antipova LV, Rodionova NS and Popov ES (2019). Trends in the scientific foundations’ development of food product design. Proceedings of the Higher Educational Institutions. Food Technology, No. 1, pp. 8-10.
Aydar AY, Mataracı CE and Sağlam TB (2021). Development and modeling of a novel plant-based yoghurt produced by Jerusalem artichoke and almond milk using l-optimal mixture design. Journal of Food Measurement and Characterization, pp 1-9.
Bouillon R (2020). Nutritional rickets: Historic overview and plan for worldwide eradication. The Journal of Steroid Biochemistry and Molecular Biology. Vol 198 pp 105-115.
Dmitrieva IE (2018). Process design of synbiotic fermented dairy product. Bulletin of Modern Research. Vol 4 No 2 pp 12-14.
Donskaya GA and Drozhzhin VM (2020). Biologically active ingredients in fermented dairy products. Milk Processing, Vol 249 No 7 pp 20-23.
Eamonn MM (2019). Prebiotics and Probiotics in Digestive Health. Clinical Gastroenterology and Hepatology. -Vol. Vol 17 No 2 pp 333-344.
Liu T, Li D and Chen J (2021). An active method of online drift-calibration-sample formation for an electronic nose. Measurement. No 171 pp 1-10.
Rodionova NS, Popov ES and Sokolova OA (2016). Nutrient correctors of nutritional status based on products of deep processing of low-oil raw materials: Monograph. Voronezh: Voronezh State University of Engineering Technology, pp-240.
Rodionova NS and Alekseeva TV (2015). Food technology of PUFA balanced composition: Monograph. Voronezh: Voronezh State University of Engineering Technology, pp-257.
Rodionova NS (2019). Alimentary factors for the correction of nutritional status and physiological conditions. Proceedings of the 1st International Symposium Innovations in Life Sciences, Published by Atlantis Press. Vol 7 pp 262-265.
Sidnyaev NI (2018). Theory of experiment planning and statistical data analysis. Textbook and practicum (2nd rev. ed.). Ser. 76. Higher education. Moscow: Yurait Publishing House, pp-495.
Tan J and Xu J (2020). Applications of electronic nose (e-nose) and electronic tongue (e-tongue) in food quality-related properties determination: A review. Artificial Intelligence in Agriculture. Vol 4 pp. 104-115.
Yu B, Yu H and Chen C (2020). Evaluation of the synergistic olfactory effects of diacetyl, acetaldehyde, and acetoin in a yogurt matrix using odor threshold, aroma intensity, and electronic nose analyses. Journal of Dairy Science. Vol 103 pp. 7957-7967.

