Department of Electronics and Communication Engineering, M. Kumarasamy College of Engineering, Karur, Tamilnadu, India
Corresponding author Email: manikandanm.ece@mkce.ac.in
Article Publishing History
Received: 22/12/2018
Accepted After Revision: 22/02/2019
In the modern world the technology is growing day by day and at the same time the biological pathology is also growing in a proportional rate, where women are diagnosed more than men for various types of dreadful cancers like the breast and ovarian. The technology will never fail to address the biomedical aspects including a specific diagnosis. In this communication, we have tried to present our approach towards a possible early detection of breast cancer using mammogram image in 3 dimensional views. The purpose of the presently proposed analysis is to recognize the level of calcification or calcification deposits in breast tissues. Usual method for the image analysis is preprocessing followed by segmented results. In this paper we propose to develop the traditional mechanisms with Graphical User Interface, in order to estimate the level of the calcification formed in the breast tissue content, which can become an easy way of diagnosis, thus using a 3D analysis as one of the easiest ways for precise future analysis and early treatment of breast cancer, which can save the lives of many women.
Mammogram, Preprocessing, 3d, Calcification, Gui, Canny Edge Detector
Manikandan M, Nithya A. Proposed Model for the Detection of Breast Cancer Using Mammogram Images. Biosc.Biotech.Res.Comm. 2019;12 (1).
Manikandan M, Nithya A. Proposed Model for the Detection of Breast Cancer Using Mammogram Images. Biosc.Biotech.Res.Comm. 2019;12(1). Available from: https://bit.ly/2WbUpHP
Copyright © Manikandan and Nithya, This is an open access article distributed under the terms of the Creative Commons Attribution License (CC-BY) https://creativecommns.org/licenses/by/4.0/, which permits unrestricted use distribution and reproduction in any medium, provide the original author and source are credited.
Introduction
Bosom Tomosynthesis or 3D mammography is the most recent development in advanced mammography (Mohanapriya et al. 2013). The favorable circumstances over customary mammography comprise of better tumor location at a prior arena and less go back break for extra pictures and consequently less nervousness and more noteworthy practicality for ladies experiencing mammography (Sukanesh et al. 2010b). 3D mammography is basically like conventional 2D mammography from various perspective (Vijayprasath et al. 2012). The machine appears to be identical and each bosom has pictures taken in two positions (Dinesh et al. 2015a). Be that as it may, rather than taking a solitary picture while the bosom is compacted, every 3D picture is a 4-second sweep of the bosom. These outcomes in a progression of 1 mm thick pictures or cuts of the bosom (Dinesh et al. 2015b). There are roughly 50 picture cuts for each position. This enables the radiologist to see the bosom at different points and to isolate covering typical tissue that can appear like growth or make tumor hard to distinguish on a conventional mammogram (Sukanesh et al. 2010a). Consider it similar to a volume when you glance down at the book, everything you can see is the cover. This resembles customary mammography. Be that as it may, you can see every one of the pages (Dhivya et al. 2018). This resembles 3D mammography. The 3D check likewise creates an extra picture that resembles a customary mammogram, or, in other words combination with the picture cuts and can be contrasted and your earlier mammograms (Manikandan et al. 2014). The emission dose from a 2D mammogram image and a 3D scan is almost the identical (Kavitha et al. 2017).
Earlier, data have been provided with the details of using sensitive markers for the detection of myocardial deformation, where strained cardiac rates were measured in left ventricle before the measure of the general parameters like left ventricle ejection, fractions in breast cancer also forms the mammogram imaging sequences (Keerthi et al. 2017). In addition, the use of 3 Dimensional echocardiography as a more susceptible and reproducible calculation of left ventricle ejection fraction was not consistent to distinguish these changes (Shapiro et al. 1982). Left ventricular ejection fraction was calculated by 2 and 3 dimensional echocardiography, and myocardial twist was evaluated by means of tissue Doppler imaging and 2D based injures and strain rate. Revolutionized over- time was measured up to every 3 months as reported by Manikandan et al. (2018).
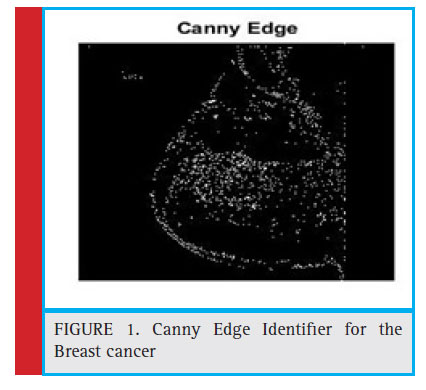 |
Figure 1: Canny Edge Identifier for the Breast cancer |
In various imaging laboratories, mammography is an important testing aid for breast cancer identification, combined with reference data which results from the other estimations, (Rajan 2014). The mechanism for breast cancer in dark breast parenchyma is not fast developed due to the masking of real time cancers that are rejected on testing mammograms (Sukanesh et al. 2013). These discoveries additionally recommend that the option of mammographic screening in patients with thick bosom parenchyma is likely not to increment analytic yield in the identification of bosom growths, (Rajan 2015a). In the previous work, the detection of the cancer from the mammogram image using the canny edge vector was identified and shown in the fi gure 1. From this extraction the cancer level was further identified (Rajan et al. 2013a). Here we have discussed the same for the The proposed methods have the ability to get the input image, and then it will be taken into preprocessing techniques(Rajan et al. 2015d). The preprocessing technique involves the conversion of the gray scale domain form the RGB domain. In order to satisfies the exact analysis of the cancer detection, (Rajan 2015c). Followed by the filtering methods. The role of the fi lters is to remove the unwanted noise in the input image and the unwanted transition may present during the RGB to Gray scale conversion (Rajan et al. 2013b). The third Role in the method is to segment the state of significance form the filtered image. All process put in the single module is the way in which to create the GUI(Graphical User Interface). Parameters have to select in such way to identify the appropriate region of interest, (Rajan et al. 2015e).
The estimated parameters are as follows: Growing: 0.1 Per Gray, Noise Level: 0.9 Per Gray, Cut Level: 0.0.5 Per Gray N Volume: 2. After carrying out the preprocessing, the post processing will be evaluated. The evaluation will be done with the segmented region in to the segmented volume (Rajan et al. 2012). On the other hand genetic algorithm with various clustering has been used for the cancer detection for breast cancer form mammogram image. Here comes the discussion about various clusters with best and mean fitness of the mammogram inputs. The following table shows the same.
Furthermore the sample cluster and their representation are show below. Here we have discussed the result of the breast cancer detection from the mammogram image sequences in 3 dimensional views. The GUI was loaded to observe the input sequence and the input image was displayed in the input panel.
After displaying the input mammogram image in the GUI tool, then set the parameters have been discussed in the section II. Select the region which will cover the region of the interest.
Selection of ROI is done then the segmentation will be estimated. Segmented ROI is evaluated in two ways.
The extracted areas are needed to be highlighted with the help of GUI for the accurate computation of cancer cell,as well as estimation of distribution of cancer cells in mammogram.
Finally with the help of all relevant source and findings to develop the 3 dimensional projections the cancer affected areas. That will help to the doctors to examination the root and cause of the cancer in breast.
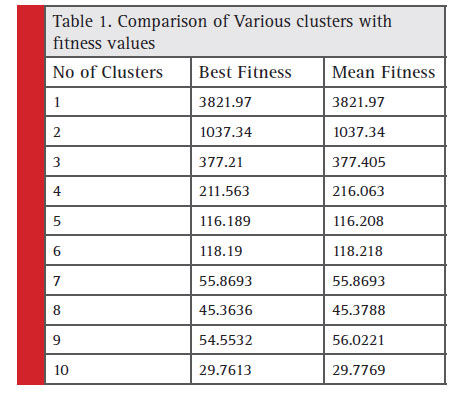 |
Table 1: Comparison of Various clusters with fitness values |
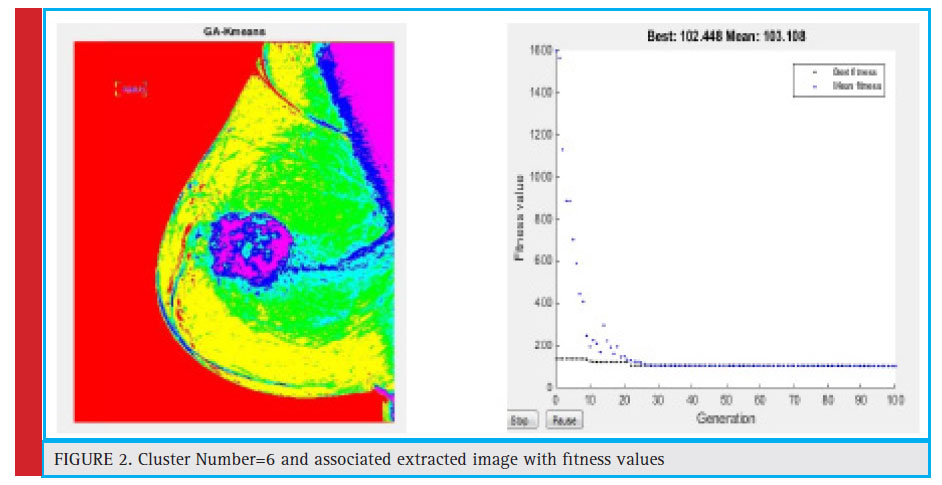 |
Figure 2: Cluster Number=6 and associated extracted image with fitness values |
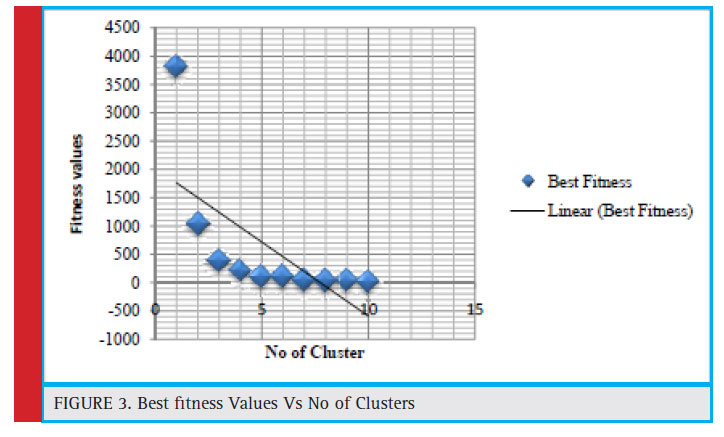 |
Figure 3: Best fitness Values Vs No of Clusters |
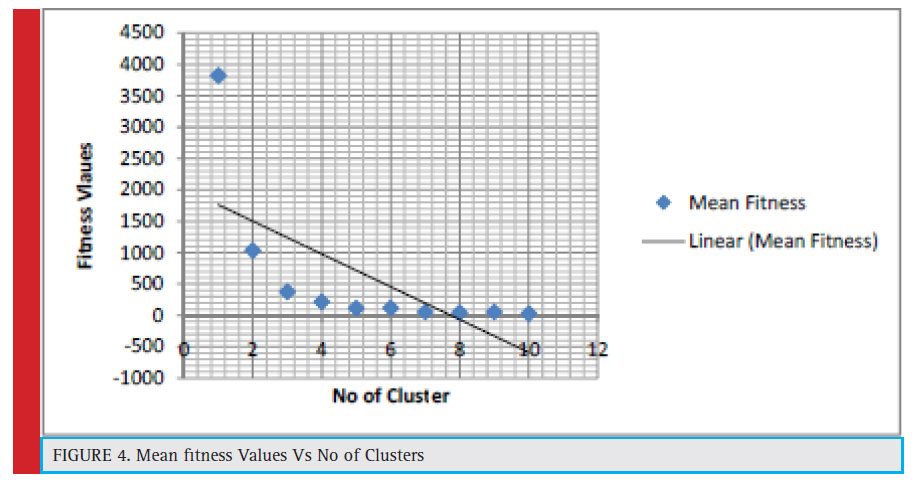 |
Figure 4: Mean fitness Values Vs No of Clusters |
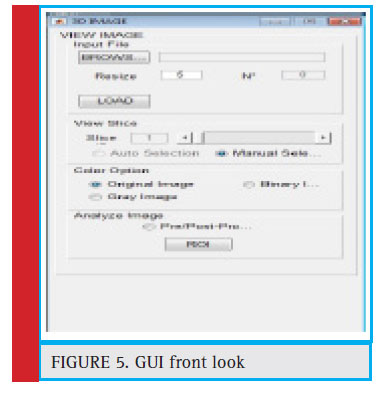 |
Figure 5: GUI front look |
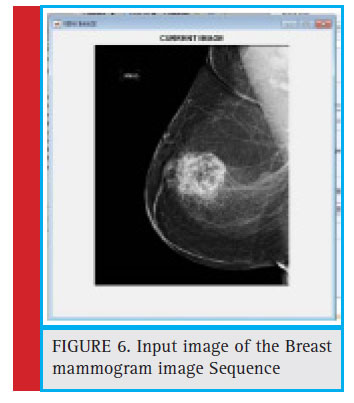 |
Figure 6: Input image of the Breast mammogram image Sequence |
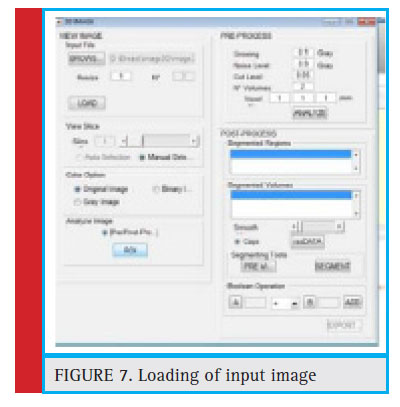 |
Figure 7: Loading of input image |
In existing systems there are more complex mathematical calculations that are used and it is very difficult to understand for the users. There is more complexity to provide the accurate results in the specified areas and also there may be chance to show many false images which may not be actually affected by cancer cells. Canny edge detector can estimate the amount of affected cells. These algorithms are used to find the segmented regions accurately and it is very useful to find the different stages of patients. Early stage of a person can be cured easily and if a patient is affected severely immediate action should be needed. Another method for estimation of the breast cancer is Genetic Algorithm with suitable fitness values, population identity, stand ard mutation procedures are evaluated. And the results were discussed but the accurate examination was not up to the level. The added way of the existing methods is 3 Dimensional of projection of cancer identified areas. This gives easy for the doctors to examine the cancer patient in easiest way. Further this can be improved by the help of 3 dimensional projection will able to answer the root cause and correspondence of cancer tissues, this may be described in medical terms a diagnostic need to be studied in future.
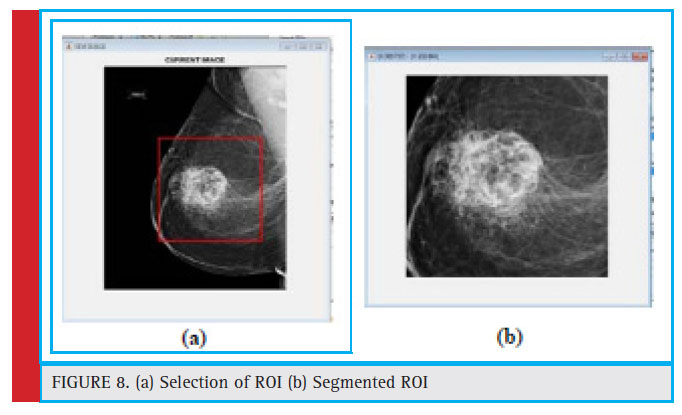 |
Figure 8: (a) Selection of ROI (b) Segmented ROI |
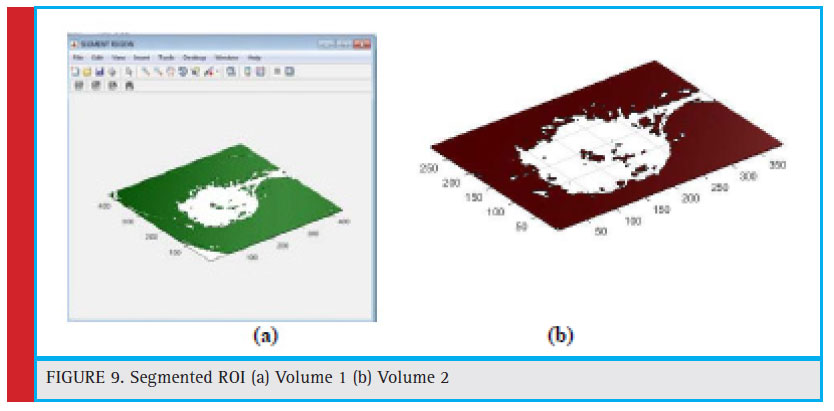 |
Figure 9: Segmented ROI (a) Volume 1 (b) Volume 2 |
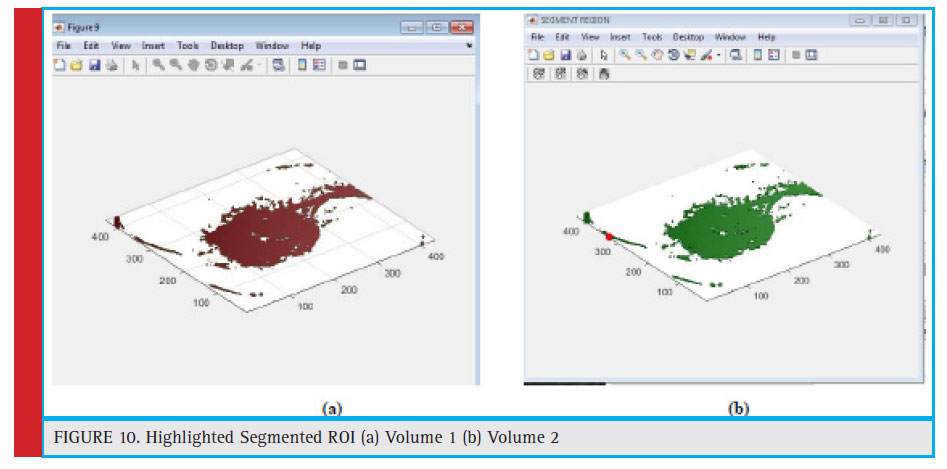 |
Figure 10: Highlighted Segmented ROI (a) Volume 1 (b) Volume 2 |
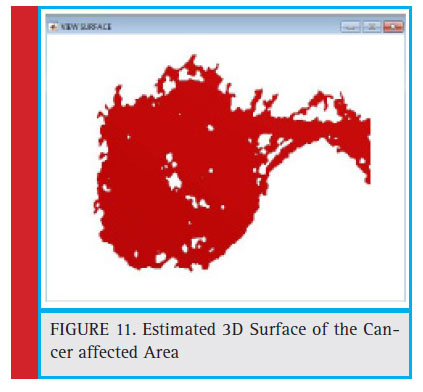 |
Figure 11: Estimated 3D Surface of the Cancer affected Area |
References
Dengler J, Behrens S, Desaga JF(1993) Segmentation of micro calcifications in mammograms. IEEE Transactions on Medical Imaging. 1993, 12 (4), pp. 634-642.
Dhivya, Nithya, Abirami, (2018) Mamogram Image Classifi cation Using Extreme Learning Machine”, Indian Journal of Science and Technology, 11 (17), pp.1-4.
Dinesh T, Palanivel S (2015a) Statistical Investigation of EEG Based Abnormal Fatigue Detection using LabVIEW. International Journal of Applied Engineering Research 10(43): Pages 30426-30431.
Dinesh T, Palanivel S (2015b) Systematic Review on Wearable Driver Vigilance System with Future Research Directions. International Journal of Applied Engineering Research 2(2):Pages 627-632.
Kavitha V, PalanivelRajan S (2017) Diagnosis of Cardiovascular Diseases using Retinal Images through Vessel Segmentation Graph. Current Medical Imaging Reviews 13(4).
Keerthi S, Dhivya S (2017) Comparison of RVM and SVM Classifier Performance in Analysing the Tuberculosis in Chest X Ray. International Journal of Control theory and Applications 10(36): Pages 269-276.
Manikandan M, Prabakar S (2014) Active Cardiac Model and its Application on Structure Revealing from Fetal Ultrasound Sequence. International Journal of Engineering Research and General Science. (2014), 2 (4), pp. 6-11.
Manikandan, Paranthaman, Neeththi Aadithiya, (2018), Detection of Calcification form Mammogram Image using Canny Edge Detector Indian Journal of Science and Technology, Vol 11(20).
Mohanapriya S, Vadivel M (2013) Automatic retrival of MRI brain image using multiqueries system. International Conference on Information Communication and Embedded Systems (ICICES): Pages 1099-1103.
PalanivelRajan S (2014) A Signifi cant and Vital Glance on Stress and Fitness Monitoring Embedded on a Modern Telematics Platform. Telemedicine and e-Health Journal 20(8): Pages 757-758.
PalanivelRajan S (2015a) Review and Investigations on Future Research Directions of Mobile Based Tele care System for Cardiac Surveillance. Journal of Applied Research and Technology 13(4): Pages 454-460.
PalaniveRajan S, (2015c) Review and Investigations on Future Research Directions of Mobile Based Telecare System for Cardiac Surveillance Journal of Applied Research and Technology, ISSN No.: 1665–6423, 13(4), pp. 454- 460.
PalanivelRajan S,(2015b) Visual and tag-based social image search based on hypergraph ranking method IEEE Digital Library Xplore, ISBN : 978-1-4799-3835-3, INSPEC Accession Number : 14916051, DOI : 10.1109/ICICES.2014.7034079.
PalanivelRajan S, Sheik Davood, (2015d) Performance evaluation on automatic follicles detection in the ovary”, International Journal of Applied Engineering Research, 10(55), pp.1-5.
Rajan S P, Sukanesh R (2013a) Viable Investigations and Real Time Recitation of Enhanced ECG Based Cardiac Tele-Monitoring System for Home-Care Applications: A Systematic Evaluation. Telemedicine and e-Health Journal 19(4): Pages 278-286.
Rajan S P, Sukanesh R, Vijayprasath S (2012) Performance Evaluation of Mobile Phone Radiation Minimization through Characteristic Impedance Measurement for Health-Care Applications. IEEE Digital Library Xplore.
Rajan S P, Vijayprasath S (2015e) Performance Investigation of an Implicit Instrumentation Tool for Deadened Patients Using Common Eye Developments as a Paradigm. International Journal of Applied Engineering Research 10(1): Pages 925-929.
Palanivel S Rajan, R.Sukanesh, (2013b) Experimental Studies on Intelligent, Wearable and Automated Wireless Mobile Tele-Alert System for Continuous Cardiac Surveillance Journal of Applied Research and Technology, ELSEVIER, ISSN No.: 1665–6423, Vol. No. 11, Issue No.: 1, pp.133-143, (2013).
Shapiro S, Venet W, Strax P, Venet L, Roeser R (1982). Ten to 14-year effect of screening on breast cancer mortality. J Natl Cancer Inst 1982;69: 349-55.
Sukanesh R, Gautham P, Rajan S P, Vijayprasath S (2010a) Cellular Phone based Biomedical System for Health Care. IEEE Digital Library Xplore: Pages 550-553.
Sukanesh R, PalanivelRajan S (2013) Experimental Studies on Intelligent, Wearable and Automated Wireless Mobile Tele-Alert System for Continuous Cardiac Surveillance. Journal of Applied Research and Technology 11(1): Pages 133-143.
Sukanesh R, Rajan S P, Vijayprasath S (2010b) Intelligent Wireless Mobile Patient Monitoring System. IEEE Digital Library Xplore: Pages 540-543.
Vijayprasath S, Sukanesh R, Rajan S P (2012) Experimental Explorations on EOG Signal Processing for Real Time Applications in LabVIEW. IEEE Digital Library Xplore.

