1Indian Institute of Technology, Kharagpur-721302 (WB), India.
2Mahatma Phule Krishi Vidyapeeth, Rahuri- 413722 (MS),India.
3Jawaharlal Nehru Krishi Vishwa Vidyalaya, Jabalpur – 482004 (MP),India.
Corresponding author email: er.ashutoshchavan@gmail.com
Article Publishing History
Received: 13/02/2020
Accepted After Revision: 21/03/2020
The effect of different pre-milling treatments on dehulling fractions, dehulling efficiency and dehulling loss were studied using CIPHET mini dhal mill. Pre-milling trials were conducted using different levels of oil (0%, 0.3% and 0.5%) and water treatments (0%, 25% and 50%) on pigeon pea. Response surface method based on a single factor and three-level design was used to study the effect of the independent variables and to optimize process conditions. Overall best values of dehulling fractions and parameters were observed for 50% water treatment which was found similar to the predicted data.
Dehulling Efficiency; Dehulling Fractions; Dehulling Loss;Pre-milling Treatment
Chavan A. N, Bhagat A. D, Tiwari V. K. Optimization of Pre-Milling Treatments for Pigeon Pea Dhal Recovery using CIPHET Mini Dhal Mill. Biosc.Biotech.Res.Comm. 2020;13(1).
Chavan A. N, Bhagat A. D, Tiwari V. K. Optimization of Pre-Milling Treatments for Pigeon Pea Dhal Recovery using CIPHET Mini Dhal Mill. Biosc.Biotech.Res.Comm. 2020;13(1). Available from: https://bit.ly/2THKbBB
Copyright © Chavan et al., This is an open access article distributed under the terms of the Creative Commons Attribution License (CC-BY) https://creativecommons.org/licenses/by/4.0/, which permits unrestricted use distribution and reproduction in any medium, provide the original author and source are credited.
INTRODUCTION
India stands top in worldwide pulse production as well as for its highest consumption. Pigeon pea (Cajanas cajan L.)is one of the highly produced and consumed pulses throughout India after chickpea and pea. Pulses have an essential role in human nutrition and are found more prevalent in vegetarian people diet as one of the major protein sources (Anon, 1984). The Annual production of total pulses in India in 2017-2018 was 25.23 Million MT from which Pigeon pea accounts for4.25 Million MT and in 2018-19 it is estimated around 3.68 Million MT (DES, DAC Report; 2017-18 & 2ndAdv Est for 2018-19).The per capita availability of pulses was approximately 35g as against the requirement of 70g per day as per the recommended dietary allowances (Roy et al., 2017).
Generally, pulses are consumed in India after being converted into dhal, the dehulled splits. It is estimated that about 80% of pulses produced in the country are converted to dhal (Deshpande, 1990 and Tiwari et al., 2017).The recovery of dhal varies from 60 to 75%, depending upon the type of pulses and techniques adopted by the millers such as methods of pre-milling treatment and milling machinery used (Chavan et al., 1983; Deshpande et al., 2007&Jennifer et al., 2011). Dehulling is the most crucial operation of post-harvest handling of pulses. The removal of the seed coat is imperative because it is indigestible and bitter. Since in most of the pulses, husk is tightly attached with cotyledons, (Kulkarni, 2002; Gupta, 2013);therefore, a pre-treatment before milling is desirable for loosening seed coats.
Singh and Ilyas (1994) and Chunilal (2017) reviewed the various pre-treatments used in pigeon pea. Edible oil treatment (up to 1%) is used in commercial mills to loosen the husk of pulses that are difficult to mill (Singh, 1995; Sokhansanj & Patil, 2003). Tiwari et al. (2007) observed an 85.5% dehusking loss and a 6.98%powdering loss in black gram at 0.8% oil treatment with 90°Cdrying temperature. Erskine studied the effect of seed size and different pre-treatments on splitting and dehulling of lentil (Lens culinaris) and reported that dehulling efficiency was highest with low seed moisture content, (Phirke & Bhole, 1999; Wang, 2005). Kurien (1968) investigated that dehulling of pigeon pea can be rendered easier by prolonged soaking in water for 12hours or more, but the dhal so obtained remains uncooked and tough even with prolonged boiling. Hence, it is necessary to optimise the oil treatment of pigeon pea to enhance recovery (Phirke & Bhole, 1999). Therefore the present study was undertaken to study milling characteristics for the CIPHET dhal mill for dehulling of pigeon pea using different pre-treatments.
MATERIALS AND METHODS
Raw material: Pigeon pea grains (Variety: Pigeon pea-407) used in the study were obtained from the agro-processing Centre of Central Institute of Post Harvest Engineering and Technology (CIPHET) Ludhiana.
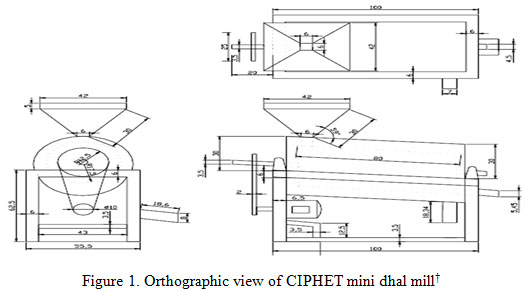
Equipments used: Experiments were conducted using CIPHET developed mini dhal mill at Food Grain & Oil Processing Division, CIPHET, Ludhiana which has overall dimensions of 1000 mm × 555 mm × 1225 mm, abrasive circle surface perimeter of 1100 mm and feed rate capacity of 100 kg/h. It was driven by 3 hp electric motor rotating at 1580 rpm speed, and dhal mill shaft rotates at 615 rpm. In this machine, all three carborundum materials were laminated on a single roller, and two stoppers were provided on the screen to increase the retention time of pigeon pea (Sahay&Bisht, 1988; Mangaraj et al. 2004).
Figure 1. Orthographic view of CIPHET mini dhal mill
Sample Preparation: Cleaning, Destoning & Moisture measurement: As per the conventional method of milling, cleaning of grains was done by using pedal cum power operated grain cleaner with 500-800 kg/h capacity in agro-processing centre of CIPHET, Ludhiana. Further separation of stones, pebbles, soil particles were done by using Destoner of capacity 100-200 kg/h. After cleaning and grading of pigeon pea grains, the moisture content of the grain was determined using the hot air oven drying method (AOAC, 2000).
Pre-milling treatments: Pre-milling trials were conducted on pigeon pea using different levels of refined soybean oil (0%, 0.3% and 0.5%) and by using water (0%, 25% and 50%). Total 18 experiments were run each having an equal sample size of 2 kg.
In the case of water pre-treatment, grain was finally dried to 8% and 12%moisture content on a wet basis for 25% and 50% water treatment respectively. After addition of water, grains were kept in airtight plastic containers for 12hours conditioning. The reduction of moisture content to the desired level was achieved by the conventional method of drying, i.e. by sun-drying (Mazza & Campbell, 1985;Ante et al., 2014). While in case of oil treatment, refined soya bean oil of 0.3% and 0.5% (v/w) was added to pigeon pea samples, and the grains were mixed thoroughly to ensure all grains were uniformly coated. The oil pre-treated grains were also heaped in airtight plastic containers for 36hours for tempering (Sokhansanj & Patil, 2003; Hiregoudar, 2014).
Drying: The pre-treated pulses were then dried in open sunlight to the desired moisture content of 9-10% (d.b) (Kurien and Parpia, 1968; Kurien, 1981;Goyal et al., 2008).
Milling: Based on preliminary trials conducted at CIPHET and optimization of milling time for dehulling pigeon pea, 12 seconds residence time was observed to be optimum. So, a complete unit for dehulling pigeon pea grain has been developed taking residence time as one of the design parameters.Thus after pretreatment, grains were milled using CIPHET dhal mill(as described above)& fractional analysis was carried out to study the effect of pre-treatment on the recovery of quality dhal. Various fractions such as dehulled grains i.e. dhal, partially dehulled grains, unhusked grains, husk and chuni were obtained, which through manual sorting weighted separately to find out the total recovery of dhal.
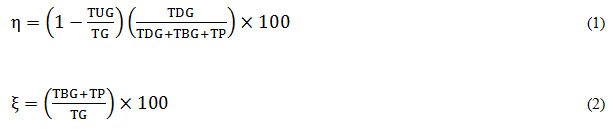
Dehulling efficiency, η in % and dehulling loss, ξ in % in terms of broken grains and powder were calculated using the following equation (Saxena, 1985, Singh et al. 2004 and Goyal et al., 2008).
Experimental design: Optimization of the milling process was done using response surface methodology (RSM) to study the effect of different pre-milling treatments on dehulling parameters and dhal recovery. The reason behind the selection of RSM was due to its suitability to find the ideal process settings to achieve optimal performance. The independent variables used in this design were oil treatment (Xi) and water treatment (Xj), each at three levels (0, 25 & 50%) for water and (0, 0.3, &0.5%) for oil treatment. The coded levels of independent variables were -1, 0 and+1 (Table 1a & 1b).
Table 1a: Coded levels of independent variables used in oiltreated dhal milling
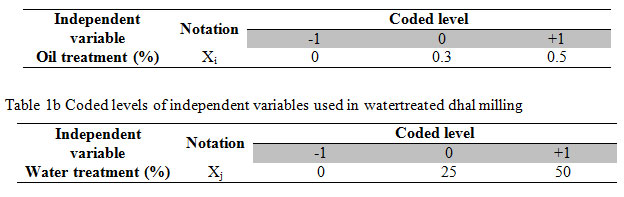
These levels were selected based on previous experiments conducted at CIPHET, Ludhiana. Since two different pre-milling treatments,i.e. using oil and water were studied, experiments were conducted separately. Thus, one factor RSM design was used for the linear model, and statistical analysis was done separately for each independent parameter. The experiments were taken in a randomized manner to reduce the effect of unexpected variations in observed responses. Considering independent variables affect the total amount of dehulled grains (TDG),unhulled grains (TUG), broken grains (TBG), powder (TP), dehulling efficiency (η)and dehulling loss (ξ) hence these were considered as responses. For this purpose, Design Expert software (Version 11) developed by Stat-Ease Inc., Minneapolis, USA,was used.
Experimental data values were analyzed using one factor RSM methodand fitted in following second-degree polynomial equation as given below.
Y = β0+ ∑ βiX + ∑ βiX2 (3)
Here Y is predicted response, β0 is constant regression coefficient, βi is the linear regression coefficient, and X is coded independent variable. To optimize process parameters, the independent variable was kept within the experimental range for maximizing TDG as well as dehulling efficiency and minimizing TUG, TBG, TP as well as dehulling loss.
Experimental justification: Dehulling experiments using different pre-milling treatments were conducted at optimum conditions prescribed by Design Expert software to analyze results. Observations were replicated three times and examined for any remarkable difference from predicted data values.
RESULTS AND DISCUSSION
The experimental results for different pre-milling treatments are presented in terms of the total amount of dehulled grains (TDG), unhulled grains (TUG), broken grains (TBG), powder (TP), dehulling efficiency and dehulling loss in Table 2a & 2b.
Table 2a: Experimental design matrix for coded values &responses in oil treated dhal milling
| Run order | Oil
treatment (Xi) |
TDG (%) |
TUG (%) |
TBG (%) |
TP (%) |
Dehulling efficiency (%) | Dehulling loss (%) |
| 1 | +1 | 44.2 | 54.3 | 1.4 | 0.1 | 44.2 | 1.5 |
| 2 | -1 | 45.2 | 44.7 | 9.5 | 0.6 | 45.2 | 10.1 |
| 3 | 0 | 50.3 | 45.4 | 3.9 | 0.3 | 50.3 | 4.3 |
| 4 | +1 | 46.4 | 51.4 | 2.1 | 0.1 | 46.4 | 2.3 |
| 5 | -1 | 41.7 | 50.4 | 7.4 | 0.5 | 41.7 | 7.9 |
| 6 | 0 | 51.4 | 45.3 | 3.0 | 0.3 | 51.4 | 3.2 |
| 7 | +1 | 45.9 | 52.4 | 1.6 | 0.1 | 45.9 | 1.7 |
| 8 | 0 | 49.3 | 47.9 | 2.6 | 0.1 | 49.3 | 2.8 |
| 9 | -1 | 42.6 | 48.5 | 8.4 | 0.5 | 42.6 | 8.9 |
Table 2b: Experimental design matrix for coded values & responses in water treated dhal milling
| Runorder | Water
treatment (Xj) |
TDG (%) |
TUG (%) |
TBG (%) |
TP (%) |
Dehulling
efficiency (%) |
Dehulling
loss (%) |
| 1 | -1 | 42.6 | 48.5 | 8.4 | 0.5 | 42.6 | 8.9 |
| 2 | 0 | 62.6 | 33.5 | 3.6 | 0.3 | 62.6 | 3.9 |
| 3 | -1 | 41.7 | 50.4 | 7.4 | 0.5 | 41.7 | 7.9 |
| 4 | +1 | 67.4 | 31.9 | 0.7 | 0.0 | 67.4 | 0.7 |
| 5 | +1 | 68.1 | 30.8 | 1.1 | 0.1 | 68.1 | 1.1 |
| 6 | 0 | 57.5 | 39.6 | 2.7 | 0.2 | 57.5 | 2.9 |
| 7 | -1 | 45.2 | 44.7 | 9.5 | 0.6 | 45.2 | 10.1 |
| 8 | +1 | 69.2 | 29.3 | 1.4 | 0.1 | 69.2 | 1.5 |
| 9 | 0 | 58.6 | 38.0 | 3.1 | 0.2 | 58.6 | 3.4 |
Dehulling fractions
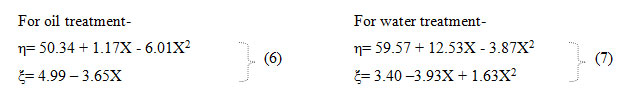
From ANOVA for different dehulling fractions such as total dehulled grains (TDG), total unhulled grains (TUG), total broken grains (TBG) and total amount of powder (TP) are shown in Table 3a & 3b. It was observed that both pre-milling treatments were significant. In most of the cases, the quadratic model was found significant expect TP in oil treatment and TUG & TP in water treatment, where a linear model was found significant. Linear regression equations obtained for given suitable linear or quadratic model of first or second degree respectively in terms of coded factor X are shown below.
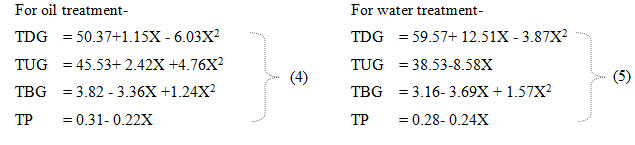
Table 3a: Analysis of variance for oil treatment on response variables
| Response | Significant
model |
SS | df | MS | F-value | p-value
Prob > F |
R2 | Adj. R2 |
| TDG | Quadratic | 80.49 | 2 | 40.24 | 21.67 | 0.0018 | 0.8784 | 0.8378 |
| TUG | Quadratic | 68.39 | 2 | 34.19 | 8.04 | 0.0201 | 0.7282 | 0.6376 |
| TBG | Quadratic | 74.65 | 2 | 37.33 | 66.17 | < 0.0001 | 0.9566 | 0.9422 |
| TP | Linear | 0.30 | 1 | 0.30 | 63.53 | < 0.0001 | 0.9007 | 0.8866 |
| η | Quadratic | 80.17 | 2 | 40.08 | 20.96 | 0.0020 | 0.8748 | 0.8331 |
| ξ | Linear | 80.96 | 1 | 80.96 | 80.04 | < 0.0001 | 0.9196 | 0.9081 |
Table 3b: Analysis of variance for water treatment on response variables
| Response | Significant
Model |
SS | df | MS | F-value | p-value
Prob > F |
R2 | Adj. R2 |
| TDG | Quadratic | 969.09 | 2 | 484.55 | 130.63 | < 0.0001 | 0.9776 | 0.9701 |
| TUG | Linear | 441.96 | 1 | 441.96 | 61.90 | 0.0001 | 0.8984 | 0.8839 |
| TBG | Quadratic | 86.53 | 2 | 43.27 | 91.48 | < 0.0001 | 0.9682 | 0.9577 |
| TP | Linear | 0.35 | 1 | 0.35 | 66.98 | < 0.0001 | 0.9054 | 0.8919 |
| η | Quadratic | 972.41 | 2 | 486.20 | 128.74 | < 0.0001 | 0.9772 | 0.9696 |
| ξ | Quadratic | 98.16 | 2 | 49.08 | 90.70 | < 0.0001 | 0.9680 | 0.9573 |
From Table 3a &3b, it was found thatfor each response, R2 value and adjusted R2 value werewithin approximately 0.20 of each other, i.e. in reasonable agreement. Therefore given models predicted response values very well. Also, high R2 values proved that selected first and second degree models were sufficient.Since only one factor was involved, representation of the response surface for dehulling fractions showed by using two-dimensional graphs.A radar chart is a unique graphical method to represent multivariate or multilevel data in the form of two-dimensional graphs. Hence, the data obtained using three different levels of each pre-milling treatment viz. oil (0%, 0.3% & 0.5%) and water (0%, 25% & 50%) treatment were shown as three distinct axes points in separate radar charts as Figure 2a & 2b below. Such type of model representation helps in understanding the effect of various factors.
Figure 2 (a& b): Dehulling fractions relationship for oil (2a) & water treatment(2b) respectively
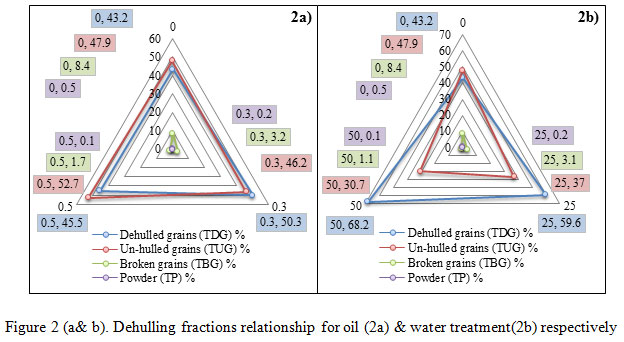
In case of oil treatment, TDG initially increased and then decreased as oil content goes beyond 0.3% while TBG was continuously decreased with the increase in oil percentage, i.e. from 0 to 0.5% (Figure2a). TDG was increased with an increase in water percentage, i.e. from 0 to 50% while TBG was decreased respectively with it (Figure 2b). Kurian & Ramakrishnaiah (1983) mentioned results indicating a high amount of water content cause rupture of mucilage-gums which was tightly bonded to the hull and cotyledon layers while higher oil percentage cause difficulty in dehulling the grains properly. TP first slightly decreased with an increase in both the cases, i.e. in both water and oil treatment, but remained nearly constant for a prolonged treatment period. Similar studies were done by Goyal et al. (2008) & by Tiwari et al. (2010) reported that total loss of powder was influenced by drying temperature and water content for pigeon pea.
Dehulling parameters: The experimental results for dehulling efficiency as well as dehulling loss are represented in Table 2a & 2b. The analysis of variance for dehulling efficiency (η) and dehulling loss (ξ) was shown in Table 3a & 3b. It was seen that both pre-milling operations were quite significant. Here, as a result, the quadratic model was suggested to study the effect of different pre-milling treatments except for dehulling loss in oil treatment in which linear model was found to be significant. Regression equations in terms of coded factor X for the suitable linear model of first degree or quadratic model of the second degree are shown as following.
The model F-values from Table 3a &3b implies only models which were found significant, and there was only a 0.01% chance that a model F-value this large could occur due to noise. P-values less than 0.05 indicated that model terms were significant. Hence both oil treatment & water treatment have significant model terms which have a substantial effect on the responses. Since the Prob>F values from Table 3a & 3b were obtained very small (less than 0.05), curvatures were found significant which means that the predicted value at the centre point was significantly different from the value that was obtained when running the centre point conditions.
Also, R2 values and adjusted R2 values for every response were found within the reasonable agreement, i.e. approximately 0.20 of each other. Therefore given models predicts response values very well. Also, high R2 values proved those first and second degree models selected were adequate.
Figure 3 (a& b): Dehulling parameters relationship for oil (3a)&water treatment(3b),respectively.
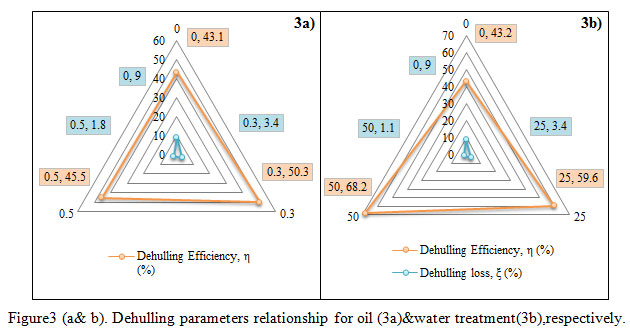
One factor response surface diagrams for dehulling efficiency and dehulling loss represented as two-dimensional radar charts (Figure 3a &3b) which help in identifying the effect of various responses. In oil treatment, dehulling efficiency was increased initially and then decreased as oil content goes beyond 0.3% (Figure 3a). Dehulling efficiency in water treatment was increased with an increase in water percentage, i.e. from 0 to 50% (Figure 3b). Increase in water pre-treatment percentage of pigeon pea grains from 0 to 50% showed a sharp increase in dehulling efficiency from 43.2 to 59.6% initially, and then it gradually increased up to 68.2%.These results found contrary to the results obtained by Kurien & Ramakrishnaiah (1983) because the moisture content of pigeon pea grains was less than 13%. The results obtained found in agreement with Tiwari et al. (2010) who denoted increased dehulling efficiency with an increase in water content, reaching a maximum after approximately 10 minutes of treatment.
Whereas, dehulling losses found to be decreased with increase inboth oil and water treatment levels. Increase in the level of oil treatment beyond 0.3%, although not significant for dehulling efficiency, yet decrease in dehulling losses (0.5-2.8%) were obtained. Hence, oil pre-treatment assists in dehulling of pigeon pea by not increasing losses during dehulling (Goyal et al., 2008).
Numerical optimization of experimental conditions: Design Expert 11software was used to achieve optimal conditions for dehulling studies of pigeon pea obeying certain conditions as given in Table 4a & 4b for oil and water pre-treatment, respectively. The experimental conditions were optimized to obtain maximum TDG and dehulling efficiency with minimum TUG, TBG, TP and dehulling loss. Lower and higher limit values of factors and responses were obtained from experimental readings. It was predicted that oil pre-treatment of0.3% gave50.2% TDG, 46.6% TUG, 3% TBG, 0.2% TP, 50.2% dehulling efficiency and 3.9% dehulling loss as optimum values with the most convenient desirability of 0.81. Similarly, water treatment of 50% gave 68.2% TDG, 29.9% TUG, 1% TBG, 0.0% TP, 68.2% dehulling efficiency and 1.1% dehulling loss as optimum values with the most convenient desirability of 0.97.
Table 4a: Optimization criteria for dehulling fractions & parameters of oil pre-treated pigeon peas
| Name | Goal | Lower Limit | Upper Limit | Importance |
| Oil Pre-treatment | in range | 0 | 0.5 | * * * |
| TDG | maximize | 41.7 | 51.4 | * * * |
| TUG | minimize | 44.7 | 54.3 | * * * |
| TBG | minimize | 1.4 | 9.5 | * * * |
| TP | minimize | 0.1 | 0.6 | * * * |
| Dehulling efficiency | maximize | 41.7 | 51.4 | – |
| Dehulling loss | minimize | 1.5 | 10.1 | – |
Table 4b: Optimization criteria for dehulling fractions & parameters of water pre-treated pigeon peas
| Name | Goal | Lower Limit | Upper Limit | Importance |
| Water Pre-treatment | in range | 0 | 50 | * * * |
| TDG | maximize | 41.7 | 69.2 | * * * |
| TUG | minimize | 29.3 | 50.4 | * * * |
| TBG | minimize | 0.7 | 9.5 | * * * |
| TP | minimize | 0.1 | 0.6 | * * * |
| Dehulling efficiency | maximize | 41.7 | 69.2 | – |
| Dehulling loss | minimize | 0.7 | 10.1 | – |
Predicted model accuracy of oil treated samples was 50.2 ± 0.8% for TDG, 46.6 ± 1.1% for TUG, 3 ± 0.4% for TBG, 0.2 ± 0.03% for TP, 50.2 ± 0.8% for dehulling efficiency and 3.9 ± 0.4% for dehulling loss. While for water treated samples accuracy of 68.2 ± 1.1% for TDG, 29.9 ± 1.4% for TUG, 1 ± 0.4% for TBG, 0.0 ± 0.04% for TP, 68.2 ± 1.1% for dehulling efficiency and 1.1 ± 0.4% for dehulling loss were obtained. In order to check the validity of optimal conditions, experiments were conducted in triplicate manner and the average TDG, TUG, TBG, TP, dehulling efficiency and dehulling loss were observed to be 50.3 ± 1.1%, 46.2 ± 1.5%, 3.2 ± 0.7%, 0.2 ± 0.1%, 50.3 ± 1.2 and 3.4 ± 0.8 respectively for oil treated samples and similarly, 68.2 ±0.9%, 30.7 ± 1.3%, 1.1 ± 0.4%, 0.1 ± 0.06, 68.2 ± 0.9 and 1.1 ± 0.4were obtained for water treated samples respectively. Since, both predicted and average values were quite similar hence it confirms the optimum conditions.
CONCLUSION
With the help of Response surface method (RSM) design, the relationships between one or more measured responses and the vital input factors were quantified for optimizing pre-treatment conditions (oil and water treatment) for milling studies of pigeon pea. These optimized parameters could be used to design integrated mini dhal mills which will help to small commercial scale milling industries. The best optimal conditions among all pre-treatments were obtained for 50% water pre-treated sample indicating highest 0.97 desirability value. Yet the amount of dehulled grains remained after milling is a bit higher as compared to commercial mill outputs. It was due to the small sample size and single time feeding of samples. Besides this, different varieties of pigeon pea, their shape, size and season of harvest also affect milling studies. Hence to promote its further application, pre-treatments should be tested considering the above different aspects.
ACKNOWLEDGEMENT
First two authors acknowledge their sincere thanks to Dr R. T. Patil, Ex. Director, Central Institute of Post Harvest Engineering & Technology, Ludhiana (Punjab) for giving opportunity and providing the facility to conduct experiments at CIPHET, Ludhiana and both also are grateful to Dr D.M. Kadam, (now Principal Scientist in Agricultural Process Engineering Division at CIRCOT, Mumbai) who guided them during their studies.
REFERENCES
Anonymous. 1984. Recommended dietary intakes for Indians. ICMR, New Delhi: 58-59.
Ante, G. Pliestic, S.Jovic, F.; Nenadic, K. & Jovic, A. 2014. An energy efficient corn grain drying process. Energetski Ucinkovit Proces Susenja Kukuruznog Zrna, TehnickiVjesnik 21 (6), 1395-1401.
AOAC. 2000. In: Official Methods of Analysis of the Association of Official Analytical Chemists (Horwitz W, ed), 17th eds. AOAC International, Maryland, USA.
Chavan, J. K.; Jawale; H. K.; Shore, D. M.;Jadhav, S. J.; &Kadam, S. S. 1983. Effects of pre-soak treatments on the cooking quality of legume dhal. Indian Food Packer: 78-80.
Chunilal, C. V. 2017. Enzymatic pre-treatments on pigeon pea (BSMR-736) for better milling quality of dhal. Department of Processing & Food Engineering, College of Agricultural Engineering and Technology, Junagadh Agricultural University, Junagadh- 362001.
DES, DAC. 2017-18 & 2018-19. DES-Directorate of Economics and Statistics, DAC- Department of Agriculture & Cooperation Annual report 2017-2018 and 2nd advance estimates report 2018-2019.
Deshpande, S. D. 1990. Studies on some engineering aspects for processing and utilization of soya bean. Ph. D. Thesis, Indian Institute of Technology, Kharagpur, India.
Deshpande, S. D.; Srivastava, S.; & Manoj, K. 2007.Application of oil-water and sodium bicarbonate pre-milling treatments for increased dhal recovery. Journal of Food Science & Technology, 44(1): 22-25.
Goyal, R. K.; Vishwakarma, R. K.; &Wanjari, O. D. 2008.Optimisation of the pigeon pea dehulling process. Biosystems Engineering, 99: 56–61.
Gupta, S. 2013. Process Optimization for Milling of Moong Beans (Vigna radiata) Thesis Submitted to Department of Processing and Food Engineering, College of Agriculture Engineering & Technology, Punjab Agricultural University Ludhiana-141004.
Hiregoudar,S.; Sandeep, T. N.; Nidoni,U.; Shrestha,B.; & Medha, V. 2014. Studies on dhal recovery from pre-treated pigeon pea (Cajanus cajan L.) cultivars. Journal of Food Science Technology. 51(5): 922–928.
Jennifer, A. W.;&Malcolmson, L. 2011. Pulse milling technologies. In: Brijesh K. Tiwari, Aoife Gowen and Brian Mckenna, Editors: Pulse Foods, Oxford: Academic Press; p. 193-221.
Kulkarni, S.D. 2002. Energy use assessment and demand projections for pulse processing industry in India. Agricultural Engineering Today, 24(3):13-21.
Kurien, P. P. 1981. Advances in milling technology of pigeon pea, In: Proceeding of an international workshop on pigeon pea. International Crop Research Institute for Semi-Arid Tropics, Patancheru, India.
Kurien, P. P.; &Parpia, H. A. B. 1968.Pulse milling in India. Journal of Food Science & Technology, 5: 203-210.
Mangaraj, S.; Agrawal, S.; Kapur, T.; & Kulkarni, S. D. 2004.Effect of pre-milling treatment and abrasive rollers on milling of pulses. Journal of Agricultural Engineering 41: 10-15.
Mazza, G; & Campbell, C. G. 1985. Influence of water activity and temperature on dehulling of buckwheat. Cereal Chemistry, 62: 31–34.
Phirke, P. S; & Bhole, N. G. 2000. Pretreatments on pigeon pea grain for improvement of dehulling characteristics. International Journal of Food Science & Technology, 35: 305-313.
Phirke, P. S; & Bhole, N.G. 1999.The effect of pretreatment on the strength and dehulling properties of pigeon pea grains. International Journal of Food Science & Technology, 34: 107-113.
Ramakrishnaiah, N.; &Kurien, P. P. 1983.Variabilities in the dehulling characteristics of pigeon pea (Cajanus cajan L.) cultivars. Journal of Food Science Technology, 20: 287-291.
Roy D.; Joshi, P. K.; & Chandra, R. 2017. Report on Pulses for Nutrition in India Changing Patterns from Farm to Fork. International Food Policy Research Institute Washington, DC.
Sahay, K. M.; & Bisht, B. S. 1988. Development of a small abrasive cylindrical mill for milling pulses. International Journal of Food Science Technology, 23: 17-22.
Saxena, R. P. 1985. Milling of pigeon pea (Cajanus cajan) and associated aspects. PhD Thesis, G.B. Pant University of Agriculture & Technology, Pantnagar, India.
Singh, A.; &Ilyas, S. M. 1994.Energy audit of pulse milling technologies in India. IN: energy management and Conservation in Agriculture Production and Food Processing.
Singh, S. K.; Agarwal, U. S.; &Saxena, R. P. 2004.Optimization of process parameters for milling of green gram (Phaseolus aureus).Journal of Food Science and Technology, 41(2): 124–130.
Sokhansanj, S; &Patil, R. T. 2003. Dehulling and splitting pulses. In: Handbook of Post Harvest Technology (Chakraverty, A.et al.,eds). Marcel Dekker, New York.
Tiwari, B. K.; Jagan Mohan, R.; Venkatachalapathy, N.; Anand, M. T.; Surabi, A.; & Alagusundaram, K. 2010. Optimization of hydrothermal treatment for dehulling pigeon pea. Food Research International, 14(6): 487-495.
Tiwari, B. K.; Jagan Mohan, R.; & Vasan, B. S. 2007.Effect of heat processing on milling of black gram and its end product quality. Journal of Food Engineering,78: 350-360.
Tiwari, A.K.; & Shivhare, A. K. 2017. Report on pulses in India: Retrospect & prospects. Government of India Ministry of Agriculture & Farmers Welfare (Department of Agriculture, Cooperation and Fw) Directorate of Pulses Development Vindhyachal Bhavan, Bhopal-462004, (M.P.)
Wang, N. 2005. Optimization of a laboratory dehulling process for lentil (Lens culinaris). Grain Research Laboratory, Canadian Grain Commission, Winnipeg, MB, Canada. https://doi.org/10.1094/CC-82-0671.

