1Department of Chemistry, Acharya Nagarjuna University, Nagarjuna nagar, Guntur, Andhra Pradesh, India.
2Department of Chemistry, SASI Institute of Technology and Engineering, Andhra Pradesh, India.
3Department of Chemistry, IIIT-Ongole campus, Prakasam, Andhra Pradesh, India.
Corresponding author email: dr.b.haribabu@gmail.com
Article Publishing History
Received: 15/07/2022
Accepted After Revision: 14/09/2022
The purpose of this investigation was to establish a HPLC methodology and evaluate Gadobutrol along with impurities A, B and C. The method for Gadobutrol along with impurity-A, B and C analysis was developed on Phenomenex Phenyl-Hexyl C18 column with isocratic elution using mobile phase consisted of formic acid (pH 3.6) and acetonitrile. The method proposed showed a good linearity in the range of 0.8314 – 30.21 ppm (Gadobutrol), 3.2971 – 34.62 ppm (impurity-A), 0.3788 – 34.82 ppm (impurity-B), and 2.9757 – 32.38 ppm for impurity-C. Obtained good method precision (RSD = 2.36% to 3.55%), acceptable accuracy (98.8% to 108.9%), detection limit (0.1250 ppm to 1.0811 ppm) and quantitation limit (0.3788 ppm to 3.2971 ppm) for Gadobutrol and impurity-A, B and C. The method proposed can be utilized to assess the quality of Gadobutrol sample for the presence of impurities A, B and C.
Gadobutrol, Related substances, RP-HPLC, Stability indicating, UV Detector, Validation.
Najana S. B, Pokala R. K. V, Bhavani K. G, Khandapu B. M. K, Bollikolla H. B. On the Stability Indicating Reverse Phase High-Performance Liquid Chromatography Method for Quantitative Estimation of Impurities in Gadobutrol Solution for Intravenous Administration. Biosc.Biotech.Res.Comm. 2022;15(3).
Najana S. B, Pokala R. K. V, Bhavani K. G, Khandapu B. M. K, Bollikolla H. B. On the Stability Indicating Reverse Phase High-Performance Liquid Chromatography Method for Quantitative Estimation of Impurities in Gadobutrol Solution for Intravenous Administration. Biosc.Biotech.Res.Comm. 2022;15(3). Available from: <a href=”https://bit.ly/3RrWaxW“>https://bit.ly/3RrWaxW</a>
Copyright © This is an Open Access Article distributed under the Terms of the Creative Commons Attribution License (CC-BY). https://creativecommons.org/licenses/by/4.0/, which permits unrestricted use distribution and reproduction in any medium, provided the original author and sources are credited.
INTRODUCTION
Effective evaluation of process associated impurities is crucial for the development of pharmaceuticals. Process associated impurities are related to the production process and may include precursor substrates, intermediates formed during the procedure of synthesis, solvents used during production or purification (Jinshu et al. 2015; Kung-Tien and Chien-Hsin 2019). As mentioned by the “International Conference on Harmonization” for the qualification of the drug substance, the permissible level for known process associated impurity needs to be <0.15% and the unknown process associated impurity need to be <0.10% (ICH Q3B(R2) 2006; ICH Q3A (R2) 2008).
In order to comply with the strict regulatory necessities, it is necessary to identify impurities and carefully monitor their amounts. Gadobutrol is utilised in adult as well as pediatric sufferers, including newborns, with magnetic resonance imaging to diagnose and predict areas with an impaired blood barrier and/or aberrant central nervous system vascularity (Scott 2018; Glutig et al. 2019; Petronek et al. 2021; Akbas et al. 2022).
The 1, 4, 7, 10-tetraazacyclododecane is used to make the Gadobutrol pharmaceutical substance. Impurities impurity-A, B and C, as well as two other molecules, are produced as by-products during the manufacturing of Gadobutrol. Purification removes the generated two additional compounds, and remaining impurities (A, B, and C) are regulated in the drug material. Impurity-A was designated chemically as 2,2ʹ-[4,10-bis[2,3-dihydroxy-1-(hydroxymethyl)propyl]-1,4,7,10-tetra azacyclododecane-1,7-diyl]diaceticacid (Figure 1). Impurity-B was designated chemically as 2,2ʹ,2ʹʹ-[10-[(1RS, 2SR)-2,3-dihydroxy-1-(hydroxymethyl)propyl]-1,4,7,10-tetraazacyclododecane-1,4,7-triyl]triacetic acid (Figure 1). Impurity-C was designated chemically as gadolinium 2,2ʹ,2ʹʹ-(1,4,7,10-tetraazacyclododecane-1,4,7-triyl) triacetate (Figure 1) (Akbas et al. 2022).
Figure 1: Structures of Gadobutrol and impurities A, B and C
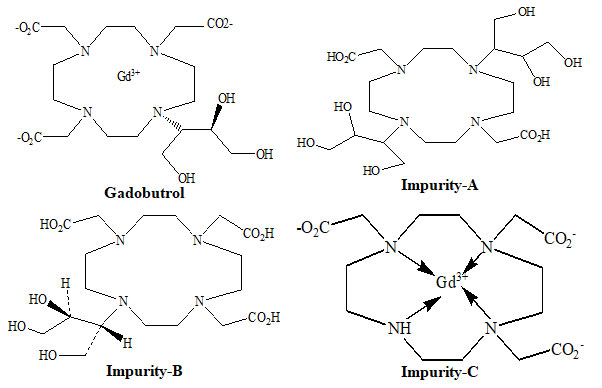
Also, after so many purification phases, impurities impurity-A, B and C will often occur which canco-purify with the Gadobutrol. The existence of impurity-A, B and C impurities in Gadobutrol can potentially influence the efficacy of the final Gadobutrol drug. Therefore, a sensitive, reliable and effective method is required to detect and evaluate impurities A, B and C in Gadobutrol. The specification thresholds for impurities A, B and C impurities were considered as 0.20 % concentration based on new drug substances policy given in ICH Q3A (ICH Q3A (R2) 2008; Al-Sabti and Harbali 2021; Kalauz and Kapui 2022).
Detection and evaluation of impurities A, B and C impurities in the Gadobutrol using any analytical approach is not yet documented. Therefore, a sensitive, reliable and effective HPLC dependent method to detect and evaluate impurities A, B and C impurities simultaneously in Gadobutrol was developed and validated herein.
MATERIAL AND METHODS
HPLC grade Merck (Mumbai, India) formic acid, acetonitrile, water- HPLC-grade (Milli Q) were utilized. Impurity-A (85.7% purity), Impurity-B (94.7% purity) and Impurity-C (90.03% purity) were obtained from Aavyan Labs Pvt Ltd. (Hyderabad, India). Jodas Expoim Pvt Ltd. (Hyderabad, India) provided Gadobutrol. Agilent (USA) HPLC 1260 infinity system, Agilent (USA) photodiode array detector, Open lab software, Sartorius MSA6.6S-000-DM microbalance, Bandelin, DT514BH ultra sonicator and Polmon LP-139SA pH meter were used during detection and evaluation of impurity-A, B and C impurities simultaneously in Gadobutrol.
A Phenomenex Luna Phenyl-Hexyl C18, 250 × 4.6 mm, 5 μm column was used at 50oC temperature with isocratic elution at the rate of flow with 1 mL per min. The mobile phase contained of aqueous formic acid (pH 3.6) and acetonitrile in 95.5% volume and 0.5% volume, respectively. Sample quantity of 20 µL, sample injector temperature of 5 oC and wavelength of 195 nm were utilized in the detection besides evaluation of impurities A, B and C impurities in the Gadobutrol. Mixed stock solution (2.0% concentration) for Gadobutrol and impurities A, B and C was prepared in mobile phase. Series of working solutions (LOQ to 150% of Gadobutrol, impurities A, B and C specification value limits) were prepared by diluting appropriate aliquots of the mixed stock solution (2.0% concentration) with mobile phase. Working solution of Gadobutrol and impurities A, B and C with 20 ppm concentration were also done by diluting appropriate aliquots of stock solution (2.0% concentration) with mobile phase.
This solution with concentration 1 mg/mL was prepared in mobile phase. The Gadobutrol sample was shaken for 5 min after the preparation and filtered using Millipore 0.45 microns. Accurate quantities equal to 0.8314 – 30.21 ppm of Gadobutrol, 3.2971 – 34.62 ppm of impurity-A, 0.3788 – 34.82 ppm of impurity-B, and 2.9757 – 32.38 ppm of impurity-C were prepared. Each quantity solution was infused (20 µL) and recorded the corresponding chromatograms and peak areas for Gadobutrol, impurity-A, B and C by applying suggested HPLC method. The calibration curves for each component (Gadobutrol, impurity-A, B and C) were then generated utilizing its respective peak areas, and corresponding regression linear equations was then created.
The Gadobutrol solution was infused (20 µL) and noted the chromatograms by applying recommended HPLC method. The response areas of impurities A, B and C in Gadobutrol solution were documented. The percentage of impurities A, B and C in Gadobutrol solution was assessed using corresponding regression linear equations. Gadobutrol was subjected to a number of forced degradation tests, involving acid, base, humidity, peroxide, humidity and thermal degradation [ICH Q1A (R2); 2003]. Gadobutrol was subjected to acid made hydrolysis (1.0 N HCl, 60 °C over 1 hr), alkali made hydrolysis (1.0 N NaOH, 60 °C over 1 hr), peroxide made oxidation (bench top 4 hr), thermal made degradation (105 °C, over 24 hr) and humidity made degradation (90% humidity, over 24 hr). The degraded Gadobutrol solutions were infused (20 µL) and noted the chromatograms by applying the suggested HPLC method. The occurrence of impurities A, B and C impurities and percent degradation of Gadobutrol were documented.
RESULTS AND DISCUSSION
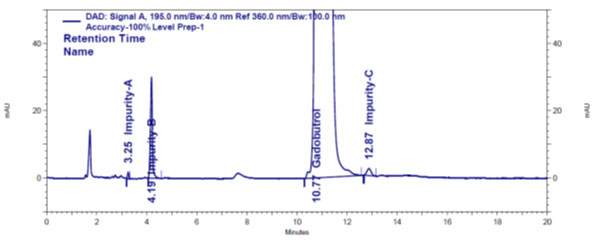
Method establishment: Zorbax SB C8, 250 × 4.6 mm, 5 μm column and Phenomenex Luna Phenyl-Hexyl 250 x 4.6 mm, 5 μm columns with isocratic elution with solvents combination of0.1% aqueous formic acid: acetonitrile with different pH values and different ratio volumes were tried during trail experiments. During trails, sample volume size for analysis, column temperature, sample port temperature and flow rate are kept constant at 20 µl, 50 oC, 5 oC and 1.0 mL/min, respectively. Based on resolution, peak shape and sensitivity values obtained during trails (Figure 2), Phenomenex Luna Phenyl-Hexyl 250 × 4.6 mm, 5 μm column with isocratic elution with 0.1% aqueous formic acid and acetonitrile in 95.5% volume and 0.5% volume, respectively, as mobile phase was opted as optimal conditions to detect and evaluate A, B and C impurities simultaneously in the Gadobutrol sample. The wavelength of choice for the study of A, B and C impurities was 195 nm, where impurities showed more sensitivity.
Figure 2: Gadobutrol drug and impurities A, B and C chromatogram
Validation: The method for A, B and C impurities evaluation in the Gadobutrol was verified in harmony thru ICH strategies (ICH Q2 (R1) 2005).
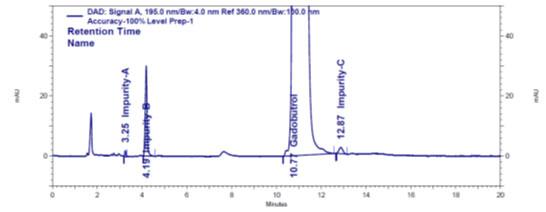
Specificity: The procedure’s specificity was tested to ensure that the Gadobutrol and diluent components did not interfere with the analysis of A, B and C impurities. Gadobutrol sample, Gadobutrol solution spiked with impurities A, B, and C (20 ppm), and diluent blank were made and analysed using the HPLC method described. The typical chromatograms for specificity were displayed in (Figure 3a to 3c).
Figure 3 a: Diluent chromatogram
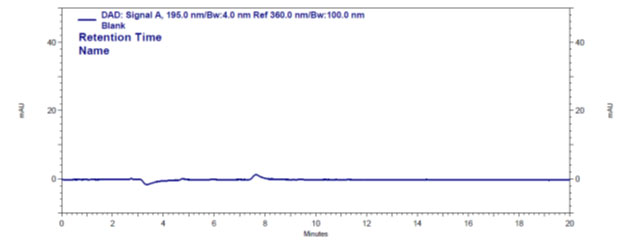
Figure 3b: Gadobutrol sample chromatogram
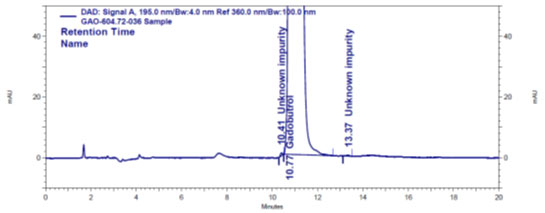
Figure 3c: Impurities A, B and C spiked Gadobutrol sample chromatogram
Quantification and detection limits: Quantification and detection limits were checked for impurities A, B and C at a concentration which gives an S/N fraction ≥10 and ≥3, respectively. The values of detection limit for Gadobutrol and impurities impurity-A, B and C were 0.2739 ppm, 1.0881 ppm, 0.1250 ppm and 0.9820 ppm, respectively. The quantification limits were 0.8314 ppm (Gadobutrol), 3.2971 ppm (impurity-A), 0.3788 ppm (impurity-B) and 2.9757 ppm (impurity-C). The quantification limit values for Gadobutrol and impurities A, B and C were confirmed by precision results. The determined %RSD of six area responses of Gadobutrol and impurity-A, B and C at their quantification limit level were 5.8% (Gadobutrol), 9.0% (impurity-A), 9.0% (impurity-B) and 11% (impurity-C).
Linearity: The linear quantity range for Gadobutrol and A, B and C impurities was checked in a quantity range from the quantification limit level (0.8314 ppm for Gadobutrol, 3.2971 ppm for impurity-A, 0.3788 ppm for impurity-B and 2.9757 ppm for impurity-C) to 150% of specification quantity limit (30.21 ppm for Gadobutrol, 34.62 ppm for impurity-A, 34.82 ppm for impurity-B and 32.38 ppm for impurity-C). A linear correlation was detected between area responses and concentrations of Gadobutrol and A, B, and C impurities in the range of quantities studied. The linear regression parameters were shown in Table 1.
Table 1. Linear regression details for Gadobutrol and impurity-A, impurity-B and impurity-C
| Parameter | Impurity-A | Impurity-B | Impurity-C | Gadobutrol |
| Linearity (ppm) | 3.2971–34.62 | 0.3788– 34.82 | 2.9757– 32.38 | 0.8314– 30.21 |
| Correlation coefficient (r) | 0.9988 | 0.9991 | 0.9968 | 0.9991 |
| Intercept value | 33855.835 | 154620.629 | -147462.62 | 454535.662 |
| Slope value | 41316.302 | 479640.138 | 189669.234 | -355480.676 |
| Square of Correlation coefficient (r2) | 0.9976 | 0.9982 | 0.9937 | 0.9982 |
| 100% Y-intercept | 3.47 | 1.44 | -3.84 | -4.11 |
Method precision: By analysing a Gadobutrol sample spiked with contaminants impurity-A (20 ppm), impurity-B (20 ppm), and impurity-C (20 ppm), the method precision was confirmed (20 ppm). The method precision was determined by calculating the mean concentration and relative standard deviation of six different Gadobutrol, impurity-A, impurity-B, and impurity-C values (Table 2).
Table 2. Precision study
| Sample | Impurity: A (ppm) | Impurity: B
(ppm) |
Impurity: C
(ppm) |
Gadobutrol
(ppm) |
| 1 | 21.00 | 21.50 | 21.30 | |
| 2 | 21.20 | 20.70 | 21.30 | |
| 3 | 21.20 | 20.20 | 20.80 | 9676 |
| 4 | 22.00 | 20.90 | 20.10 | |
| 5 | 21.50 | 21.40 | 21.30 | |
| 6 | 20.50 | 21.50 | 22.40 | |
| Average | 21.00 | 21.00 | 21.00 | NA |
| Standard deviation | 0.01 | 0.01 | 0.01 | NA |
| %RSD | 2.36 | 2.51 | 3.55 | NA |
NA – not available
Accuracy: Appropriate amounts of impurities A, B and C were spiked with Gadobutrol sample with replicates (n=3) at 50%, 100% and 150% of specification quantity limits. These samples were analysed by way of suggested HPLC method and determined the recovery of impurities A, B and C at each level (Table 3).
Table 3. Accuracy results
| S.No. | Theoretical (%) | % Mean Recovery | |||
| Impu: A | Impu: B | Impu: C | Gadobutrol | ||
| 1 | 50 | 106.7 | 103.0 | 106.9 | 108.7 |
| 2 | 50 | 103.4 | 102.0 | 102.0 | 105.8 |
| 3 | 50 | 102.5 | 104.0 | 106.9 | 96.2 |
| Average | 104.2 | 103.0 | 105.3 | 103.6 | |
| Standard deviation | 2.2113 | 1.00 | 2.8290 | 6.5424 | |
| RSD | 2.1 | 1.00 | 2.7 | 6.3 | |
| 1 | 100 | 108.4 | 109.6 | 104.9 | 93.8 |
| 2 | 100 | 108.4 | 107.6 | 104.9 | 86.1 |
| 3 | 100 | 110.0 | 105.6 | 102.5 | 89.9 |
| Average | 108.9 | 107.6 | 104.1 | 89.9 | |
| Standard deviation | 0.9238 | 2.00 | 1.3856 | 3.8501 | |
| RSD | 0.8 | 1.9 | 1.3 | 4.3 | |
| 1 | 150 | 98.3 | 112.5 | 105.6 | 90.4 |
| 2 | 150 | 100.3 | 114.5 | 98.7 | 91.1 |
| 3 | 150 | 97.8 | 113.5 | 101.6 | 90.4 |
| Average | 98.8 | 113.5 | 102.0 | 90.6 | |
| Standard deviation | 1.3229 | 1.00 | 3.4646 | 0.4041 | |
| RSD | 1.3 | 0.9 | 3.4 | 0.4 | |
Impurity-A, B and C stability in Gadobutrol solution: Impurities-A, B and C spiked to Gadobutrol sample were stored at bench top and analysed by way of suggested HPLC method at 0 hr, 24 hr, 48 hr and 72 hr. Determined the recoveries of Gadobutrol, impurity-A, impurity-B and impurity-C. The recoveries of Gadobutrol, and A, B and C impurities obtained at 24 hr, 48 hr and 72 hr were compared with Gadobutrol and impurities recoveries at 0 hr (Table 4). The same set of experiments was repeated with impurities-A, B and C impurities spiked to Gadobutrol sample stored in refrigerator (Table 4).
Table 4. Consequences of Impurities-A, B and C stability in Gadobutrol solution
| Component | ppm determined | % Difference | ppm determined | % Difference | ppm determined | % Difference | |
| Initial study | After
24 hr |
After 48 hr | After 72 hr | ||||
| Stored at bench top | |||||||
| Impurity-A | 26.00 | 26.60 | 0.001 | 25.70 | 0.003 | 26.40 | 0.02 |
| Impurity-B | 20.70 | 20.90 | 0.02 | 22.90 | 0.022 | 24.60 | 0.039 |
| Impurity-C | 21.30 | 19.80 | 0.015 | 20.30 | 0.01 | 21.60 | 0.003 |
| Gadobutrol | NA | 102.5 | NA | 105.5 | 3.00 | 104.2 | 1.7 |
| Stored in refrigerator | |||||||
| Impurity-A | 26.00 | 26.70 | 0.007 | 25.70 | -0.003 | 25.90 | -0.001 |
| Impurity-B | 20.70 | 20.90 | 0.002 | 23.00 | 0.023 | 24.30 | 0.036 |
| Impurity-C | 21.30 | 21.30 | 0.00 | 21.10 | -0.002 | 20.50 | -0.008 |
| Gadobutrol | NA | 99.4 | NA | 95.8 | -3.6 | 102.8 | 3.4 |
NA – not available
Forced degradation: The chromatograms obtained from various stress tests like, involving acid, base, peroxide, humidity and thermal degradation on Gadobutrol are shown in (Figure 4a-4e). (Table 5) summarizes the forced degradation findings.
Figure 4 a: Chromatogram of acid stressed Gadobutrol sample
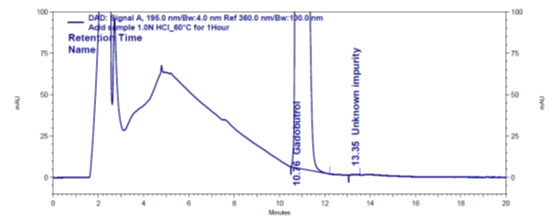
Figure 4 b: Chromatogram of base stressed Gadobutrol sample
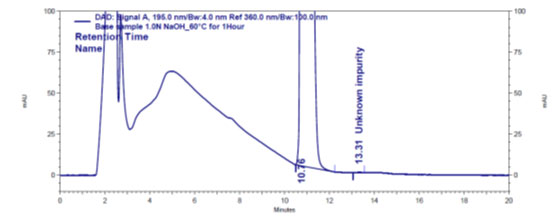
Figure 4 c: Chromatogram of oxidative stressed Gadobutrol sample
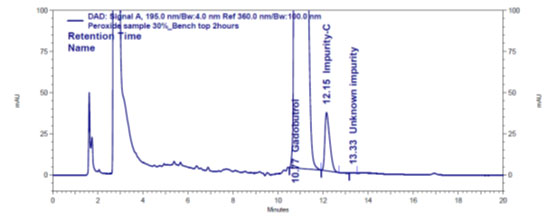
Figure 4 d: Chromatogram of dry heat stressed Gadobutrol sample
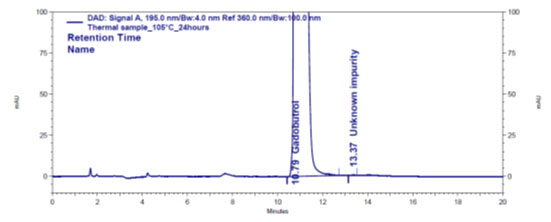
Figure 4e: Chromatogram of humidity stressed Gadobutrol sample
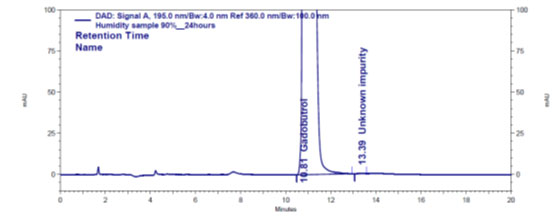
Table 5. Forced degradation results of Gadobutrol sample
| Degradation condition | Gadobutrol degraded % | % Occurrence of | ||||
| Impurity: A | Impurity: B | Impurity: C | Unknown impurity | Total Impurities | ||
| Control sample | 0.02 | N.D. | N.D. | N.D. | 0.02 | 0.02 |
| Acid: 1.0 N HCl@60°C/1hr | 0.02 | N.D. | N.D. | N.D. | 0.02 | 0.02 |
| Base: 1.0 N NaOH@60°C/1hr | 0.02 | N.D. | N.D. | N.D. | 0.02 | 0.02 |
| Peroxide: 30% H2O2@ bench Top/4 hr | 2.11 | N.D. | N.D. | 2.09 | 0.02 | 2.11 |
| Thermal: 105°C/24 hr | 0.02 | N.D. | N.D. | N.D. | 0.02 | 0.02 |
| Humidity: 90% RH/24 hr | 0.02 | N.D. | N.D. | N.D. | 0.02 | 0.02 |
N.D. – not detected
Blank peak, on the other hand, did not overlap impurity A, B, or C peaks (Figure 3a). The retention periods for Gadobutrol (Figure 3b), impurities A, B, and C (Figure 3c) are all different, according to chromatograms. This shows that DFP had no effect on impurity-A, impurity-B, or impurity-C analyses. As a result, it’s a very selective method (Marcello et al. 2012; Ravisankar et al. 2015; Ahmad et al. 2022; Lalic et al. 2022). The determined %RSD of 6 area responses of Gadobutrol and impurities A, B and C at their quantification limit levels confirmed sensitivity and precision at quantification limit concentrations (Marcello et al. 2012; Ravisankar et al. 2015; Leistner and Holzgrabe 2021).
The coefficient of correlation (Table 1) values for Gadobutrol and impurities A, B and C disclose the process was of linear inside the concentration range determined (Soumia et al. 2017; Kowalska et al. 2022). The relative standard deviation (Table 2) determined for impurities-A, B and C was noticed as 2.36% to 3.55% which evidenced that the protocol was precise for evaluation of present impurities (Betz et al. 2011; Musmade et al. 2021). The evaluated values of recoveries (Table 3) for impurities A, B and C for the suggested method proved that the method was accurate enough for the evaluation of the present impurities in the Gadobutrol sample (Betz et al. 2011; Musmade et al. 2021).
In the chromatograms (Figures 4a-4e) of all Gadobutrol degraded samples, all degradation peaks were resolved well from Gadobutrol peak, and did not display any interfering at the retention times of Gadobutrol and impurities A, B and C. Gadobutrol was realised to be more stable in acid, alkali, thermal and humidity stress conditions but sensitive to peroxide made oxidative condition. These findings for the suggested method proved that method was stability indicating enough for evaluation of the studied impurities in Gadobutrol sample (Ganpisetti et al. 2020; Manchuru et al. 2020; Karaer et al. 2022).
CONCLUSION
The findings of the present study shows that HPLC-dependent method is a reliable and effective to detect and evaluate Gadobutrol and impurities A, B and C simultaneously in the Gadobutrol sample was developed and validated. The parameters validated (linear regression, accuracy, robustness, precision, specificity, detection limit, devise suitability, quantification limit) for Gadobutrol and impurities A, B and C were in line with ICH criteria requirement. Our results indicated that Gadobutrol sample quality can be assessed using the method proposed in this study.
ACKNOWLEDGEMENTS
The study was supported by the Acharya Nagarjuna University, India.
Funding: Not applicable for this article.
Conflicts of Interests: Authors declare no conflicts of interests to disclose.
Data Availability Statement: All the information related to this manuscript is available with the authors and can be shared on a reasonable request made to the corresponding author when required.
REFERENCES
Ahmad R, Hailat M, Zakaraya Z et al. (2022). Development and validation of an HPLC method for the determination of meloxicam and pantoprazole in a combined formulation. Analytica 3, 161–177. https://doi.org/10.3390/ analytica3020012
Akbas E, Unal F and Yuzbasioglu D. (2022). Genotoxic effects of gadobutrol and gadoversetamide active substances used in magnetic resonance imaging in human peripheral lymphocytes in vitro. Drug Chem Toxicol 21, 1-12. https://doi.org/10.1080/01480545.2021.1957913.
Al-Sabti B and Harbali J. (2021). Development and validation of an analytical method for quantitative determination of three potentially genotoxic impurities in vildagliptin drug material using HPLC-MS. Journal of Separation Science 44(13), 2587-2595. https://doi.org/10.1002/jssc.202100136.
Betz JM, Brown PN and Roman MC. (2011). Accuracy, precision, and reliability of chemical measurements in natural products research. Fitoterapia 82(1), 44-52. https://doi.org/10.1016/j.fitote.2010.09.011.
Ganpisetti SR. Basavaiah K, Reddy PS et al. (2020). Novel HPLC method for levofloxacin and its known impurities in tablets dosage form. Caribbean Journal of Science and Technology, 8, 36-52. https://doi.org/10.55434/CBI.2020.8103
Glutig KH, Kuvvetli P, and Endrikat J. (2019). Safety of gadobutrol: results of a non-interventional study of 3710 patients, including 404 children. Acta Radiology 60(7), 873-879. https://doi.org/10.1177/0284185118801151.
ICH (2003). International Conference on Harmonization of technical requirements for registration of pharmaceuticals for human use ICH Harmonized tripartite guideline. In: Stability testing of new drug substances and products Q1A (R2).
ICH, Guidance for industry Q3A (R2) (2008). Impurities in new drug substances, in: Proceedings of the International Conference on Harmonization.
ICH, Guidance for industry Q3B (R2) (2006). Impurities in new drug products, in: Proceedings of the International Conference on Harmonization.
International Conference on Harmonization (2005). Expert Working Group Validation of Analytical Procedures: Text and Methodology Q2 (R1).
Jinshu QK, Karen L, and Anil MR. (2015). Risk-based strategy to determine testing requirement for the removal of residual process reagents as process-related impurities in bioprocesses. PDA Journal of Pharmaceutical Science and Technology 69(3), 334-345. https://doi.org/10.5731/pdajpst.2015.01056.
Kalauz A and Kapui I. (2022). Determination of potentially genotoxic impurities in crotamiton active pharmaceutical ingredient by gas chromatography. Journal of Pharmaceutical and Biomedical Analysis 210, 114544. https://doi.org/10.1016/j.jpba.2021.114544.
Karaer Ö, Dinç-Zor Ş, and Aşçı B. (2022). Development of a validated stability-indicating HPLC Method for vinpocetine in the presence of potential impurities in tablet dosage form by multiresponse optimization. Journal of AOAC International 105(3), 688-695. https://doi.org/10.1093/jaoacint/qsab167.
Kowalska M, Woźniak M, Kijek M et al. (2022). Management of validation of HPLC method for determination of acetylsalicylic acid impurities in a new pharmaceutical product. Science Reports 12, 18. https://doi.org/10.1038/s41598-021-99269-x
Kung-Tien L and Chien-Hsin C. (2019). Determination of impurities in pharmaceuticals: Why and How?, Quality Management and Quality Control-New Trends and Developments, Paulo Pereira and Sandra Xavier, IntechOpen. https://doi.org/10.5772/intechopen.83849
Lalić M, Soldić A, Lalić A et al. (2022). Development and validation of an HPLC Method for simultaneous determination of capsaicinoids and camphor in over-the-counter medication for topical use. Molecules 27(4), 1261. https://doi.org/10.3390/molecules27041261.
Leistner A and Holzgrabe U. (2021). Impurity profiling of baclofen using gradient HPLC–UV method. Chromatographia 84, 927–935. https://doi.org/10.1007/s10337-021-04079-y
Manchuru V, Yeragodala NR and Sreeramulu J. (2020). Novel and stability indicating HPLC method for ezetimibe, rosuvastatin, atorvastatin in tablets form. Caribbean Journal of Science and Technology 8, 1-24. https://doi.org/10.55434/CBI.2020.8101
Marcello L, Dora M, Giuseppe C et al. (2012). Recent HPLC strategies to improve sensitivity and selectivity for the analysis of complex matrices. Instrumentation Science & Technology 40 (2-3), 112-137. https://doi.org/10.1080/10739149.2011.651668
Musmade BD, Baraskar ML, Ghodke VN et al. (2021) Impurity profiling method development and validation of metformin hydrochloride and teneligliptin hydrobromide hydrate in their combination tablet dosage form by using RP-HPLC with UV/PDA detector. Future Journal of Pharmaceutical Sciences 7, 218. https://doi.org/10.1186/s43094-021-00362-9
Petronek MS, Steinbach EJ, Kalen AL, et al. (2021). Assessment of gadobutrol safety in combination with ionizing radiation using a preclinical mri-guided radiotherapy model. Radiation Research 195(3), 230-234. https://doi.org/10.1667/RADE-20-00199.1.
Ravisankar P, Navya C, Pravallika N et al. (2015). A review on step-by-step analytical method validation. IOSR Journal of Pharmacy 5(10), 7-19.
Scott LJ. (2018). Gadobutrol: A review in contrast-enhanced MRI and MRA. Clinical Drug Investigation 38(8), 773-784. https://doi.org/10.1007/s40261-018-0674-9
Soumia B, Fatima H, Saïd B et al. (2017). Statistical tools and approaches to validate analytical methods: methodology and practical examples. International Journal of Metrology and Quality Engineering 8(9), 1-10. https://doi.org/10.1051/ijmqe/2016030

