Agri Biochem Research Lab, Ankleshwar, Bharuch, Gujarat, India.
Corresponding author email: neil@pushpajshah.com
Article Publishing History
Received: 17/06/2021
Accepted After Revision: 23/09/2021
The study of PGPR diversity is important for acquainting the knowledge about the unique characteristics of microorganisms and for discovering novel PGPR strains in the rhizosphere that may be used in inoculant formulation to boost the crop production. In this regards, present study was aimed at investigation of functional diversity of plant growth promoting rhizobacteria (PGPR) from Bharuch district using diversity indices and species evenness concept. The study was also focused on correlation of functional trait of microbes with soil characteristics and host type.
To accomplish the objective, present study was designed to target nineteen different location of Bharuch district of Gujarat state (India). These sites were scrutinized and studied for PGPR diversity by isolating nitrogen fixers, phosphate solubilizers, potash solubilizers and zinc solubilizers. The location Panoli (L17) was found to be more diverse in PGPR trait followed by Motali (L1). Locations, Safipura (L2), Kharod (L8), Dhamrod (L9), Kosmadi (L10) and Nandav (L19) shows the relative abundance for nitrogen fixers whereas Bakrol (L18) shows the relative abundance for phosphate solubilizers.
The principal component analysis (PCA) and hierarchical cluster analysis (HCA) was used to establish the statistical correlation of functional diversity with soil characteristic, host type and locations. The combinatorial assessment of diversity and correlational study with soil and host type may provide an information on the distribution and roles of PGPR in particular habitat. Such an approach can throw a light on absence, presence and abundance of beneficial and plant growth promoting micro-organisms at a selected locality and give us an idea on need of enrichment of the land with beneficial microbes. The study can also be useful in selecting the site according to the need and requirement of particular type of PGPR.
Bharuch, Diversity Indices, Hierarchical Cluster Analysis (HCA), Plant Growth
Promoting Rhizobacteria (PGPR), Principal Component Analysis (PCA).
Shah N. J, Borada D. N, Patel R, Patel A. Study on the Functional Diversity of Plant Growth-Promoting Rhizobacteria in Bharuch, Gujarat, India. Biosc.Biotech.Res.Comm. 2021;14(3).
Shah N.J, Borada D.N, Patel R, Patel A.Study on the Functional Diversity of Plant Growth-Promoting Rhizobacteria in Bharuch, Gujarat, India. Biosc.Biotech.Res.Comm. 2021;14(3). Available from: <a href=”https://bit.ly/3AuMQ3H“>https://bit.ly/3AuMQ3H</a>
Copyright © Shah et al., This is an open access article distributed under the terms of the Creative Commons Attribution License (CC-BY) https://creativecommns.org/licenses/by/4.0/, which permits unrestricted use distribution and reproduction in any medium, provide the original author and source are credited.
INTRODUCTION
Chemical fertilizers are currently utilized extensively by farmers as a supplement of basic nutritional requirement. However, extensive use of these fertilizers causes various hazardous environmental issues. Therefore, there is an urgent need to reduce or replace the utilization of chemical fertilizers without compromising plant yield and soil quality (Vejan et al. 2016; Kaneriya and Pattani 2021). The application of bioinoculants or plant growth promoting rhizobacteria (PGPR) as a biofertilizers is promising and alternative approach which has been employed in the field of agriculture (Santos et al. 2019; Lebrazi et al. 2020).
Different strategies have been utilized by PGPR to promote plant growth, like improvement of phosphate, zinc, potash uptake by solubilizing these complexes into plant usable and absorbable forms, fixation of atmospheric nitrogen, production of vitamins or phytohormones, suppression of plant diseases through competitive colonization etc. It is also necessary that farmers of both developing and developed countries have easy access of biofertilizers. Therefore, efforts are required to explore more diverse PGPR for their utilization as potent bio-fertilizers to improve the yield of different economically important crops (Tchakounté et al. 2018; Nosheen et al. 2021).
The study on PGPR diversity is an important aspect to acquaint knowledge about the unique feature of microorganisms that can be utilized for crop production (Costa et al. 2018). The study on PGPR diversity is also important in finding the availability and feasibility of the novel PGPR strain in the rhizosphere that can be exploited in inoculant formulation commercially (Shukla 2019).
Diversity indexes like the Simpson index, Shannon index (H’) and the equitability index (J’) have generally been used to describes the diversity of microbial communities as a mathematical point of view (Simpson 1949; Shannon and Weaver 1949; Pielou 1975). The rhizospheric zone of plants possess different types of PGPR and the trait of PGPR may vary according to the type of host. Therefore, it is necessary to correlate the PGPR trait with the type of host (Verma et al. 2019; Basu et al. 2021).
Overall, understanding of PGPR microbial diversity map for any region, is useful to arrive at assessment that can act as indicators for enhanced plant productivity and soil quality by formulating biofertilizers. An understanding of PGPR diversity is also useful in designing the customised biological inputs or inoculum for crops, depending on the scarcity of the specific functional macro or micro nutrient solubilizers.
Very less information is available on PGPR diversity of agricultural land from Bharuch district. In this context, the present study was aimed at isolation of PGPR from different locations of Bharuch district, estimation of diversity by calculating the diversity indices, correlational study of functional diversity with soil characteristics, host type and locations using PCA and HCA.
MATERIAL AND METHODS
All the reagents and media used under study were of analytical grade. Pikovskaya’s agar, Aleksandrow agar and Luria Bertani agar were purchased from Himedia, India. Jensen’s agar and Zinc solubilizing medium were prepared in laboratory.
Jensen’s agar was comprised of (g/L): sucrose, 20.0; Fe2(SO4)3·H2O, 0.1; K2HPO4, 0.5; MgSO4·7H2O, 0.5; NaCl, 0.5; CaCO3, 2.0; Na2MoO4·2H2O, 0.005; agar, 2.0 and pH, 7.2. Zinc solubilizing medium was comprised of (g/L): glucose, 10; ZnO, 1.0; (NH4)2SO4, 0.5; KCl, 0.2; yeast extract, 0.5; FeSO4·7H2O, 0.01; MnSO4, 0.01; K2HPO4, 0.5; agar, 2.0 and pH, 7.2. For sample collection and processing, rhizosphere soil samples were collected from nineteen different locations of Bharuch district, Gujarat (India).
These locations were Motali (L1), Safipura (L2), Sanjali (L3), Alonj (L4), Amboli (L5), Umarwada (L6), Samor (L7), Kharod (L8), Dhamrod (L9), Kosamdi (L10), Boridara (L11), Boidra (L12), Kondh (L13), Mahuvej (L14), Moti Pardi (L15), Narmada River (L16), Panoli (L17), Bakrol (L18) and Nandav (L19). Soil samples were collected by digging with intact root system and necessary information was recorded. The samples were kept in plastic bags and stored at 4°C until use. Soil electric conductivity (EC) and pH were measured before processing of soil samples.
For the isolation of PGPR, ten gram of soil sample was suspended in 90 ml of sterile normal saline in 250 ml flask and shaken at 150 rpm for 1 h at 37°C. The supernatant was then serially diluted and inoculated in selective media for the isolation and screening of desired PGPR. Using spread plate technique 0.1 ml of soil suspensions were spread on differential media viz. Jensen’s medium, Pikovskaya’s agar, Aleksandrow agar and Zinc solubilizing medium for the isolation of nitrogen fixers, phosphate solubilizers, potash solubilizers and zinc solubilizers, respectively.
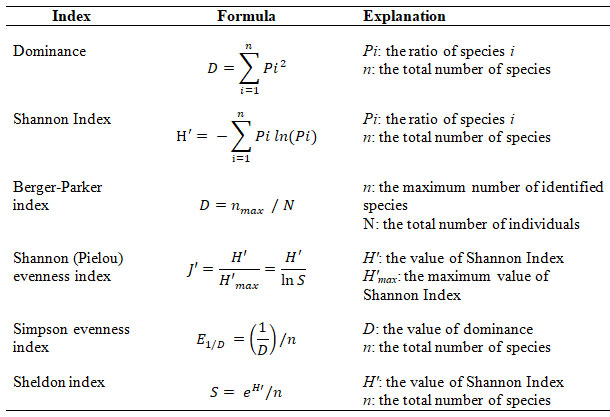
The plates were incubated at 28°C for 5-6 d. Different types of isolates were then selected based on morphological characteristics and solubilization. Isolates were further purified by sub-culturing on respective medium. Positive isolates were maintained on Luria Bertani agar slants. To determine the functional diversity and data analysis, the results obtained after isolation of PGPR were used to calculate diversity indices, Berger-Parker index and evenness metrics (Simpson 1949; Shannon and Weaver 1949; Sheldon 1969; Berger and Parker 1970; Pielou 1975).
The formula used for the calculations of biodiversity indices has been presented in Table 1. Principal component analysis (PCA) was used to determine the statistical correlation between soil characteristics and population diversity and, between the host family and population diversity. Hierarchical cluster analysis (HCA) was used to cluster the locations according to population diversity. PCA and HCA were performed using XLSTAT 8.0, Addinsoft statistical software.
Table 1. The formula used to calculate biodiversity indices.
RESULTS AND DISCUSSION
Bharuch district is located at 21.7°N 72.97°E with an average elevation of 15 meters near the banks of the river Narmada. Bharuch has tropical savanna climate and its weather is strongly moderated by the Arabian Sea. Monsoon season falls between the month of June to September and has about 800 millimeters of rain. The average maximum temperature during these months is about 32°C (90°F). The winter remains between the month of December to February with average temperatures of 23°C (73°F).
Major crops grown in this area are maize (Zea mays), sugarcane (Saccharum officinarum), pigeon pea (Cajanus cajan), wheat (Triticum aestivum), cotton (Gossypium hirsutum) and green gram (Vigna radiata). The natural vegetation of the area consisted of Prosopis juliflora, Prosopis cineraria, Azadirachta indica, Ziziphus mauritiana and Eucalyptus sp. (Jangir et al. 2018).
The present study was attempted to give information about functional diversity of PGPR from Bharuch district, Gujarat (India). Total 427 samples were collected from different nineteen locations of Bharuch district (Figure 1). The isolates showing differentiation in their colony morphology were selected, purified and tested for zone of solubilization (Figure 2).
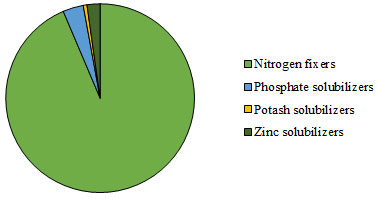
Total 3, 351 isolates were screened for PGPR trait. The number of PGPR isolated from different locations, showed maximum microbial population of nitrogen fixers (93.6%) followed by phosphate solubilizers (3.51%), zinc solubilizers (2.24%) and potash solubilizes (0.64%) (Figure 3). The diversity indices were evaluated to study the species evenness of PGPR in different locations of Bharuch district.
Figure 1: Map showing the sampling sites of Bharuch district (Source: District Profile 2021; https://bharuch.nic.in/district-profile/)
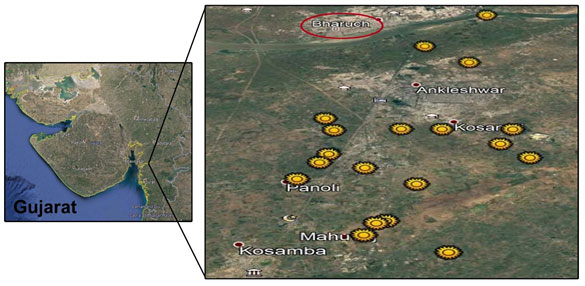
Figure 2: Photographs of different types of bacteria on specific medium. (A) nitrogen fixing bacteria, (B) phosphate solubilizing bacteria, (C) potash solubilizing bacteria and (D) zinc solubilizing bacteria with hollow zone of solubilization around the colonies
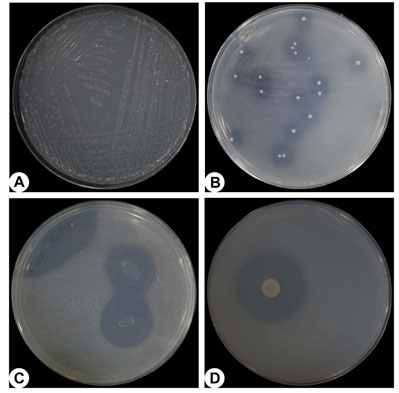
Figure 3: Diversity of PGPR from different locations of Bharuch district
The high value of Shannon index (H’) is an indication of more diversity. The zero value of H’ indicates that only one species or the same number of individuals represent the diversity (Kanieski et al. 2018).
In the present study, L17 shows the maximum H’ which clearly indicated that location L17 shows maximum diversity of PGPR followed by L1, L5 and L6. For the locations, L8, L9, L10 and L18, the value of H’ is 0.000 which indicates that these locations do not show any diversity. The value of H’ is generally observed between 1.5 and 3.5 and rarely exceed above 4.0 (Margalef 1972). In the present study, the low value of H’ may be due to smaller sample unit size.
Sometimes, interpretation becomes very much difficult due to narrowly constrained value of Shannon index (H’). For example, in L11 and L12, the values of Shannon index (H’) are 271 and 227, respectively. Here, it is difficult to interpret that whether these two locations have similar kind of diversity or have substantial variation. Several researchers have overcome this problem by using eH’ as a replacement of H’ (Kaiser et al. 2000; Jha et al. 2010).
Thus, the values of eH’ for the locations L11 and L12 becomes 1.255 and 1.569, respectively (Table 2). High value of Shannon evenness J’ signifies the equal distribution of individuals in all species. The value of J’ ranges from 0 to 1 and, if the value of J’ reaches to 1 indicates that all species are equally distributed (Kanieski et al. 2018). In present study, L17 shows higher value of J’ reflects the more uniform distribution of PGPR followed by L13. The locations L2, L8, L9 and L10 do not show any uniform distribution (Table 3).
Table 2. Diversity indices of PGPR from different locations of Bharuch district.
| Locations | Diversity indices | ||||||
| Shannon H’ | eH’ | Simpson 1/D | Simpson 1-D | Berger-Parker index | Mean | SD | |
| L1 | 0.675 | 1.964 | 1.490 | 0.329 | 0.811 | 1.054 | 0.747 |
| L2 | 0.000 | 1.000 | 1.000 | 0.000 | 1.000 | 0.600 | 0.577 |
| L3 | 0.163 | 1.177 | 1.080 | 0.074 | 0.962 | 0.691 | 0.586 |
| L4 | 0.232 | 1.263 | 1.133 | 0.117 | 0.938 | 0.737 | 0.595 |
| L5 | 0.637 | 1.891 | 1.514 | 0.340 | 0.800 | 1.036 | 0.728 |
| L6 | 0.566 | 1.761 | 1.412 | 0.292 | 0.833 | 0.973 | 0.692 |
| L7 | 0.077 | 1.080 | 1.030 | 0.029 | 0.990 | 0.641 | 0.579 |
| L8 | 0.000 | 1.000 | 1.000 | 0.000 | 1.000 | 0.600 | 0.577 |
| L9 | 0.000 | 1.000 | 1.000 | 0.000 | 1.000 | 0.600 | 0.577 |
| L10 | 0.000 | 1.000 | 1.000 | 0.000 | 1.000 | 0.600 | 0.577 |
| L11 | 0.271 | 1.312 | 1.166 | 0.142 | 0.923 | 0.763 | 0.601 |
| L12 | 0.227 | 1.255 | 1.127 | 0.113 | 0.940 | 0.732 | 0.594 |
| L13 | 0.451 | 1.569 | 1.385 | 0.278 | 0.833 | 0.903 | 0.651 |
| L14 | 0.077 | 1.080 | 1.030 | 0.029 | 0.985 | 0.640 | 0.579 |
| L15 | 0.543 | 1.722 | 1.385 | 0.278 | 0.842 | 0.954 | 0.683 |
| L16 | 0.229 | 1.257 | 1.104 | 0.094 | 0.951 | 0.727 | 0.594 |
| L17 | 0.959 | 2.610 | 2.329 | 0.571 | 0.579 | 1.410 | 1.003 |
| L18 | 0.000 | 1.000 | 1.000 | 0.000 | 1.000 | 0.600 | 0.577 |
| L19 | 0.232 | 1.261 | 1.107 | 0.097 | 0.950 | 0.729 | 0.595 |
Table 3. Evenness of PGPR from different locations of Bharuch district.
| Locations | Value index | ||||
| Shannon evenness J’ | Simpson evenness E1/D | Sheldon
S |
Mean | SD | |
| L1 | 0.487 | 0.372 | 0.491 | 0.450 | 0.068 |
| L2 | 0.000 | 1.000 | 1.000 | 1.000 | 0.000 |
| L3 | 0.235 | 0.540 | 0.589 | 0.455 | 0.192 |
| L4 | 0.337 | 0.566 | 0.632 | 0.512 | 0.155 |
| L5 | 0.580 | 0.505 | 0.603 | 0.572 | 0.063 |
| L6 | 0.515 | 0.471 | 0.587 | 0.524 | 0.059 |
| L7 | 0.112 | 0.515 | 0.540 | 0.389 | 0.240 |
| L8 | 0.000 | 1.000 | 1.000 | 1.000 | 0.000 |
| L9 | 0.000 | 1.000 | 1.000 | 1.000 | 0.000 |
| L10 | 0.000 | 1.000 | 1.000 | 1.000 | 0.000 |
| L11 | 0.391 | 0.583 | 0.656 | 0.543 | 0.137 |
| L12 | 0.327 | 0.564 | 0.627 | 0.506 | 0.158 |
| L13 | 0.650 | 0.692 | 0.785 | 0.709 | 0.070 |
| L14 | 0.112 | 0.515 | 0.540 | 0.389 | 0.240 |
| L15 | 0.495 | 0.462 | 0.574 | 0.510 | 0.058 |
| L16 | 0.208 | 0.368 | 0.419 | 0.332 | 0.110 |
| L17 | 0.873 | 0.776 | 0.870 | 0.840 | 0.055 |
| L18 | 0.000 | 1.000 | 1.000 | 1.000 | 0.000 |
| L19 | 0.211 | 1.000 | 0.420 | 0.544 | 0.409 |
The Berger-Parker index is just a measurement of dominance (Berger and Parker 1970). High value of Berger-Parker index is an indication of maximum dominance and least diversity. In present study maximum values are observed for L2, L8, L9, L10 and L18. These locations are dominant in nitrogen fixers except L18 which has shown dominant trait for phosphate solubilizers. However, these locations were not diverse for different types of PGPR (Table 2). The Simpson index gives an idea about the difference in species abundance distribution. The dominance of one species to that of other species can be calculated by D = Pi2.
The diversity decreased as the value of dominance D increased. Therefore, Simpson index is generally stated as 1/D of 1-D and the value of which can be rise as the grouping becomes more even. In present study, the value of Simpson index was found to be highest in L17 representing the highest diversity followed by L5. Simpson index is not truly talking about absolute evenness although it highlights the dominance in diversity. Therefore, a separate measure called Simpson evenness, E1/D can be taken into consideration which measures the relative species abundance. In present study, the value of E1/D was higher in L2, L8, L9, L10, L18 and L19 (Table 3).
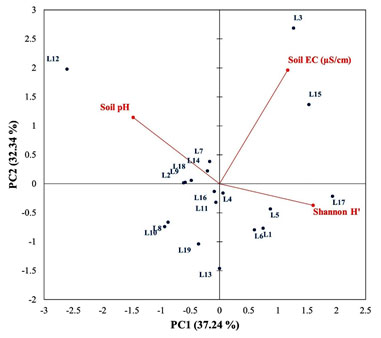
Out of these locations, L2, L8, L9, L10 and L19 showed the relative abundance for nitrogen fixers whereas L18 shows the relative abundance of phosphate solubilizers. Sheldon index is another diversity index which reflects a perfectly even abundance distribution and generally varies between 0 to 1 (Sheldon 1969). According to Sheldon index, L2, L8, L9, L10 and L18 were evenly abundantly distributed. In present study, these locations reflected the abundant distribution of either nitrogen fixers or phosphate solubilizes only. PCA was studied to investigate the statistical correlation of PGPR diversity with soil characteristics (soil pH and EC) and host type (host family). The PCA biplot presenting the interaction of Shannon diversity (H’) with soil pH and EC has been shown in Figure 4.
Total 69.57% of variation was accounted by principal components (PC). Out of which, 37.24% and 32.34% of the total variation was accounted by PC1 and PC2, respectively. Soil pH did not show any correlation with Shannon diversity (H’) whereas soil EC had influenced the PGPR diversity by 5.5%. This can be ascribed by the reason that the almost uniform soil characteristics of targeted locations explored in present study.
Figure 4: PCA biplot showing the statistical interactions of soil characteristics (soil pH and soil EC) with diversity index (H’)
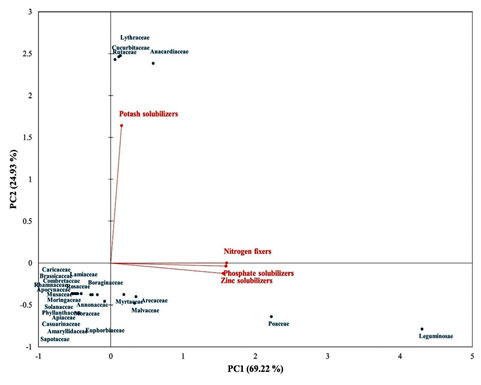
The PCA biplot displaying the interaction of PGPR diversity with host family has been shown in Figure 5. Total 94.15% of variation was accounted by principal components (PC). Out of which, 69.22% and 24.93% of the total variation was accounted by PC1 and PC2, respectively. The maximum diversities of nitrogen fixers, phosphate solubilizers and zinc solubilizers were obtained from the host plants belonging to family Leguminosae followed by Poaceae and Malvaceae.
The highest diversity of potash solubilizers were obtained from the host plants belonging to the families Rutaceae, Anacardiaceae, Lythraceae and Cucurbitaceae. This kind of correlation study may helpful in selecting the host plant for achievement of maximum diversity of PGPR or particular type of PGPR.
Figure 5: PCA biplot showing the statistical interactions of PGPR with host
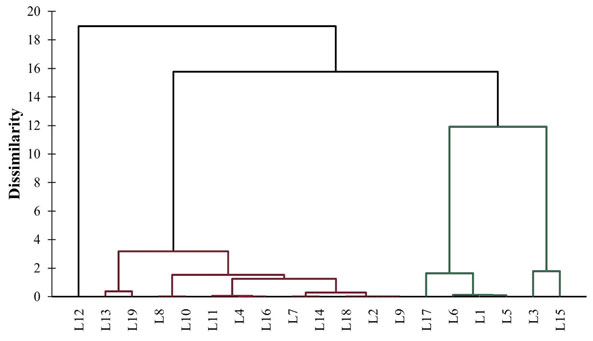
In addition to PCA, HCA was also studied to cluster the different locations of Bharuch district according to maximal diversity of PGPR. The HCA dendrogram showed the clustering of different locations of Bharuch district according to PGPR diversity and has been presented in Figure 6. The locations have been grouped into three different clusters. Cluster 1 includes L1, L3, L5, L6, L15 and L17; Cluster 2 includes L2, L4, L7, L8, L9, L10, L11, L13, L14, L16, L18 and L19; and Cluster 3 includes only L12. Cluster 1 was diverse from Cluster 2 which in turn diverse from Cluster 3. Moreover, Cluster 1 showed the maximum diversity of all four types of PGPR. So, the locations fall in this cluster can be explored for in depth study. This information may helpful in selecting the locations according to PGPR variations.
Figure 6: HCA dendrogram showing the clustering of locations according to PGPR diversity
Overall, it was observed that the soil of Bharuch district is deficient in potash solubilizing microorganism (Figure 3). So, the focus should be much more on amendments of potash solubilizing microorganisms throughout the Bharuch district. Similarly, some clusters of Bharuch district were deficient in phosphate solubilizer where as others were deficient in zinc solubilizers. Therefore, PGPR diversity according to cluster may helpful in getting the knowledge about the PGPR deficiency of soil.
Additionally, the type of PGPR may vary with the type of host. For example, in present study, the potash solubilizers were obtained from the plants belonging to Rutaceae, Anacardiaceae, Lythraceae and Cucurbitaceae family. Host specific PGPR knowledge may helpful in improving the soil health and microflora by selective crop rotation according to the need and deficiency of soil. So, in depth studies are also required on host specific PGPR (Kanieski et al. 2018).
Currently, farm land soil analysis is promoted by the government agencies in many countries to ascertain the nutrient deficiency for specific reasons depending on the type of soil. This data is used to recommend the specific micronutrients which can be added to overcome the deficiency in an economical way rather than applying a mixture of multiple nutrients which are actually not needed. If similar approach is applied to recommend function specific PGPR depending on the functional deficiency can effectively reduce the input cost in sustainable cultivation technique using PGPR.
The PGPR diversity data can be prepared according to clusters. Recommendation can be given based on the deficiency of PGPR in a particular cluster which can lead to higher cost to benefit ratio of biological inputs. In India, massive projects are going on for preparing the soil health card of agriculture land by the government where periodic soil analysis is carried out. If the functional diversity parameters are added in existing system it can generate a detailed data base on the basis of which recommendation can be made for sustainable agriculture promoted by PGPR (Kanieski et al. 2018; Basu et al. 2021).
On the basis of the study, microbial fertilizers manufacturing industries can build a capacity of mass multiplication of functional inoculum and organised distribution network can be established cluster wise. Moreover, it is also important for farmers to know the type of PGPR present in particular locations/clusters, so that farmers can know the quantity and type of biofertilizers they should add to optimize the crop production and yield. The farmers can choose the PGPR products on the basis of the functional requirement rather than using consortium of multiple PGPR. If farmers start getting visible and consistent solution by proper use of PGPR, it can reduce the use of chemical fertilizers which in turns can benefit the soil and nature at great extent (Basu et al. 2021).
CONCLUSION
The finding of the present study gives an idea about the distinctive location of Bharuch district for highest diversity of PGPR. Looking toward the diversity data, Panoli (L17) followed by Motali (L1) seems more diverse and even for all types of PGPR. The soil collected from rhizosphere of host plants belonging to family Leguminosae, Poaceae and Malvaceae has shown maximum diversity. Therefore, future investigation will focus on detail diversity study of PGPR collected from rhizosphere of host plants belonging to family Leguminosae, Poaceae and Malvaceae from Panoli and Motali locations of Bharuch district. The functional diversity of PGPR from Bharuch district is reported for the first time. The study will helpful to other researcher for development of biofertilizer.
ACKNOWLEDGMENTS
This study was financially supported by Agri Biochem Research Lab, M/s. Pushpa J. Shah, Panoli, Gujarat, India. Authors thank them for their support to carry out the research work We would like to acknowledge a team of Agri Biochem Research Lab who helped us in sample collections also.
Conflict of Interest: Authors declare no conflicts of interests to disclose.
REFERENCES
Basu, A., Prasad, P., Das, S. N., et al. (2021). Plant growth promoting rhizobacteria (PGPR) as green bioinoculants: recent developments, constraints, and prospects. Sustainability, 13(3), 1140.
Berger, W. H. and Parker, F. L. (1970). Diversity of planktonic foraminifera in deep-sea sediments. Science, 168(3937), 1345-1347.
Costa, O. Y., Raaijmakers, J. M. and Kuramae, E. E. (2018). Microbial extracellular polymeric substances: ecological function and impact on soil aggregation. Frontiers in Microbiology, 9, 1636.
Bharuch.nic.in. (2021). District Profile. [online] Available at: <https://bharuch.nic.in/> [Accessed 27 April 2021].
Jangir, A., Sharma, R. P., Tiwari, G., et al. (2018). Characterization and Classification of Soils of Bharuch Taluka in Bharuch District of Gujarat. Agropedology, 28(02), 86-96.
Jha, C. K., Patel, D., Rajendran, N. et al. (2010). Combinatorial assessment on dominance and informative diversity of PGPR from rhizosphere of Jatropha curcas L. Journal of basic microbiology, 50(3), 211-217.
Kaiser, M. J., Ramsay, K., Richardson, C. A., et al. (2000). Chronic fishing disturbance has changed shelf sea benthic community structure. Journal of Animal Ecology, 69(3), 494-503.
Kaneriya, J. P. and Pattani, V. B. (2021). Screening and Isolation of Plant Growth-Promoting Bacteria from Forest and Coastal Regions of Saurashtra, Gujarat. Bioscience Biotechnology Research Communications, 14(1), 410-415.
Kanieski, M. R., Longhi, S. J. and Soares, P. R. C. (2018). Methods for biodiversity assessment: case study in an area of Atlantic Forest in Southern Brazil. In Selected Studies in Biodiversity, 46-58.
Lebrazi, S., Fadil, M., Chraibi, M. et al. (2020). Screening and optimization of indole-3-acetic acid production by Rhizobium sp. strain using response surface methodology. Journal of Genetic Engineering and Biotechnology, 18(1), 1-10.
Margalef, R. (1972). Homage to Evelyn Hutchinson, or why there is an upper limit to diversity. Connecticut Academy of Arts and Sciences.
Nosheen, S., Ajmal, I. and Song, Y. (2021). Microbes as biofertilizers, a potential approach for sustainable crop production. Sustainability, 13(4), 1868.
Pielou, E. C. (1975). Ecological Diversity Wiley & Sons. Wiley InterScience, 8, 165.
Santos, M. S., Nogueira, M. A. and Hungria, M. (2019). Microbial inoculants: reviewing the past, discussing the present and previewing an outstanding future for the use of beneficial bacteria in agriculture. AMB Express, 9(1), 1-22.
Sheldon, A. L. (1969). Equitability indices: dependence on the species count. Ecology, 50(3), 466-467.
Shukla, A. K. (2019). Ecology and diversity of plant growth promoting Rhizobacteria in agricultural landscape. In PGPR Amelioration in Sustainable Agriculture, 1–15.
Simpson, E. H. (1949). Measurement of diversity. Nature, 163(4148), 688-688.
Tchakounté, G. V. T., Berger, B., Patz, S., et al. (2018). Community structure and plant growth-promoting potential of cultivable bacteria isolated from Cameroon soil. Microbiological Research, 214, 47-59.
Vejan, P., Abdullah, R., Khadiran, T., et al. (2016). Role of plant growth promoting rhizobacteria in agricultural sustainability-a review. Molecules, 21(5), 573.
Verma, M., Mishra, J. and Arora, N. K. (2019). Plant growth-promoting rhizobacteria: diversity and applications. In Environmental biotechnology: for sustainable future, 129–173.

