Gole AR![]() , RA Pandey
, RA Pandey![]() , RV Sankpal
, RV Sankpal![]() , and LP Arjugade*
, and LP Arjugade*![]()
Department of Animal Genetics and Breeding, College of Veterinary and Animal Science, Parbhani and Maharashtra Animal and Fishery Science University, Nagpur (MS) India
Corresponding author email: roshanipandey777@gmail.com
Article Publishing History
Received: 15/04/2020
Accepted After Revision: 22/05/2020
The genetic diversity of most livestock species is reducing and it is not possible to preserve all livestock breeds. The blood samples for isolation of genomic DNA were collected from NRCC, Bikaner and Field. The genomic DNA was isolated by phenol-chloroform extraction method with minor modification. The Qualitative and Quantitative estimation of genomic DNA was determined by spectrophotometer and agarose gel electrophoresis. The polymerase chain reaction using eleven microsatellite primer pairs was done for amplification of microsatellite loci. PCR products were electrophoresed in 1% agarose gel in 1X TBE buffer system. Eight out of eleven microsatellite primer pairs were optimized. Primers VOLP-03, VOLP-10, YWLL-38, YWLL-44, YWLL-58, VOLP-32, LCA-37 and YWLL-46 amplified the specific bands. Number of alleles ranged from two to five was observed in Bikaneri, Jaisalmeri and Kachchhi camels at five microsatellite loci. The most polymorphic primers were VOLP-10 and VOLP-03 in which a total of 5 Bikaneri camels ranged from 0.28 to 0.741. The expected heterozygosity in at the locus YWLL-44 followed by YWLL-38 in Bikaneri camel. Rest of the three microsatellite loci viz. VOLP-03, VOLP-10 and YWLl-58 revealed more than 58% expected heterozygosity. This indicates that the above five primers can very well be utilized for further genetic studies, which may include characterization, conservation and production enhancement.
Bikaneri Camel, Electrophoresis, Jaisalmeri Camel, Kachchhi Camel and Microsatellite Marker, PCR, Primers.
Gole A. R, Pandey R. A, Sankpal R. V, Arjugade L. P. On the Allelic Variation and Heterozygosity of Bikaneri, Jaisalmeri and Kachchhi Camels using Microsatellite Markers. Biosc.Biotech.Res.Comm. 2020;13(2).
Gole A. R, Pandey R. A, Sankpal R. V, Arjugade L. P. On the Allelic Variation and Heterozygosity of Bikaneri, Jaisalmeri and Kachchhi Camels using Microsatellite Markers. Biosc.Biotech.Res.Comm. 2020;13(2). Available from: https://bit.ly/2KjJsk5
Copyright © Gole et al., This is an open access article distributed under the terms of the Creative Commons Attribution License (CC-BY) https://creativecommns.org/licenses/by/4.0/, which permits unrestricted use distribution and reproduction in any medium, provide the original author and source are credited.
INTRODUCTION
The world population of camel is 35.0 million. Somalia has highest camel population ie 7.15 million followed by Sudan 4.79 million. Ethiopia 1.16 million, India has 0.38 million and ranks 12th in World. (FAO, 2012) Rajasthan state has 3.26 lakhs and ranks 1st in country. (Livestock sensor, SOI, 2012).
Camel has the ability to sustain water scarcity condition and has excellent adaptive mechanism. Camels are being used by the poor farmers in villages and cite to earn their livelihood. Camel is beast of burden and provider of milk, meat, and hides. The camel has shown to be better adapted to extreme conditions in most aspects than other domestic ruminants (Al-Baka, 2016). Camel is used for short distance transportation and for agricultural operations. Camels are able to sustain 20 to 22 per cent of body weight loss during severe scarcity conditions where as other livestock species (cattle, buffaloes) cannot sustain beyond 10 to 12 per cent loss in body weight. For survival in desert environment, camels have physiological, anatomical and behavioral adaptation mechanisms. Water conservation ability, the unique features of blood, thermoregulation, and efficient digestion and metabolism are among the physiological adaptations, (Gebreyohanes and Assen, 2017 Liang et al 2020).
Bikaneri breed is developed by selective interbreeding of Sindhi, Baluchi. Afghan and Indigenous camels. Breed characterization at the phenotypic and molecular genetic level has become essential to know the present status of different species and their breeds in different ago climatic zones. Due to extensive cross breeding, Indigenous breeds with unique genetic characteristics are declining numerically and are at risk. Genetic characterization can play a major role in preventing the erosion and Genetic Diversity, which is a part of earth’s natural heritage. The loss of a unique breed is an irreplaceable reduction in natural profusion of life forms.
MATERIAL AND METHODS:
Collection of Blood and DNA isolation
Venous blood was collected from unrelated Bikaneri, Jaisalmeri and Kachchhi camels, maintained at the National Research Center Camel, Bikaner and from breeding tract of respective breed. EDTA was used as an anticoagulant. Blood samples were transported on ice and kept at 4º c until use. The genomic DNA was isolated by using Phenol- chloroform method. The DNA samples were stored at 20 º c for further use by adding sufficient amount of TE buffer. (Cao et al., 2009)
Electrophoresis PCR method
The master mix for optimization of PCR was prepared as (25µl reaction volume) Genomic DNA (template) 50ng, Primer 5pmol, dNTP 0.25mM each, Taq DNA polymerase 1.5U, Taq polymerase buffer 10X 2.5µl. Subsequent to optimization of microsatellite loci the protocol used is as (12.5µl reaction volume), Genomic DNA (template) 50ng, Primer 5pmol, Taq DNA polymerase 0.75U, Taq polymerase buffer 10X 1.25µl.
In a 200ml PCR tube 24µl of PCR mix was taken and subsequently 50ng of genomic DNA was added. PCR amplification was carried out in a thermal cycler at 95 º c for 5 minutes. Followed by 30cycles each 94 º c for 45 seconds, 58 º c for 1 minute, and 72 º c for 1 minute with final extension at 72 º c for 15 minutes.
The PCR amplified products were resolved by denaturing sequencing gel electrophoresis using Sequi-Gen GT electrophoresis apparatus. The properly cleaned and wiped with ethanol assembly taken and arranged properly. The gel was prepared by using constituents as Acrylamide 11.4gm, Bis-acrylamide 0.6gm, 10X TBE 10ml, urea 84gm, Distilled water to make 200ml. This mixture was filtered by 3mm Whatmann filter paper to remove undissolved particles. Freshly prepared 10% ammonium per sulfate solution 500µl was dissolved and 40µl TEMED was added. The gel was sucked up into a barrel of 120ml syringe without any air bubble. The gel then pushed into the assembly with taking care of any trapping of air bubbles. The gel was polymerized for 60 minutes at room temperature.
Then the lower and upper buffer tanks of the electrophoresis apparatus were filled with 1X TBE. The gel was then pre run at constant temperature of 72 º c at 150volt current for 45 minutes. Then the samples 1.5 to 3µl PCR product was mixed with an equal amount of 2X formamide dye. The samples were heated to 95 º c for 5 minutes for denaturation of DNA and immediately transferred on ice. The product was loaded slowly in the wells. DNA ladder (50bp) was loaded along the side of sample as size marker. Then gel was allowed to run at constant voltage (75W) for 1 to 2 hours depending upon the allele size. On completion of electrophoresis, power was turned off. The gel assembly was dismantled. Then the gel was stained with silver nitrate. The gel was fixed in fixer solution for 20 minutes, then impregnated with staining solution for 30 minutes. The tray was kept in dark; the tray was regularly agitated. Then the gel was incubated in chilled developer solution. After appearance of bands, the reaction was stopped with 10% acetic acid solution. Then the gel was washed with distilled water for 2 minutes. The Whatmann filter paper (3mm) sheet was laid on the gel and gently pressed with a tissue paper flat so that the gel stuck to the paper. The gel was then dried under vacuumed at 80 º c for 45minutes to 1 hour.
Kim et al. (2002) evaluated the genetic diversity of northeast Asian cattle based on microsatellite data. Thirteen microsatellite loci were analyzed for a total of 200 individuals including Korean, Chinese, Japanese Black and European Holstein cattle. Observed and expected heterozygosity, two estimators (F st and G st) of gene differentiation and Nei’s DA distance were evaluated. The lowest genetic diversity was exhibited in Japanese Black cattle (HE=0.471), Korean cattle reveled relatively high degree of genetic diversity (HE=0.728).
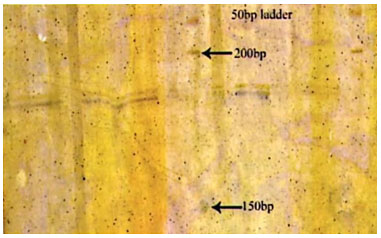
The scoring was done manually by comparing the band size with the standard 50bp ladder. Wu Wei et al. (2001) reported the genetic structure of five Chinese and foreign cattle breeds using microsatellite DNA markers. Genetic structure including gene frequency, heterozygosity, PIC, numbers of effective alleles and genetic distance were studied in five cattle types ( Nan yang, Yanbian, Han woo, Simmental and Piemontese) using four microsatellite markers. Cluster analysis was conducted based on microsatellite polymorphism,(Drabik et al., 2016).
General PCR Program
PCR involves a process of heating and cooling called thermal cycling which is carried out by machine. There are three main stages as follow,
- Denaturing: when the double stranded template DNA is heated to separate it into two single strands.
- Annealing: When the temperature is lowered to enable the DNA primers to attach to the template DNA.
- Extending: When the temperature is raised and the new strand of DNA is made by the Taq polymerase enzyme.
These three stages are repeated 20 to 40 times, doubling the number of DNA copies each time.
RESULTS AND DISCUSSION
PCR is a method for amplifying specific DNA sequences in in vitro conditions. PCR makes possible the genetic analysis of tiny samples of DNA by a relatively simple process.
The micro satellite primers were used to amplify the specific bands by making little variation in the annealing temperature and cycling conditions in PCR.
The number of alleles at different marker loci and their frequencies are simple indicators of the genetic variability.
At YWLL 38 microsatellite locus, three numbers of alleles with allele size ranging from 180 bp186bp were observed in DNA samples of Bikaneri, Jaisalmeri and Kachchhi breeds (Table 1, 2 and 3). The allele size range reported by Lang et al. (1996) is in close agreement with the present findings. However, Jailin et al. (2000) reported four numbers of alleles in the size range of 185bp-190bp in dromedary.
At YWWLL 46 microsatellite locus a single band of 99bp. At VOLP-32 microsatellite locus, a single band of 260bp. And at LCA-37 microsatellite locus a single band of 178bp. was observed Bikaneri, Jaisalmeri and Kachchhi breeds (Table 1). Similar band size at these microsatellite loci has been reported by Lang et al. (1996) and Pendo et al. (1998). However, these loci have been polymorphic in new world camelids but they were observed to be monomorphic in Indian dromedary. This indicates that the genetic variation is relatively less in Indian dromedary population. Variation in the number of alleles and their frequencies, reported in this study and by many other works, within breeds over different markers indicated existence of genetic variation within and among species. The number of alleles and allele frequency could be of tremendous use in calculating the genetic distance between different strains or breeds of livestock species.
Heterozygosity is an appropriate measure of genetic variability within a population. At microsatellite locus VOLP-03, expected heterozygosity and polymorphic information content were observed to be 0.741 and 0.675, respectively in thirty samples of Bikaneri breed (Table 4). However, in Jaisalmeri breed expected heterozygosity and polymorphic information content were observed to be 0.573 and 0.522 respectively, In Kachchhi breed, expected heterozygosity and polymorphic information contents were observed to be 0.515 and 0.460, respectively. Similar, expected heterozygosity and PIC in alpacas has been reported by Oberque et al. (1998) and in dromedary by Jianlin et al. (2000).
At VOLP- 10 microsatellite locus, expected heterozygosity and PIC were observed to be 0.695 and 0.642, respectively in thirty samples of Bikaneri breed (Table 4). However, the expected heterozygosity and PIC in Jaisalmeri breed were observed to be 0.686 and 0.621 and in Kachchhi
0.694 and 0.560 respectively (Table 5 and 6). The expected heterozygosity (0.569) and PIC value (0.521) reported in alpaca by Oberque et al. (2000) reported relative higher expected heterozygosity (0.75) in dromedary camels due to the existence of higher genetic variation as replaced by a greater number of allies at this locus in the population studied.
At YWLL 44 microsatellite locus, expected heterozygosity and PIC were observed to be 0.280 and 0.239, respectively in thirty samples of Bikaneri breed (Table 4). However, in Jaisalmeri and Kachchhi breed they were observed to be 0.218 and 0.914 and 0.320 and 0.270 respectively (Table 5 and 6). However, higher PIC (0.845) in alpacas and lamas and expected heterozygosity (0.66) in dromedary camel have been reported by Lang et al. (1996) and Jianlin et al. (2000). The higher PCI and expected heterozygosity were expected due to the same reasons as explained above.
At YWLL 58 microsatellite locus, expected heterozygosity and PIC were observed to be 0.616 and 0.540, respectively in thirty samples of Bikaneri breed (Table 4). However, in Jaisalmeri and Kachchhi breed they were observed to be 0.606 and 0.620 and 0.50 respectively (Table 5 and 6). The present results are in close agreement with the findings (PCI = 0.06) of Lang et al. (1996) in Alpacas and llamas.
At YWLL 38 microsatellite locus, expected heterozygosity and polymorphic information content were observed to 0.45 and 0.44 respectively in Bikaneri breed (Table 4).
However, in Jaisalmeri and Kachchhi breed, the expected heterozygosity and PIC were observed to be 0.57 and 0.475 and 0.522 and 0.420 respectively (Table 5 and 6). The present investigation in Bikaneri camel, the expected heterozygosity was lowest (0.28) at the locus YWLL -44 followed by YWLL -38 with the expected heterozygosity of 0.54 Rest of the three microsatellite loci viz. VOLP -03, VOLP-10 and YWLL -38 with the expected heterozygosity of 0.57. Rest of the three microsatellite loci viz. VOLP-03, VOLP-10 and YWLL-58 expected heterozygosity was more than 57%. In case of Kachchhi camel, the expected heterozygosity was lowest (0.32) at the locus YWLL-44 followed by VOLP -03 with expected heterozygosity of 0.515. Rest of the three microsatellite loci viz. VOLP-10, YWLL-58 and YWLL-38 expected heterozygosity was more than 52%. This indicates that the above five primers can very well be utilized for further genetic studies, which may include characterization, conservation and production enhancement.
The information derived from microsatellite marker study for individual breed may help the conservation scientists in deciding the purity of the breed and to take necessary steps for in vitro and in vivo conservation of the breed.
Table 1. Allele number, allele size and allele frequency at five microsatellite loci in Bikaneri camel.
| Locus | No. of
Samples(n) |
Allele No. | Allele size and Allele frequency | ||||
| A | B | C | D | E | |||
| VOLP-
03 |
30 | 5 | 168bp
0.08 |
166bp
0.33 |
148bp
0.05 |
147bp
0.28 |
145bp
0.25 |
| VOLP-
10 |
30 | 5 | 265bp
0.1 |
263bp
0.05 |
261bp
0.4 |
252bp
0.35 |
250bp
0.1 |
| YWLL-
44 |
30 | 2 | 107bp
0.027 |
104bp
0.69 |
– | – | – |
| YWLL-
58 |
30 | 3 | 177bp
0.316 |
175bp
0.5 |
173bp
0.183 |
– | – |
| YWLL-
38 |
30 | 3 | 186bp
0.5 |
182bp
0.45 |
180bp
0.05 |
– | – |
| YWLL-
46 |
30 | 1 | 99bp | – | – | – | – |
| VOLP-
32 |
30 | 1 | 260bp | – | – | – | – |
| LCA-37 | 30 | 1 | 178bp | – | – | – | – |
Table 2. Allele number, allele size and allele frequency at five microsatellite loci in Jaisalmeri camel.
| Locus | No. of
Samples(n) |
Allele No. | Allele size and Allele frequency | ||||
| A | B | C | D | E | |||
| VOLP-
03 |
15 | 3 | 168bp
0.270 |
166bp
0.170 |
148bp
0.570 |
— | — |
| VOLP-
10 |
13 | 4 | — | 263bp
0.038 |
261bp
0.346 |
252bp
0.346 |
250bp
0.270 |
| YWLL-
44 |
12 | 2 | 107bp
0.125 |
104bp
0.875 |
— | — | — |
| YWLL-
58 |
13 | 3 | 177bp
0.153 |
175bp
0.500 |
173bp
0.346 |
— | — |
| YWLL-
38 |
18 | 3 | 186bp
0.416 |
182bp
0.50 |
180bp
0.08 |
— | — |
Table 3. Allele number, allele size and allele frequency at five microsatellite loci in Kachchhi camel.
| Locus | No. of
Samples(n) |
Allele No. | Allele size and Allele frequency | ||||
| A | B | C | D | E | |||
| VOLP-
03 |
10 | 3 | 168bp
0.2 |
166bp
0.150 |
148bp
0.650 |
— | — |
| VOLP-
10 |
7 | 4 | 265bp
0.071 |
— | 261bp
0.357 |
252bp
0.357 |
250bp
0.214 |
| YWLL-
44 |
10 | 2 | 107bp
0.2 |
104bp
0.8 |
— | — | — |
| YWLL-
58 |
7 | 3 | 177bp
0.214 |
175bp
0.5 |
173bp
0.285 |
— | — |
| YWLL-
38 |
18 | 3 | 186bp
0.450 |
182bp
0.527 |
180bp
0.028 |
— | — |
Table 4: Heterozygosity and polymorphic information content at five microsatellite loci in Bikaneri camel.
| Locus | Observed
Heterozygosity |
Nei’s Expected
Heterozygosity |
PIC Value |
| VOLP-03 | 0.43 | 0.741 | 0.675 |
| VOLP-10 | 0.80 | 0.695 | 0.642 |
| YWLL-44 | 0.33 | 0.280 | 0.239 |
| YWLL-58 | 0.10 | 0.616 | 0.540 |
| YWLL-38 | 0.63 | 0.545 | 0.440 |
Table 5. Heterozygosity and polymorphic information content at five microsatellite loci in Jaisalmeri camel.
| Locus | Observed
Heterozygosity |
Nei’s Expected
Heterozygosity |
PIC Value |
| VOLP-03 | 0.466 | 0.573 | 0.522 |
| VOLP-10 | 0.460 | 0.686 | 0.621 |
| YWLL-44 | 0.250 | 0.218 | 0.194 |
| YWLL-58 | 1.00 | 0.606 | 0.528 |
| YWLL-38 | 0.660 | 0.570 | 0.475 |
Table 6. Heterozygosity and polymorphic information content at five microsatellite loci in Kachchhi camel.
| Locus | Observed
Heterozygosity |
Nei’s Expected
Heterozygosity |
PIC Value |
| VOLP-03 | 0.70 | 0.515 | 0.46 |
| VOLP-10 | 0.85 | 0.694 | 0.56 |
| YWLL-44 | 0.40 | 0.32 | 0.27 |
| YWLL-58 | 1.0 | 0.62 | 0.50 |
| YWLL-38 | 0.611 | 0.522 | 0.42 |
Figure 1: Photograph showing alleles at microsatellite locus (VOLP-03) in Jaisalmeri, Bikaneri and Kachchhi camel.
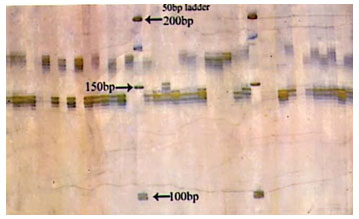
Figure 2: Photograph showing alleles at microsatellite locus (VOLP-10) in Jaisalmeri, Bikaneri and Kachchhi camel.
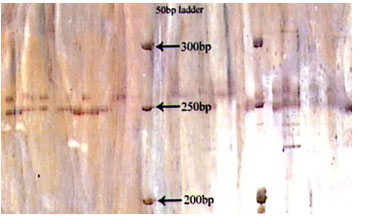
Figure 3: Photograph showing alleles at microsatellite locus (YWLL-44) in Jaisalmeri, Bikaneri and Kachchhi camel.
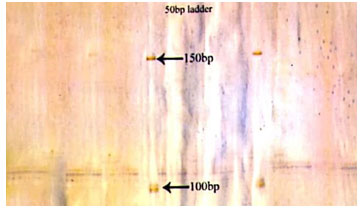
Figure 4: Photograph showing alleles at microsatellite locus (YWLL-58) in Jaisalmeri, Bikaneri and Kachchhi camel.
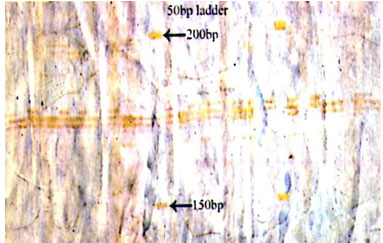
Figure 5: Photograph showing alleles at microsatellite locus (YWLL-38) in Jaisalmeri and Kachchhi camel.
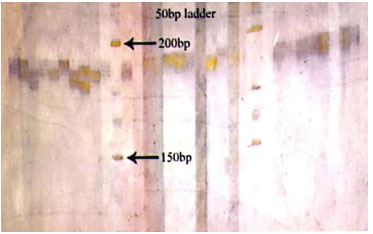
Figure 6: Photograph showing alleles at microsatellite locus (YWLL-38) in Jaisalmeri and Bikaneri camel.
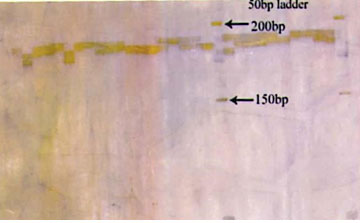
Figure 7: Photograph showing alleles at microsatellite locus (YWLL-38) in Bikaneri camel.
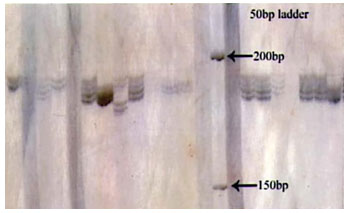
Figure 8: Photograph showing alleles at microsatellite locus (VOLP-32) in Bikaneri camel.
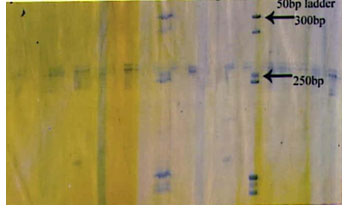
Figure 9: Photograph showing alleles at microsatellite locus (YWLL-46) in Bikaneri camel.
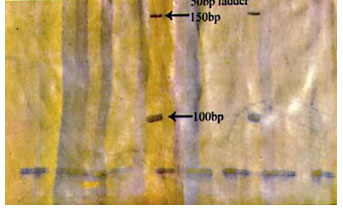
Figure 10: Photograph showing alleles at microsatellite locus (YWLL-46) in Jaisalmeri and Kachchhi camel.
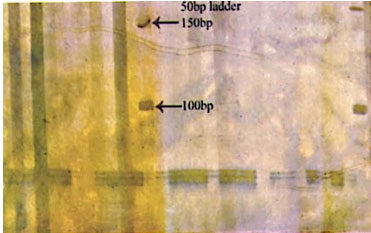
Figure 11: Photograph showing alleles at microsatellite locus (LCA-37) in Jaisalmeri, Bikaneri and Kachchhi camel
ACKNOWLEDGEMENT
The authors are thankful to the department of Animal Genetics and Breeding unit. NRCC Bikaner for allowing and providing financial assistance to carry out the research.
REFERENCES
Al-Baka H. (2016). Iraqi colloquium on camel diseases and Management. College of Veterinary Medicine/ Al Muthanna University, 64-69.
Cao G., Mo Q. and Chen F (2009). Genomic DNA isolation by Phenol- Chloroform extracting method from sheep blood clot. Agricultural Science and technology- Hunan. Vol. 10 No. 5 pp. 76-78.
Dabrik A., Bodzoń-Kutakowska A. and Silberring J. (2016). Gel Electrophoresis. In: Protiomic Profiling and Analytical Chemistry pp. 115-143. AGH University of Science and Technology, Krakow, Poland; Polish Academy of sciences, Zabrze, Poland.
Gautam K. (2002). Microsatellite marker studies for genetic characterization in Bikaneri camel. Unpublished M. V. Sc thesis, Rajasthan Agricultural University, Bikaner.
Gautam L. (2002). Genetic characterization of Jaisalmeri camel using microsatellite markers. Unpublished M. V. Sc thesis, Rajasthan Agricultural University, Bikaner.
Gebreyohanes M. and Assen A. (2017). Adaptation Mechanisms of Camels (Camelus dromedarius) for Desert Environment: A Review. Journal of Veterinary Science and Technology. Volume 8, Issue 6.
Jianlin H., Mburu D., Ochieng J., Kaufmann B., Rege J. E., Hanotte O. (2000). Application of New Word Microsatellite primers for amplification of polymorphic loci in Old Word camelids. International Society of Animal Genetics. Journal of Animal Genetics, 31: 404-419.
Liang Ming, Liyun Yuan, Jirimutu Y (2020) Whole-genome sequencing of 128 camels across Asia reveals origin and migration of domestic Bactrian camels Communications Biology volume 3, Article number: 1
Mehta S.C. (2000). Molecular markers for genetic characterization of Camelus dromedaries. Ph.D. Thesis submitted to the Rajasthan Agricultural University, Bikaner.
Mehta S.C., Mishra B. P. and Sahani M. S. (2002). Genetic differentiation of Indian camel breeds using random oligonucleotide primers. ICAR News, 8(14): 15-16.
Mishra B. P. (2002). Genetic variation in Indian camel using microsatellite marker, National Bureau of Animal Genetic Resources. NATP, Annual Report (2001-2002).
Mishra B. P., Tendon S.N. and Khanna N.D. (1998a). Genetic variation in Indian dromedary using random amplified polymorphic DNA (RAPD) technique. The International Meeting on camel production and future perspective. May 2-3, 1998. AI Ain, UAE.

