P. G. Department of Botany, Govt. Vidarbha Institute of Science and
Humanities (Autonomous), Amravati 444 604, India.
Corresponding author email: vdhutke@gmail.com
Article Publishing History
Received: 13/10/2023
Accepted After Revision: 20/03/2024
The objective of the present study was to find out the genetic relationship within the species of Blumea of family Asteraceae through random amplified polymorphic DNA (RAPD) marker. Genetic analysis was made by using 10 arbitrary primers which revealed a total 292 polymorphic fragments. The genetic similarity was evaluated on the basis of presence or absence of bands. High degree of polymorphism was observed among the samples, suggesting the degree of genetic variability.
Collectively all primers data was used for construction of dendrogram. All primers gave amplification products and had from (OPX-07) – 23 bands to 42 bands (OPB-12) with an average 29.9 bands per primers. Thus, these RAPD markers have the potential for assessment of genetic variation and phylogenetic analysis within the species of Blumea. The results of the current study have been found to be useful for assessing genetic diversity, genetic relationship and phylogenetic analysis.
Blumea, RAPD marker PCR, Genetic diversity, Polymorphism, Dendrogram
Hutke V. D, Mushfique M. Molecular Characterization and Genetic Diversity of Blumea Species Using RAPD Marker. Biosc.Biotech.Res.Comm. 2024;17(1).
Hutke V.D, Mushfique M. Molecular Characterization and Genetic Diversity of Blumea Species Using RAPD Marker. Biosc.Biotech.Res.Comm. 2023;17(1). Available from: <a href=”https://shorturl.at/rT126“>https://shorturl.at/rT126</a>
INTRODUCTION
Genus Blumea belonging to the family Asteraceae is one of the important medicinal plant found in the tropical and sub-tropical zones of Asia, especially the Indian Subcontinent and Southeast Asia. A few species are found in Australia and still fewer in Africa. The plants of this genus are mostly relatively small weeds. In India, the species are distributed throughout the country from South to North up to the Himalayas at about 2,000 m elevations. The maximum diversity of the species lies in the North-East region followed by the Peninsular region and Andaman and Nicobar Islands. Many species of genus Blumea are used in traditional medicine with higher therapeutic values (Tamilarasi and Thirugnanasampandan, 2014).
Use of DNA markers for the identification of genetic diversity, can be useful in identifying genetic structure as well as diversity among species of genus. Due to their simplicity, reliability and cost effectiveness PCR based markers are in demand (Parita et al., 2018). Different PCR based techniques have been developed during the last two decades. The random amplified polymorphic DNA (RAPD) is simple, cost-effective and a powerful tool in the analysis of plant genome characterization (Bardakci, 2001). RAPD technique has been widely used in many plant species for varieties analysis, population studies and genetic linkage mapping (Prasad, 2014, Mishra et al., 2018, Mostofa et al., 2020. Dobhal1 and Kumar, 2021).
The present work was aimed to assess the genetic diversity of five species of Blumea (coded as in Table-I) which are Blumea axillaris (Lam.) DC, Blumea eriantha DC, Blumea fistulosa (Roxb.) Kurz, Blumea lacera (Burm. f.) DC and Blumea oxyodonta DC. coded as (Table-I) using Random Amplified Polymorphic DNA (RAPD) markers.
MATERIAL AND METHODS
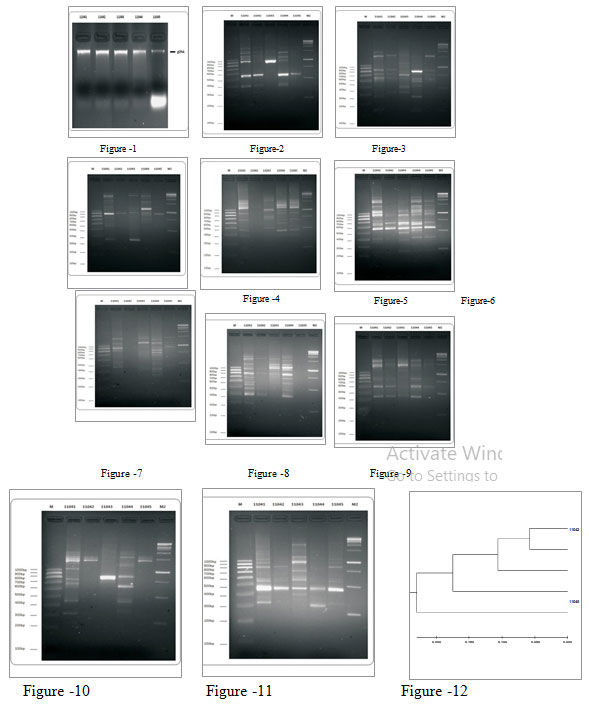
Plant material collection and total DNA extraction: Leaf samples of five selected species of Blumea were collected from Amravati, Maharashtra. Fresh and disease-free young leaf samples were taken in Ziplock plastic bag with silica gel and transported to laboratory. The plant materials were stored at -70° C (Remi Queek freezer). DNA was isolated by CTAB extraction method (Murray and Thompson, 1980). 100 mg of leaf tissue was used to extract genomic DNA. The quality of a genomic DNA was checked by agarose gel electrophoresis for this 5 uL of the sample was loaded in each well and quantity with Qubit fluorometer (Invitrogen USA) PCR amplification (Fig.-1). Total 10 primers were used for each sample. A 25.0μl reaction mixture for PCR was prepared containing PCR buffer DNTPs, Tag polymerase, primers and sample of DNA.
Table 1. Job code for each Blumea species and number of band generated
| Sr. No. | Species Name | Job Code | Number of Bands Generated |
| 1 | Blumea fistulosa (Roxb.) Kurz | 11041 | 88 |
| 2 | Blumea laciniata (Roxb.) DC | 11042 | 38 |
| 3 | Blumea eriantha DC | 11043 | 54 |
| 4 | Blumea axillaris (Lam.) DC | 11044 | 80 |
| 5 | Blumea oxyodonta DC | 11045 | 39 |
RAPD analysis :RAPD PCR amplification: The prepared reaction mix was subjected to PCR amplification in which different thermal profile was set for 10 primer types, where otal 35 cycle programmed for amplification was run using PCR machine. Thermal profile used for PCR amplification involved an initial denaturing step (95oC) followed by 35 cycles. (Denaturation on at 95oC, primer annealing at respective temperature, and primer execution at 72oC). Final step at 72oC was carried out for polishing the end of PCR products. Finally at the end these PCR amplified products were resolved electrophoretically where 2.0% (w/v) agarose gel was used for RAPD.
Analysis of RAPD data: Analysis of number of base substitutions per site from between sequences were conducted using the Maximum Composite Likelihood model (Tamura et al., 2004). This analysis involved 5 nucleotide sequences. All ambiguous positions were removed for each sequence pair (pairwise deletion option). There was a total of 402 positions in the final dataset. Evolutionary analysis was conducted in MEGA X (Kumar et al., 2018). Dendrogram was drawn using MEGA X software. Briefly all the RAPD bands were scored in binary format. Collectively all primers data was used for construction of UPGMA tree (Iruela et al., 2002). The evolutionary history was inferred using the UPGMA method (Sneath and Sokal, 1973).
RESULT AND DISCUSSION: Total 10 RAPD primers were used for screening of five species of Blumea. All primers gave amplification products and had from (OPX-07) – 23 bands to 42 bands (OPB-12) with an average 29.9 bands per primers (Table -2). Among 10 RAPD primers tested all produced bands that were polymorphic across all the samples, 6 RAPD markers OPA07, OPA04, OPB01, OPB10, OPB12 and OPX07 produced monomorphic bands in the sample (Fig.- 2-11). Distance matrix values using Jaccard’s coefficient based on RAPD markers ranged from 0.116 between 11045 to 0.689 between 11043 (Table-3). Similarity matrix values ranged from 0.311 between 11043 to 0.884 between 11045 (Table-4).
Table 2. Details of RAPD Primers with banding profile used in the present study
| S. No. | Primer Code | Nucleotide sequence (5’-3’) | TNB | PB | MB | PP |
| 1. | OPA11 | CAATCGCCGT | 32 | 31 | 1 | 96.875 |
| 2. | OPA07 | GAAACGGGTG | 28 | 26 | 2 | 92.8571 |
| 3. | OPB01 | GTTTCGCTCC | 24 | 24 | 0 | 100 |
| 4. | OPB12 | CCTTGACGCA | 24 | 23 | 1 | 95.8333 |
| 5. | OPA04 | AATCGGGCTG | 34 | 33 | 1 | 97.0588 |
| 6 | OPM05 | GGGAACGTGT | 42 | 41 | 1 | 97.619 |
| 7 | OPM06 | CTGGGCAACT | 33 | 33 | 0 | 100 |
| 8 | OPX01 | CTGGGCACGA | 27 | 27 | 0 | 100 |
| 9 | OPX07 | GAGCGAGGCT | 32 | 32 | 0 | 100 |
| 10 | OPB10 | CTGCTGGGAC | 23 | 22 | 1 | 95.6522 |
| Total | 299 | 292 | 7 | — | ||
| TNB-Total numbers of bands, PB-Polymorphic band, MB-Monomorphic bands, PP-Percentage polymorphism | ||||||
Table 3. Jaccard’s Distance Matrix
|
11042 |
|
|||
| 11045 | 0.116 | |||
| 11041 | 0.299 | 0.337 | ||
| 11044 | 0.337 | 0.361 | 0.510 | |
| 11043 | 0.200 | 0.225 | 0.689 | 0.349 |
Table 4. Jaccard’s Similarity Matrix
|
11042 |
|
|||
| 11045 | 0.884 | |||
| 11041 | 0.701 | 0.663 | ||
| 11044 | 0.663 | 0.639 | 0.490 | |
| 11043 | 0.800 | 0.775 | 0.311 | 0.651 |
The dendrogram obtained clearly indicated two clusters (Fig. 12). Smaller one having one species-11041 and the larger cluster that could be further divided into four different sub clusters. The optimal tree with the sum of branch length = 0.79751903 was shown. The tree was drawn to scale, with branch lengths in the same units as those of the evolutionary distances used to infer the phylogenetic tree. The evolutionary distances were computed using the Maximum Composite Likelihood method and were in the units of the number of base substitutions per site. This analysis involved 5 nucleotide sequences. All ambiguous positions were removed for each sequence pair (pairwise deletion option). There was a total of 402 positions in the final dataset.
RAPD markers have been used in several studies for DNA fingerprinting and phylogenetic analysis (Ramakrishnan et al., 2016; Kumar et al., 2018; Sawsan et al., 2020; Omri et al., 2021). They have been used as effective tools to analyze genetic diversity in many species of family Asteraceae, (Elizabeth et al., 2000 and Geleta et al., 2007). In genus Blumea some researchers have made an attempt to evaluate genetic diversity using RAPD markers system. Pornpongrungrueng et al., (2007) studied evolutionary relationship in Blumea with sequences of cpDNA and nrDNA. Pang et al., (2014) used AFLP markers to determine genetic diversity of Blumea balsamifera.
The genetic distance estimated by authors with Jaccard similarity coefficient index showed low variability among genotypes. RAPD analysis revealed a little genetic variation in micropropagated plants of Blumea mollis (Tamilarasi and Thirugnasampandan, 2014). YingBo et al., (2016) did comparative analysis of SRAP and AFLP markers for genetic diversity of Blumea balsamifera. In their opinion AFLP molecular markers is more suitable to estimate genetic diversity of Blumea balsamifera because it has more polymorphic sites and higher markers characteristic index.Genomic DNA was amplified using ten RAPD primers and all were reproducible however, five primers were used for RAPD analysis out of which primers 2 and 5 showed more bands reported by Tamilarasi and Thirugnasampandan, (2014) in Blumea mollis. The findings of the current investigation revealed the successful utilization of RAPD markers for assessment of genetic diversity of Blumea species.
Figure 1: 1% (w/v) Agarose Gel electrophoresis of genomic DNA isolated 11041-11045 samples.
5 uL of the sample was loaded in each well.
Figure 2-11 : RAPD profile for all samples with a single primer in a gel (For ten Primers).
Figure 12 : RAPD based dendrogram representing genetic relationship among 5 Blumea species.
CONCLUSION
The result of the current study found to be useful for assessing genetic diversity,
genetic relationship and phylogenetic analysis.
REFERENCES
Bardakci, F. (2001). Random amplified polymorphic DNA (RAPD) markers. Turkish Journal of Biology, 25(2), 185-196.
Bekele, E., Geleta, M., Dagne, K. et al. (2007) Molecular phylogeny of genus Guizotia (Asteraceae) using DNA sequences derived from ITS. Genet Resour Crop Evol 54, 1419–1427
Iruela, M., J. Rubio, J.I. Cubero, J. Gil and T. Milan, (2002) Phylogenetic analysis in the genus Cicer and cultivated chickpea using RAPD and ISSR markers. Theor. Appl. Genet., 104: 643– 51.
Karp, C. L., Wysocka, M., Wahl, L. M., Ahearn, J. M., Cuomo, P. J., Sherry, B., Griffin, D.
- (1996). Mechanism of suppression of cell-mediated immunity by measles virus. Science, 273(5272), 228-231.
Kumar, S., Stecher, G., Li, M., Knyaz, C., & Tamura, K. (2018). MEGA X: molecular evolutionary genetics analysis across computing platforms. Molecular biology and evolution, 35(6), 1547.
Lu, J., Knox, M. R., Ambrose, M. J., Brown, J. K. M., & Ellis, T. H. N. (1996). Comparative analysis of genetic diversity in pea assessed by RFLP-and PCR-based methods. Theoretical and Applied Genetics, 93(7), 1103-1111.
Mishra Tanmayee Arvind Kumar Goyal3 and Arnab Sen1 (2018) Molecular profiling of 20 different accessions of Canna using RAPD and ISSR primers NeBIO 9(2): 180-187
Mostofa, M.G., Rahman, L., Muhammad Yahiya, A.S., Harun-or-Rashid, M., & Mukul Mia, M. (2020) RAPD Analysis of Genetic Diversity and Relationships among Kenaf (Hibiscus cannabinus L.) Germplasm, Ind. J. Pure App. Biosci. 8(3), 37-47.
Murray, M. G., & Thompson, W. F. (1980) Rapid isolation of high molecular weight plant DNA. Nucleic acids research, 8(19), 4321-4326.
Omri, A., Abdelhamid, S., Benincasa, C. et al. (2021) Genetic diversity and association of molecularmarkers with biochemical traits in Tunisian olive cultivars. Genet Resour Crop Evol 68, 1181–1197
Prasad M. P. (2014) Molecular characterization and genetic diversity determination of Hibiscus species using RAPD molecular markers. Asian Journal of Plant Science and Research, 4(3):50- 56.
Pornpongrungrueng, P., Borchsenius, F., Englund, M. et al. (2007) Plant Syst. E-vol. 269, 223–243.
Sawsan A. Omer, Ebtesam M. Al-Olayan, Salah Eldin H. Babiker, Mohammed Z. Aljulaifi, Abdulaziz N. Alagaili, Osama B. Mohammed, Genotyping of Clostridium perfringens Isolates from Domestic Livestock in Saudi Arabia, BioMed Research International, vol. 2020, Article ID 9035341, 9 pages, 2020.
Shivani Dobhal1 and Ashok Kumar (2021) Diversity Analysis and Polymorphism Through RAPD Markers in Eucalyptus tereticornis Sm. International Journal of Biotech Trends and Technology. Volume 11 Issue 3, 23-30, July-Sep 2021.
Parita, B., Kumar, S.N., Darshan, D., Karen, P. (2018) Elucidation of genetic diversity among ashwagandha Withania somnifera (L.) Dunal genotypes using EST-SSR markers. Research Journal of Biotechnology 13(10): 52-59.
Sneath PHA & Sokal RR (1973) Numerical Taxonomy. Freeman, San Francisco.
Tamilarasi, T., & Thirugnanasampandan, R. (2014). Antioxidant activity evaluation of essential oil and RAPD analysis of in vitro regenerated Blumea mollis (D. Don) Merr. Acta Physiologiae Plantarum, 36(6), 1593-1598.
Tamura, K., Nei, M., & Kumar, S. (2004). Prospects for inferring very large phylogenies by using the neighbour-joining method. Proceedings of the National Academy of Sciences, 101(30), 11030-11035.

