RBVRR Women’s College of Pharmacy, Barkatpura,Hyderabad-500027, India.
Gland Pharma Limited Hyderabad 500027 India.
Corresponding Author email: bhavya.kagga@gmail.com
Article Publishing History
Received: 11/10/2023
Accepted After Revision: 25/03/2024
The present work was carried out to develop and validate a High-Performance Liquid Chromatography (HPLC) technique for the quantification of Fluphenazine HCl injections. The Waters 2965 RPHPLC equipment with PDA detector and autosampler was utilized for both the development and validation of the technique. A Phenomenex column (250 mm x 4. mm, 5 μm) was employed for the detection of Fluphenazine HCl, with a wavelength of 256 nm. The calibration graph exhibited linearity, with a correlation coefficient of 0. 99. The intraday accuracy, expressed as the relative standard deviation (RSD), was determined to be 0. 2 percent.
The recovery of Fluphenazine HCl ranged from 99. to 100. percent, with an RSD not exceeding 2 percent. When actual pharmaceutical samples were analyzed using this method, the content of Fluphenazine HCl fell within the permissible limits. Considering its sensitivity, precision, accuracy, and selectivity for the test chemical, this method can be effectively employed for routine quality control testing of Fluphenazine HCl in liquid dosage form. The suggested approach can be employed in quality control laboratories for routine analysis of Fluphenazine HCl in product bulk drugs and in routine application forms of pharmaceutical dose without excipient interference.
Fluphenazine Hcl, HPLC, Method Development, Method Validation, PDA Detector.
Kagga B, Ghanukota S, Bhagavatula H, D. Rambabu, Mogili S. Method Development and Validation for Fluphenazine in Bulk and Pharmaceutical Dosage form Using High Performance Liquid Chromatography –Ultraviolet Detection. Biosc.Biotech.Res.Comm. 2024;17(1).
Kagga B, Ghanukota S, Bhagavatula H, D. Rambabu , Mogili S. Method Development and Validation for Fluphenazine in Bulk and Pharmaceutical Dosage form Using High Performance Liquid Chromatography –Ultraviolet Detection. Biosc.Biotech.Res.Comm. 2023;17(1). Available from: <a href=”https://shorturl.at/cP029“>https://shorturl.at/cP029</a>
INTRODUCTION
Analytical technique is that the process of choosing an accurate assay procedure to work out on a pharmaceutical product. It’s the method of proving that an analytical method is suitable to be used in laboratory to live the chemical analysis of latter samples. Analytical techniques must be established utilising the procedures and acceptance criteria outlined in the ICH guidelines and utilised in GMP and GLP environments (Charles et al., 1985). Methodology development encompasses numerous stages and can take months to complete, depending on the complexity and pretensions of the methodology. The literature has noted multidinous chemical analysis methods for assaying Fluphenazine hydrochloride. These approaches include spectrophotometry, (Reusch 2013), spectrofluorimetry, (El-Houssini and Zawilla 2014) turbidmetry, gas chromatography (GC), HPTLC, force degradation studies (Walash and Wahba 2014 Sistik et al., 2017).
A Numerous high performance liquid chromatography (HPLC) methods using mass (MS) (Belal et al.,2008),(Davis and Fenimore 1983), (Javaid et al.,1981) ,( Sistik et al., 2017), (Sa’sa and Jalal 1988) , (Thummar et al., 2015) and ultraviolet (UV) sensors were also described for this pharmaceutical chemical in conjunction w th Nortriptyline HCl and other Fluphenazine combinations (El-Houssini, and Zawilla 2014),( Mennickent et al.,2010). The literature study reveals that there is no reported simple HPLC-UV (Ashour and Kattan 2012) quantitative analysis methodology for estimating the Fluphenazine HCl in Injections. The goal of the current work was to create a robust, easy, and accurate method for HPLC to measure the amount of Fluphenazine hydrochloride in injection formulation.
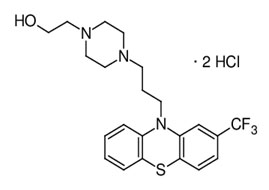
Drug profile: This is the salt of the phenothiazine Fluphenazine hydrochloride, which has antipsychotic and perhaps antineoplastic effects. The antipsychotic drug Fluphenazine 2[4[3[2(trifluoromethyl)phenothiazine10yl]propyl]piperazine1yl]ethanol;
Fluphenazinedihydrochloride reduces hallucinations and delusions associated with schizophrenia. It does this by blocking postsynaptic dopamine D2 receptors in the visceral brain, cortical system, and basal ganglia. Additionally, by blocking 5-hydroxytryptamine type 1B (5HT type 1B) serotonin receptors, this drug can stop the growth of lymphocytes and myeloma cells [4].
Figure 1: Structure of Fluphenazine HCl
material and methods
Diluent: The diluent is often chosen based on the solubility of the medicines. Fluphenazine hydrochloride’s solubility in distilled water, methanol, and acetonitrile were tested to determine the best diluent. water and methanol were selected as the diluent (40:60).
Preparation of standard stock solutions:10 mg of Fluphenazine were carefully weighed into 10 ml volumetric flasks, then 3/4 of the diluent was added, and the mixture was then sonicated for 10 minutes. The volume was made using diluents, and it was labelled as normal stock solution (1000 g/ml Fluphenazine).
Preparation of working standard solution: From each stock solution, 1 ml of Fluphenazine was pipetted into a 10-ml volumetric flask and the remaining volume was filled with the diluent. Fluphenazine, 100 g/ml.
Preparation of standard stock solutions: To 10 ml volumetric flasks, 10 mg of Fluphenazine was accurately weighed, added 3/4 of the diluent, and then sonicated for 10 minutes. Diluents were used to create the volume, which was then marked as standard stock solution (1000 g/ml Fluphenazine).
Preparation of working sample solutions: A 10 ml volumetric flask was constructed with diluent after 1 ml of filtered stock sample solution was placed there. (Fluphenazine, 100 g/ml)
Selection of detection wavelength: Fluphenazine standard solution 10ppm was scanned in the UV range (200400) and from the overlay spectrum, 256nm was selected as λ (lambda) max.
Selection of detection wavelength: Fluphenazine standard solution 10ppm was scanned in the UV range (200400) and from the overlay spectrum, 256nm was selected as λ (lambda) max.
Method Validation Parameters: System suitability: The preparation of Fluphenazine standard solutions (100 ppm) and injection of the solutions six times were used to establish the system suitability parameters, which included peak tailing, resolution, and USP plate numbers. The RSD percentage for data from six standard injections shouldn’t be higher than 2%.
Specificity: Check the optimal approach for interferences, to be specific. The retention durations of these medications using this method shouldn’t have any conflicting peaks in the blank or placebo. As a result, this approach was deemed specific.
Accuracy: The technique’s accuracy: From a single homogenous mixture, six injections of Fluphenazine sample solutions at 10 ppm were created. Calculated was the peak areas’ percent RSD for the injections. The percent RSD of the area of six standard injection results cannot be higher than 2%.
Linearity: Standard stock solutions should be made by precisely weighing 10 mg of Fluphenazine into 10-ml volumetric flasks, adding 3/4° of diluent, and sonicating for 10 minutes. Diluting agents were used to create the volume, which was labelled as Standard stock solution (1000 g/ml of Fluphenazine).
Preparation of Standard solution:1 ml of Fluphenazine was pipetted into a separate 10 ml volumetric flask, where the volume was then filled with diluent. (Fluphenazine, 100 g/ml)4% percent Standard solution: In a 10mL volumetric flask, 0.4ml of the working standard solutions was pipetted out and diluted to 10mL. Similar standard solutions of 6 % ,8%, 10 %,12 %,14 %, 16 %,and 18 % were created using 4g/ml of Fluphenazine.
Accuracy: Preparation of standard solution:10mg of Fluphenazine were accurately weighed and then put to individual 10ml volumetric flasks. 3/4 of the diluents were then added, and the flasks were shaken briefly. Standard stock solution (1000 g/ml of Fluphenazine) was prepared in flasks with diluents.
Preparation of 50% Spiked Solution:1.0 ml of each standard stock solution was pipetted out and diluted to the correct concentration before being added to a 10 ml volumetric flask along with 0.5 ml of the sample stock solution.
Preparation of 100% Spiked Solution:A 10 ml volumetric flask holding 1 mL of standard stock solution and 1 mL of sample stock solution was pipetted together to dilute the volume to the required concentration..
Preparation of 150% Spiked Solution: The solution was made in a 10 ml volumetric flask with 1.5 ml of sample stock solution.
Acceptance Criteria: Each level’s recovery percentage should range from 98.0 to 102%.
LOD and LOQ sample Preparation: Preparation: Diluents were added to 1 ml of standard stock solution before being pipetted into 10 ml volumetric flasks. Fluphenazine 0.1 mg was transferred to 10 ml volumetric flasks from the aforementioned solution, and the volume was then added using the same diluents.
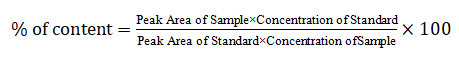
Assay methodology: By injecting a sample with an equivalent weight into an HPLC machine, the commercial formulation was tested. Furthermore, % To diluted the volume to the appropriate concentration, a 10 ml volumetric flask containing 1 mL of standard stock solution and 1 mL of sample stock solution was pipetted together. Formulas were used to determine purity.
Use the following formula to determine the amount of Fluphenazine that is pure in the injection:
RESULTS AND DISCUSSION
Specificity:It is the method to accurately and dependably quantify the target analyte in the presence of contaminants, degradation products, and other chemicals that are expected to be present in the sample matrix and other components. When a blank was injected, no peaks at the Rt of Fluphenazine were seen, demonstrating the method’s specificity.
System suitability parameters: System suitability test provides added assurance that the method gives accurate and reliable results on a specific time. System suitability tests are performed each time a method is used before or during analysis. The system suitability parameters evaluated in this study include theoretical plates, tail factor, retention factor, run time and the values are shown in Table 1.1.
Table 1.1. System suitability parameters of Fluphenazine
| Parameters | Chromatographic conditions |
| Theoretical plates | 7280 |
| Tailing factor (Asymmetry) | 1.345 |
| Retention Time (Rt) | 3.268 |
| Run time | 10min |
Precision:Method precision: Five 10 ppm working sample solutions are injected the day after sample preparation. The standard deviation was calculated and the %RSD was found to be 0.18, which is not more than 2.0. The precision values of the method are presented in the following table 1.2
Table 1.2. Method precision of Fluphenazine
| S.No | 10 ppm Peak area (HPLC) | |
| 1 | 8,85,532 | |
| 2 | 8,87,623 | |
| 3 | 8,85,653 | |
| 4 | 8,87,324 | |
| 5 | 8,83,236 | |
| 6 | 8,86,563 | |
| STDEV |
|
|
| %RSD |
|
Linearity:Linearity: Inject 6 standard solutions containing Fluphenazine at concentrations ranging from 4 ppm to 18 ppm to show the linearity of the analytical procedure. Plot a graph showing peak area versus concentration. 90198 was the obtained slope. The correlation coefficient was found to be 0.999 and the intercept was 23917. The various concentrations and associated peak areas examined during the investigation are listed in Table 1.3 below.
Table 1.3. Linearity data of Fluphenazine
| Concentration (ppm) | Peak Area | |
| 0 | 0 | |
| 4 |
|
|
| 6 |
|
|
| 8 |
|
|
| 10 |
|
|
| 12 | 10,61,875 | |
| 14 |
|
|
| 16 |
|
|
| 18 |
|
Figure 1.1 Calibration plot of Fluphenazine
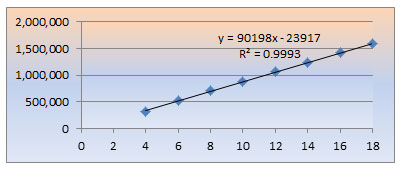
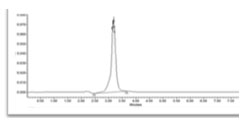
Figure 1.2: Linearity 4% Chromatogram
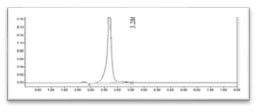
Figure 1.3: Linearity 6% Chromatogram
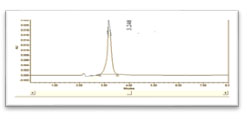
Figure 1.4: Linearity 8% Chromatogram
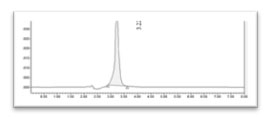
Figure 1.5: Linearity 10% Chromatogram
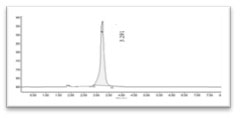
Figure 1.6: Linearity 12% Chromatogram
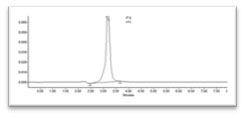
Figure 1.7: Linearity 14% Chromatogram
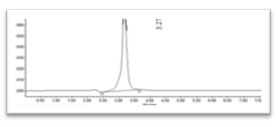
Figure 1.8: Linearity 16% Chromatogram
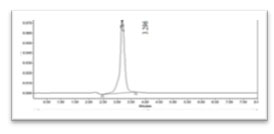
Figure 1.9:Linearity 18% Chromatogram
Accuracy:Three concentrations of 50%, 100%, 150% are injected tripled and the average percent recovery was calculated as 100.04. The results are listed in Table 1.4, according to the acceptance criteria, the average recovery should be within the range of 98.0% to 102.0% and be within the range; therefore, the procedure is reliable.
Table 1.4: Accuracy data of Fluphenazine (HPLC)
|
% Level |
Sample
Amount (μg/mL) |
Standard
Amount Spiked (μg/mL) |
Peak area |
% Recovery |
Mean %Recovery |
| 50% | 4* | 2* | 5,29,578* | 100.11* |
100.04%* |
| 100% | 4* | 4* | 6,98,829* | 99.94* | |
| 150% | 4* | 8* | 10,10,572* | 99.67* |
Robustness: Methodological tweaks like Minus Flow, Plus Flow, Minus Mobile Phase, and Plus Mobile Phase are little but intentional. Calculated is the above conditions’% RSD. The parameters assessed during the robustness studies are shown in the table below. The findings show that the procedure is reproducible even when the parameters are intentionally changed slightly, there is no deviation.
Table 1.5: Robustness Data of Fluphenazine
| Parameter | %RSD |
| Flow Minus (0.8mL) | 0.4 |
| Flow Plus (1.2mL) | 0.5 |
| Mobile phase Minus (30:70) | 0.8 |
| Mobile phase Plus (50:50) | 0.9 |
Assay of marketed formulation: The system was given separate injections of the standard solution and sample solution. Chromatograms were then taken, and the earlier approach was used to calculate the amount of drug present in the sample.
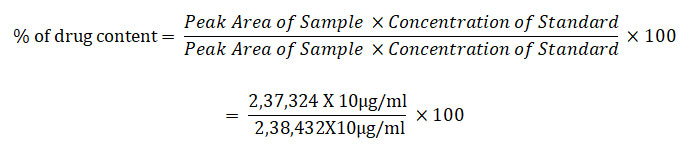
% Assay of content = 99.53%
Acceptance limit: 90-110% (as per IP)
In order to achieve outstanding retention duration and peak asymmetry, the Phenomenex C18 column (250 mm * 4.6 mm 5.) was employed for the study. Mobile phase A and phase B were also used (methanol: water 40:60). 20 µl of the injection volume were saved while the flow rate was kept at 1.0 mL/min. The temperature in the column was fixed at 30 C. Using a UV detector, the detection wavelength was 257 nm. Fluphenazine HCl had a retention time of 3.286 min. The regression correlation coefficient was found to be 0.9995, indicating that the process was linear in concentration to peak area responses. After conducting precision investigations, it was discovered that the %RSD of the determinations was 0.18%, indicating that the method’s precision was within acceptable bounds.
When compared to the overall percentage RSD for recovery, the accuracy of the approach was determined to be high at 80, 100, and 150 percent. This demonstrates that the suggested strategy is the right one. For the detection and quantification of Fluphenazine HCl injectable formulation, all parameters were effectively established. According to the guidelines in the ICH Q2R1 guidelines, the approach has been validated. The HPLC method designed for both bulk drug and Pharmaceutical Injection Formulation of Fluphenazine HCl has a number of benefits, including reduced retention time, remarkable linearity, good peak symmetry, and speed, accuracy, and robustness. The sample does not need to be prepared using time-consuming processes because the mobile phase may be made rapidly and the diluent is easily accessible.
CONCLUSION
When actual pharmaceutical samples were analyzed using this method, the content of Fluphenazine HCl fell within the permissible limits. Considering its sensitivity, precision, accuracy, and selectivity for the test chemical, this method can be effectively employed for routine quality control testing of Fluphenazine HCl in liquid dosage form. The presently suggested approach can be employed in quality control laboratories for routine analysis of Fluphenazine HCl in product bulk drugs and in routine application forms of pharmaceutical dose without excipient interference.
Conflict of interest: Authors have no conflict of interest
Funding: Nil
Data Availability: All data are available and can be supplied on reasonable request to the corresponding author
References
Arora S. and Bhanot D. (2014) ‘Introduction to high performance liquid chromatography Auriga Research Ltd., New Delhi.
Ashour S, Kattan N. (2012) Simultaneous determination of nortriptyline hydrochloride and Fluphenazine hydrochloride in microgram quantities from low dosage forms by liquid chromatography–UV detection. Journal of Pharmaceutical Analysis. 2 pp.437–442.
Belal, F., El-Brashy, A., El-Enany, N. and El-Bahay, N., (2008). Spectrofluorometric determination of olanzapine and fluphenazine hydrochloride in pharmaceutical preparations and human plasma using eosin: application to stability studies. Journal of AOAC International, 91(6), pp.1309-1317
Charles, I. et al. (1985) Separation of Fluphenazine derivatives by gradient elution HPLC Analytical Proceedings, 22(5), pp. 135.
Costello, Heffron (2013) Quantitation of Fluphenazine in equine serum following Fluphenazine decanoate administration” Journal of Analytical Toxicology ,37(8) pp. 594-599
Davis, C.M. and Fenimore, D.C., 1983. Determination of fluphenazine in plasma by high-performance thin-layer chromatography. Journal of Chromatography B: Biomedical Sciences and Applications, 272, pp.157-165.
El-Houssini, O.M. and Zawilla, N.H. (2014) Chromatographic methods for the determination of fluphenazine, nortriptyline and its impurity amitriptyline in bulk and pharmaceutical formulations,’ Journal of Analytical Chemistry, 69(12), pp. 1187–1192.
El-Ragehy, N.A., Abbas, S.S. and El-Khateeb, S.Z., (2002). Spectrophotometric and stability indicating high performance liquid chromatographic determination of nortriptyline hydrochloride and fluphenazine hydrochloride. Analytical letters, 35(7), pp.1171-1191.
Farhadi, K., Savojbolaghi, A.K., Farajzadeh, M. et.al., (2003). Development of turbidimetric methods for the determination of some N-substituted phenothiazine derivatives using sodium dodecyl sulfate and mercury (II) chloride. Analytical letters, 36(10), pp.2183-2198.
Hashem and Jira. (2013) Simultaneous hplc-determination of nortriptyline and Fluphenazine in one minute using monolithic stationary phase Journal of Liquid Chromatography & Related Technologies. 36, pp 770-780.
Javaid, J.I., Dekirmenjian, H., Liskevych, U., et.al., (1981). Fluphenazine determination in human plasma by a sensitive gas chromatographic method using nitrogen detector. Journal of Chromatographic Science, 19(9), pp.439-443.
Luo and Hubbard. (1997) Sensitive Method for the Simultaneous Measurement of Fluphenazine Decanoate and Fluphenazine in Plasma by High-Performance Liquid Chromatography with Coulometric Detection Journal of Chromatogram B: Biomedical Science and Application. 688(2) pp.303-308.
Mennickent, S., Contreras, J., Reyes, et.al., (2010). Validated instrumental planar chromatographic method for quantification of fluphenazine hydrochloride in injections. JPC-Journal of Planar Chromatography-Modern TLC, 23(1), pp.75-78.
Sistik, P R. Urinovska , H Bozmanovaet.al., (2017) Quantitative Analysis of Fluphenazine and Flupentixol in Human Serum by Liquid Chromatography-Tandem Mass Spectrometry Clinical Therapeutics pp. 0149-2918
Practical Pharmaceutical Chemistry (2000). CBS Publishers & Distributors.
Reusch, W., (2013). Virtual Text of Organic Chemistry, Visible and Ultraviolet Spectroscopy.
Sa’sa SI, Jalal I. (1988) Determination of nortriptyline hydrochloride and Fluphenazine hydrochloride in commercial tablets by reverse phase high-performance liquid chromatography Micro Chem Journal.38 pp. 181–187.
Thummar, K.N., Ghava, D.J., Mistry, A. (2015). Forced degradation behaviour of fluphenazine hydrochloride by LC and characterization of its oxidative degradation product by LC–MS/MS. Scientia Pharmaceutica, 83(2), pp.297-309.
R.: Practical High Performance Liquid Chromatography.
Walash MI, Wahba MEK. (2014). A validated liquid chromatographic method for the determination of Fluphenazine hydrochloride in the presence of its degradation products: application to degradation kinetics. Anal Methods. 6 pp. 6727–6735.

