1Eco-Toxicology, Fisheries and Aquaculture Extension Laboratory Department of Zoology, University of Kalyani, Kalyani, West Bengal.
2Retd. Professor Department of Zoology, Berhampur University, Bhanjabihar, Berhampur,Ganjam, Odisha.
Corresponding author email: panigrahi.ashis@gmail.com
Article Publishing History
Received: 13/07/2020
Accepted After Revision: 17/09/2020
River Ganga is one of the most important river systems in India and it is regarded as the most sacred river of this country. The river bifurcates near Murshidabad district of West Bengal – one distributary flows eastward and enters into the Bangladesh as “Padma” and the other branch flows further southward direction through the state of West Bengal (India) with the name “Hooghly” or “Bhagirathi-Hooghly”. Nowadays this holy river is facing tremendous pressure from rapid industrialization, urbanization and different agro-industrial developments in the catchment areas. The basic objectives of our present study were to investigate the seasonal variation of different limnochemical characteristics of river Hooghly at some predesigned stations and also to assess the effects of pollution on spatial and seasonal point of view. In the two years long (from March-2017 to February-2019) study we investigated the riverine water quality on the basis of eight (08) limnochemical parameters (Water Temperature, pH, Hardness, Dissolved Oxygen, Biological Oxygen Demand, Chemical Oxygen Demand, Total Nitrogen and Total Phosphorus). The acquired dataset were analysed using ANOVA and multivariate statistical analysis like PCA to obtain the major factors regulating the water quality and to measure the spatiotemporal variation. This investigation would be helpful to understand the present status of limnological characteristics and to frame out the control strategy for the upcoming eras.
Limnochemical Characteristics, River Hooghly, Seasonal variations, PCA.
Panigrahi A. K, Pattanayak S. Limnochemical Characterization of Tidal Stretch of the River Hooghly in West Bengal. Biosc.Biotech.Res.Comm. 2020;13(3).
Panigrahi A. K, Pattanayak S. Limnochemical Characterization of Tidal Stretch of the River Hooghly in West Bengal. Biosc.Biotech.Res.Comm. 2020;13(3). Available from: https://bit.ly/3gSGeTi
Copyright © Panigrahi and Pattanayak This is an open access article distributed under the terms of the Creative Commons Attribution License (CC-BY) https://creativecommons.org/licenses/by/4.0/, which permits unrestricted use distribution and reproduction in any medium, provide the original author and source are credited.
INTRODUCTION
We all know that the “water” is called as “life” as it sustains the lifeline of the whole organism in the planet and that’s why our planet is known as “Blue Planet”. River Ganga is regarded as most significant river system in India due to its water availability round the year. Besides this river plays a key part in maintaining the growth of civilization and economy of Indian people (Paul and Sinha, 2013). In one word, River Ganga is the lifeline of about 44% of country’s population (Chaudhary et al., 2017). In the diversified cultural ethos of India, the holy river Ganges occupies a unique position. It is regarded as one of the most “sacred river” not only in India but also in the entire world. This river has been deeply admired by the millions of people of India since ancient times.
River Ganga holds almost 25 per cent of total Indian water resources (Rahaman, 2009). The Ganga river basin (Fig.1) is the chief and largest river basin in India (Agarwal, 2015). It is considered as one of the most densely populated areas in the world and the basin comprises about 300 million people including three countries, namely India, Bangladesh and Nepal (Das and Tamminga, 2012; Gopal, 2000). This river basin encompasses a large area between 22º30´ to 31º 30´ N latitudes and 73º 30´ to 89º 00´ E longitudes. The river Ganges rises from the Gaumukh ice cave (Lat. 30˚ 55’N, Long. 79˚ 07’E) of Gangotri Glacier located on the southern slope of Garhwal Himalaya at an altitude of 4100 meters.
The main river starts its journey from Gaumukh glacier as “Bhagirathi”, and then it flows further downward and joins with river “Alakananda” at the place Devprayag. After that the joint flow of Bhagirathi and Alakananda is named as river “The Ganga”. It runs through different state of India and finally meets with Bay of Bengal at the place Gangasagar in West Bengal. The total length of Ganga River is about 2525 kilometers (CPCB, 2013). River Ganga gets its way to the West Bengal with the name of river Bhagirathi through Rajmahal Hills of the state Jharkhand and then it streams about 80 kilometers downward up to Farakka in West Bengal. The main stream of Ganga is known as river Bhagirathi from Mithipur village of Murshidabad district of the state West Bengal. Then the river flows about 500 kilometres towards south to meet finally the Bay of Bengal at Gangasagar. The same stream is further named as “River Hooghly” from Nabadwip to Gangasagar stretch (about 280 km) and this entire stretch is tidal in nature (Rudra, 2016; State of Environment Report West Bengal, 2016).
The complete path of River Ganga can be subdivided into three different zones (GAP annual report, 2015; Dutta et al., 2020) – a) Upper stretch, which starts from Gamukh glacier to Haridwar (total length about 294 kilometres) (b) Middle stretch, which starts from Haridwar to Varanasi (total length about 1082 kilometres) (c) Lower stretch, which starts from Varanasi to Gangasagar of West Bengal where it meets Bay of Bengal (total length about 1134 kilometres). Gangasagar is also known as Sagar Island and this area is subjected to heavy anthropogenic pollution load during January of every year on the occasion of Holy Bath (Bonnail et al., 2019).
The Ganga river basin is the one of the most densely populated regions of the earth and it is the biggest groundwater repositories (Pal et. al., 2020). But this huge water resource is being polluted from various sources in successive years. From last few years Government of India had taken a variety of strategies like Ganga Action Plan (GAP) and founded National Ganga River Basin Authority (NGRBA) to rejuvenate the river water, but its success rate is quite low (Chaudhary and Walker, 2018).
The main objectives of this research paper are to assess the vital physico-chemical parameters of Hooghly (The Ganga) river water mainly in the tidal stretch from Nabadwip to Gangasagar in West Bengal and to analyse its water quality through the time period.
Figure 1: Ganga river basin (adopted from National River Conservation Directorate, MOEF, 2009)

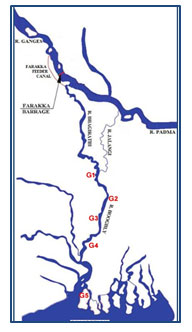
Figure 2: Lower stretch of River Hooghly (The Ganga) showing the sampling stations (modified after Alam, 2020)
MATERIAL AND METHODS
Climatic conditions of study areas: The climatic conditions of River Ganga (Bhagirathi-Hooghly) basin of southern part of West Bengal vary from Humid to arid, it experiences well-defined seasons in a year. For this study we categorized the study period into 3 different seasons namely Pre-monsoon (March-June), Monsoon (July-October) and Post monsoon (November-February).
Sampling stations: Five sampling stations were selected (Fig. 2), along north-south direction of the tidal stretch of the river covering a length of about 250 km. Selection of sampling stations were based on variability in geo-physical environment, varied nature of anthropogenic activities, land use pattern and several nonpoint and point sources of pollution. Details of the sampling stations are given below.
- Nabadwip or G-1(23º24ʹN & 88º22ʹE): This sampling site is located near Gouranga Setu (bridge) in the Nadia district of West Bengal. Here ecological stresses are agricultural runoff, ferry service, bathing, washing clothes, domestic sewage etc.
- Naihati or G-2 (22º53ʹN & 88º24ʹE): This sampling site is located in the North 24Parganas district near the Lichubagan ghat. Ecological stresses are industrial effluent from Keshuram Rayon, Tribeni tissue paper mill and Bandel thermal power station, besides that bathing, ferry service, domestic sewage etc. also affect the quality of the riverine water.
- Dakhineswar or G-3 (22º39ʹN & 88º21ʹE): This sampling site is located in the North 24 Parganas district of West Bengal. This site is under the purview of Kolkata Metropolitan Development Authority. Famous Dakhineswar Kali temple is situated in the vicinity of this sampling station. Flowers, food particles and remnant of puja materials are disposed here very often. Here bathing, washing clothes etc. deteriorate the water quality of this holy river.
- Gardenreach or G-4 (22º33ʹN & 88º17ʹE): This sampling station is located in the south-western part of the Kolkata metropolitan area. Here ecological stresses are domestic sewage, industrial waste etc.
- Gangasagar or G-5 (21º47ʹN & 88º03ʹE): This is located in the South 24 Parganas district of West Bengal. Bathing, fishing, tourist activities are evident here.
Water Analysis: For the analysis of different limnochemical parameters monthly sampling of water from all the stations was done for two years (from March-2017 to February-2019) and monthly collections of the water samples were prepared from each of the sampling stations between 7 am to10 am. During each sampling water samples are collected in three replicates from surface, column and bottom of each sampling station and average values of all observations are taken into consideration (Debnath et al., 2013). Water samples are also collected twice along the opposite river banks and once from the middle of the width. Average of three samples has been recorded as monthly data for each parameter.
Estimation of various physico-chemical parameters like water temperature, pH, DO were done on the spot. Water temperature and pH was recorded with the help of mercury bulb thermometer and portable pH meter (Hanna, model) respectively. DO of the water samples were analysed by Sodium azide modification of Winkler’s method (Ghosh & Panigrahi, 2018). Rest of the physico- chemical parameters of water samples collected from different study sites were analysed in the laboratory within 24 hours following the standard methods (APHA, 1985; APHA, 2005; APHA, 2012; Chattopadhyay, 1998).
Statistical analysis: The limnological data of the two year study period was assembled for three seasons (by taking mean values of each parameter for four months of respective season) and assessment was done for seasonal variations, viz., Pre-monsoon (from March to June), Monsoon (from July to October) and Post-monsoon (from November to February). Mean, Standard Error of Mean and One- Way ANOVA for various parameters for three seasons and multivariate statistical analysis PCA (Principal Component Analysis) were performed using SPSS 18.0 for Windows, MS Excel 2010 and PAST ver. 4.0.
Table 1. Limnochemical profile of water at different sampling stations (PRM=pre-monsoon, MON=Monsoon, POM=Post-monsoon) from Mar-2017 to Feb-2018.
| Stations | Seasons | Water Temperature (˚C) | pH | Hardness
(mg/l) |
DO
(mg/l) |
BOD
(mg/l) |
COD (mg/l) | Total Nitrogen (mg/l) | Total Phosphorus
(mg/l) |
| Nabadwip
(G1) |
PRM | 30.875±5.07 | 8.03±0.42 | 155.25±14.22 | 9.3±2.09 | 2.39±0.65 | 10.05±1.49 | 0.76±0.62 | 0.021±0.006 |
| MON | 28.625±0.47 | 7.3±0.32 | 110.25±29.30 | 6.48±0.55 | 3.51±1.17 | 11.87±2.50 | 1.67±1.09 | 0.076±0.010 | |
| POM | 22.625±4.49 | 8.25±0.21 | 131.5±25.51 | 7.5±0.76 | 3.36±1.51 | 15.6±4.10 | 1.04±0.53 | 0.052±0.022 | |
| Naihati
(G2) |
PRM | 23.12±1.70 | 7.98±0.33 | 163.5±15.67 | 8.7±2.00 | 2.03±1.45 | 14.10±5.23 | 0.82±0.633 | 0.06±0.036 |
| MON | 30.5±0.62 | 7.39±0.05 | 107.75±37.31 | 6.05±0.59 | 3.63±0.73 | 14.58±3.89 | 1.83±1.50 | 0.094±0.057 | |
| POM | 27.25±2.44 | 8.25±0.23 | 121.75±23.62 | 6.27±1.60 | 3.45±1.19 | 13.27±6.55 | 0.757±0.379 | 0.12±0.096 | |
| Dakshineswar
(G3) |
PRM | 31.45± 0.97 | 8.0 ± 0.49 | 108.69±11.62 | 6.13±0.31 | 4.48±0.48 | 12.34±3.81 | 0.45±0.14 | 0.06 ± 0.04 |
| MON | 28.42 ± 0.89 | 7.22±0.58 | 92.28±5.41 | 4.8 ± 0.45 | 4.83±0.54 | 17.79±1.52 | 0.95±0.16 | 0.12 ± 0.07 | |
| POM | 24.32± 2.69 | 7.32 ± 0.55 | 86.02± 7.61 | 5.39±0.55 | 3.99±1.65 | 9.97± 1.11 | 0.91 ± 0.10 | 0.09± 0.03 | |
| Garden Reach
(G4) |
PRM | 31.39 ± 3.16 | 7.7 ± 0.63 | 105.06±13.78 | 5.32±0.56 | 4.80±2.20 | 9.30 ± 2.72 | 0.73± 0.18 | 0.078± 0.05 |
| MON | 30.02± 2.25 | 7.62±0.35 | 100.04±10.29 | 4.98±0.71 | 5.52±1.84 | 13.07±3.61 | 1.33 ± 0.63 | 0.05± 0.04 | |
| POM | 21.10 ±2.63 | 7.67±0.47 | 95.48 ± 13.82 | 5.93±1.23 | 4.53±1.04 | 7.78 ± 2.88 | 1.41± 0.59 | 0.08± 0.04 | |
| Gangasagar
(G5) |
PRM | 29±4.83 | 7.39±0.36 | 380.25±33.27 | 7.12±0.94 | 2.86±1.80 | 27.32±10.62 | 0.665±0.24 | 0.06±0.021 |
| MON | 27±3.69 | 7.24±0.18 | 335±30.81 | 5.97±0.59 | 3.66±1.46 | 22.03±8.59 | 0.525±0.10 | 0.052±0.027 | |
| POM | 25.75±4.54 | 7.76±0.34 | 365.25±60.25 | 6.06±0.64 | 2.93±1.58 | 26.83±11.47 | 1.295±0.39 | 0.077±0.068 |
Table 2. Limnochemical profile of water at different sampling sites (PRM=pre-monsoon, MON=Monsoon, POM=Post-monsoon) from Mar-2018 to Feb-2019.
| Stations | Seasons | Water Temperature (˚C) | pH | Hardness
(mg/l) |
DO
(mg/l) |
BOD
(mg/l) |
COD (mg/l) | Total Nitrogen
(mg/l) |
Total Phosphorus
(mg/l) |
| Nabadwip
(G1) |
PRM | 32.4±4.03 | 8.29±0.26 | 148.4±18.28 | 8.40±1.29 | 2.29±1.29 | 11.25±4.20 | 1.306±0.60 | 0.06±0.05 |
| MON | 25.68±1.44 | 7.70±0.51 | 114.12±31.49 | 6.15±1.33 | 3.93±1.42 | 12.00±4.93 | 0.69±0.38 | 0.065±0.019 | |
| POM | 27.62±4.11 | 8.09±0.18 | 118.25±17.16 | 6.51±1.09 | 3.75±1.49 | 11.42±4.13 | 0.54±0.27 | 0.068±0.014 | |
| Naihati
(G2) |
PRM | 31.75±1.70 | 8.23±0.33 | 125.5±15.67 | 7.8±2.00 | 2.16±1.48 | 6.68±1.74 | 1.15±0.091 | 0.063±.026 |
| MON | 31.12±0.62 | 8.01±0.05 | 106.0±37.31 | 6.2±0.59 | 4.62±0.84 | 7.47±2.14 | 1.05±0.521 | 0.046±.016 | |
| POM | 25.0±2.44 | 7.85±0.23 | 113.16±23.62 | 5.4±1.60 | 4.88±0.59 | 15.21±4.14 | 0.55±0.171 | 0.060±.011 | |
| Dakshineswar
(G3) |
PRM | 33.81± 1.13 | 7.72± 0.29 | 122.45 ± 9.82 | 7.04± 0.62 | 1.22± 0.23 | 12.82 ± 2.64 | 0.58 ± 0.12 | 0.12± 0.04 |
| MON | 30.29± 2.14 | 7.82±0.38 | 112.75±8.36 | 6.15± 0.47 | 1.65 ±0.23 | 16.96 ± 2.63 | 1.075±0.23 | 0.14 ±0.09 | |
| POM | 23.61±0.83 | 7.90±0.37 | 118.4± 6.63 | 6.39± 0.61 | 1.27± 0.15 | 12.24± 2.09 | 1.25± 0.24 | 0.145± 0.091 | |
| Garden Reach
(G4) |
PRM | 34.63 ±1.21 | 7.77± 0.26 | 121.61± 8.72 | 6.32 ± 0.66 | 1.28± 0.11 | 11.84± 2.27 | 0.96 ±0.11 | 0.14± 0.06 |
| MON | 30.34 ±1.58 | 7.67 ±0.47 | 105.49 ± 8.36 | 6.71 ± 0.28 | 1.43 ±0.23 | 15.31± 2.14 | 1.39 ±0.31 | 0.10±0.03 | |
| POM | 18.40±1.03 | 7.7±0.40 | 112.48± 9.55 | 6.92± 0.38 | 1.26± 0.22 | 9.15 ± 1.13 | 1.35± 0.15 | 0.11 ±0.03 | |
| Gangasagar
(G5) |
PRM | 31.625±5.11 | 7.68±0.26 | 574.2±69.78 | 6.93±0.60 | 2.45±0.81 | 31.73±13.02 | 0.458±0.14 | 0.132±0.092 |
| MON | 27.87±1.06 | 7.57±0.17 | 450.68±78.91 | 6.11±0.66 | 2.86±0.85 | 21.48±8.44 | 1.140±0.21 | 0.06±0.032 | |
| POM | 22.8±3.83 | 7.49±0.34 | 358.45±96.70 | 5.93±1.07 | 2.81±0.56 | 13.57±2.42 | 1.365±0.76 | 0.205±0.168 |
Component Matrixa
Table 3. Rotated component matrix
| Component | |||
| 1 | 2 | 3 | |
| COD | .837 | .385 | -.195 |
| Hardness | .773 | .495 | -.108 |
| pH | -.698 | .458 | -.120 |
| DO | -.447 | .803 | .059 |
| BOD | .050 | -.710 | -.624 |
| Total Phosphorus | .376 | -.029 | .724 |
| Total Nitrogen | -.110 | -.301 | .651 |
| WT | -.053 | .239 | -.378 |
Extraction Method: Principal Component Analysis.
a. 3 components extracted.
Figure 3: Scree plot of PCA sowing all components
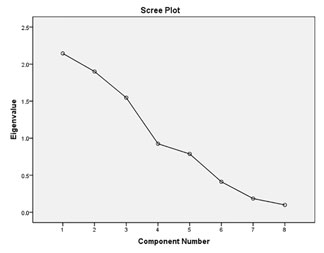
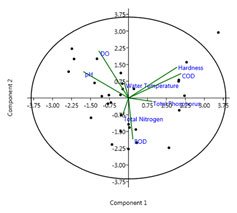
Figure 4: PCA biplot ordination for limnochemical parameters of Hooghly river (factor plane1x2)
RESULT AND DISCUSSION
Table 1 & 2 present the excerpt of results of analysis of different limnochemical of River Hooghly at different sampling stations at different seasons. One way ANOVA result revealed that significant seasonal variation (F=76.52, P<0.05) in temperature was evident in this river. But temperature difference was not significant among sampling stations. Observed water temperature range (18.04 to 34.63) falls within the rage for inland water in tropics (Imoobe and Koye, 2011). The range of pH in the studied stretch of the river showed sub-alkaline in nature (7.22 to 8.29) that was within the permissible limit as prescribed by WHO (2011).
Marked variation in pH was observed among the studied sampling stations as well as between the seasons. Actually pH level is controlled by various factors including human made waste (Omer, 2010). Water quality can be affected by pH as it can influence the alkalinity, solubility and hardness (Osibanjo et al., 2011). Similar temperature range as the recent study was also reported by Mitra et al., (2018) in same river in the same stretch. The minimal variation in temperature among sampling stations might be attributed to absence of microclimatic variation. Mitra et al., (2018) pointed out the impact of south west monsoon behind such temporal variation in temperature.
From the result it was apparent that the total Hardness level spanned a wide range in the river (86.02 mg/l to 574.2 mg/l). High calcium and magnesium content is responsible for elevated harness level. Hardness values significantly differ among sampling stations as observed in the one way ANOVA results. G5 Sampling station had experienced considerably higher Hardness level all throughout the study period. This might be due to its close proximity with sea. Increased DO values ranging from 4.8 mg/l to 9.3 mg/l is helpful for avoiding the condition of hypoxia threshold (Satpathy et al., 2013; Soo et al., 2016). Our finding is in close conformity with the State environment report West Bengal (2016). Though relatively lower DO level was evident from downstream sampling stations. This range of DO in the lower stretch of River Ganga as observed in our study is very similar to the findings of Mitra et al., (2018) and Dutta et al., (2020); but Nath et al., (2017) reported further lower DO level in this stretch. Significant fluctuations in DO level were evident between seasons. Temporal variation in Phyto-planktonic assemblage, differential organic pollution load might be liable for such differences.
High average BOD levels at several points in the Hooghly River like G3 and G4 were observed from CPCB (2013) report and also from recent database of West Bengal Pollution Control Board (WBPCB – www.wbpcb.gov.in). Our finding finds similarity with this report. Higher BOD values at G4 Sampling station can be due to high influx of untreated municipal sewage through Adiganga Chanel, which discharges its content just upstream to G4 sampling site. When raw sewage (both domestic and municipal) is mixed directly with industrial waste water, it exerts a negative impact on self-cleaning activity of the river and the organic pollutants from domestic and municipal sewages diluted quite faster than the industrial inorganic pollutants (Bhaskar et al., 2020).
Possibly due to spatial difference in organic pollution load, COD level significantly varied across sampling stations. Total Nitrogen and Total Phosphorus level varied across sampling stations. Phosphate addition can be from industrial effluent, soap and detergents used during bathing and laundry activities. Excessive use of chemical fertilizers in the agricultural lands in this river basin might be responsible for addition of nitrogenous content in the river.
Liu et al., (2003) classified factor loading into 3 classes, these are- strong (>0.75), moderate (0.50-0.75) and weak (0.30-0.50). Component 1 was positively loaded with COD and Total Hardness and negative loadings of DO and pH. Component 2 was dominated by negative loadings of BOD whereas positively loaded with DO. Component 3 is positively loaded with Total Phosphorus, Total Nitrogen and negatively loaded with BOD. This moderate to high loadings of BOD, COD could be attributed to greater array of anthropogenic pollution sources along this river. In component 3 significant positive loadings of Total Phosphorus and Total Nitrogen would be attributed to nutrient enrichment phenomena prevailing at different stations due to surface runoffs and domestic sewage disposal.
According to Rai (2013) numerous industries including textile mills, Paper mills, fertilizer plants etc. are positioned on either sides of Ganga River from the stretch of Uttarakhand to Bengal. Dhara et al., (2015) pointed out the addition of fly ash from different thermal power stations located on the bank of this river and the river water was not suitable even for bathing purpose except the upper stretch (i.e., from Gangotri to Haridwar ) (Kamboj and Kamboj, 2019). Dey et al., (2020) also pointed out the degradation of water quality, lack of supportive habitat, over fishing and destructive fishing as the major causes of declination of fish diversity throughout the stretch of river Ganga.
Significant results of Barletts test of sphericity indicated that the data was fit for PCA analysis. Application of PCA brought out three (03) factors with >1 eigenvalues. These three (03) factors explained more than 69% variation. In order to identify the number of PCs to discern the nature of underlying data structure the scree plot was applied (Fig: 3). Component matrix and PCA biplot are shown in Table 3 and Fig. 4 respectively.
CONCLUSION
On the basis of different limnochemical parameters investigated, it might be concluded that ecological stresses in the form of raw municipal sewage, industrial wastes and agricultural runoffs have influenced the water quality in all the study areas of the tidal stretch of River Hooghly. Although State and Central Govt. have taken several initiatives to ameliorate the pollution load of river Ganga and some of its tributaries. But the problem is that all the tributaries of river Ganga are not included into these projects. River conservation and management measures in India like most other countries, also suffers from inadequate knowledge of riverine biota.
Diminished productivity and less fish diversity in this stretch are responsible for the incurred economic stress to the dependent riverside fishermen. Huge pollution load in the study areas is one of the prime reasons for less production and less diversity. The information coming out of this study will form a base line in adopting future policies and conservation measures for the restoration of ecological health of the concerned riverine stretch. The proper implementation of the research idea can provide a fruitful result in solving the major socio-economic problems of river-side fishers.
ACKNOWLEDGEMENTS
The authors are highly grateful to the Head, Department of Zoology, Berhampur University, Bhanjabihar, Berhampur, Odisha and Head, Department of Zoology, University of Kalyani, Kalyani, West Bengal for providing laboratory facilities to carry out the research work. The authors also acknowledge DST PURSE-II, University of Kalyani for financial assistance.
Conflict of Interest: Authors have declared that there is no conflict of interest.
REFERENCES
Agarwal P K (2015) A review of Ganga river pollution-reasons and remedies. Journal of Indian Water Resources Society, 35(3) 46-52
Alam M A (2020) A Note on “Metal Distribution and Short-Time Variability in Recent Sediments from the Ganges River towards the Bay of Bengal (India)” by Bonnail et al (2019) Geosciences 2020 10 61
APHA (American Public Health Association) (1985) Standard Methods for the examination of waste and waste water16th ed American Public Health Association Washington DC
APHA (American Public Health Association) (2005) Standard Methods for the Examination of Water and Wastewater 21st ed American Public Health Association Washington DC
APHA (American Public Health Association) (2012) Standard Methods for the Examination of Water and Wastewater 22nd ed American Public Health Association Washington DC
B Gopal (2000) River conservation in the Indian subcontinent in: P J Boon B R Davies G E Pelts (Eds) Global Perspectives on River Conservation: Science Policy and Practice Wiley London 2000 pp 233e261
Bhaskar M Dixit A.K Ojha K K Dubey S Singh A and Abhishek A (2020) The impact of anthropogenic organic and inorganic pollutants on the Hasdeo River Water Quality in Korba Region Chhattisgarh India Bioinformation 16 (4) 332–340
Bonnail E Antón-Martín R Riba I and DelValls T Á (2019) Metal Distribution and Short-Time Variability in Recent Sediments from the Ganges River towards the Bay of Bengal (India) Geosciences 2019 9 260
Chattopadhyay G N (1998) Chemical analysis of fish pond soil and water Daya Publishing House Delhi
Chaudhary M Mishra S and Kumar A (2017) Estimation of water pollution and probability of health risk due to imbalanced nutrients in River Ganga India Intl J River Basin Manage 15 (1) 53–60
Chaudhary M and Walker T R (2018) RE: A remedy at last for the ailing Ganges? – Pollution in the river Ganga is not new but is there any way to save the holy river? In: Science e-Letter Retrieved from http://science.sciencemag.org/content/332/6028/412/ tab-e-letters
CPCB (2013) July 2013 Pollution assessment: River Ganga 2013 Government of India
Das P and Tamminga K R (2012) The Ganges and the GAP: an assessment of efforts to clean a sacred river Sustainability 4 (2012) 1647e1668
Debnath S Bakshi A and Panigrahi A K (2013) Ecology and zooplankton diversity of a floodplain wetland In West Bengal India Proc Nat Con Cha Bio Res Man ISBN 978-81-927762-0-0 Pp 204
Dey S Choudhary S K Dey S Deshpande K and Kelkar N (2020) Identifying potential causes of fish declines through local ecological knowledge of fishers in the Ganga River eastern Bihar India Fisheries Manage and Ecol 27 140–154
Dhara K Panigrahi A K and Saha N C (2015) Effect of fly ash pollution on fish diversity at Bhagirathi River in Murshidabad district West Bengal Fish Environment and Human Health pp 185-193
Dutta V Dubey D and Kumar S (2020) Cleaning the River Ganga: Impact of lockdown on water quality and future implications on river rejuvenation strategies The Science of the Total Environment 743 140756 https://doi.org/10.1016/ j scitotenv2020 140756
Ganga Action Parivar (2015) Annual report – 2015 www.gangaaction.org
Ghosh P and Panigrahi A K (2018) A comprehensive study on correlation of gastropod diversity with some hydroenvironmental parameters of selected waterbodies of lower Damodar basin West Bengal India Journal of Applied and Natural Science 10(4):1259-1265
Imoobe T O T and Koye P I O (2011) Assessment of the impact of effluent from a soft drink processing factory on the physico-chemical parameters of Eruvbi stream Benin City Nigeria Bayero Journal of Pure and Applied Sciences 4 126–134
Kamboj N and Kamboj V (2019) Water quality assessment using overall index of pollution in riverbed-mining area of Ganga-River Haridwar India Water Sci 33 65–74
Liu W X Coveney R M and Chen J L (2003) Environmental quality assessment on a river system polluted by mining activities Applied Geochemistry 18 749–764
M M Rahaman (2009) Principles of transboundary water resources management and Ganges treaties: an analysis Water Resour Dev 25 (2009) 159e173
Mitra S Kumar S Raja P and Kumar J (2018) Dissolved trace elements in Hooghly (Ganges) River Estuary India: Risk assessment and implications for management Marine Pollution Bulletin 133(March) 402–414 https://doi.org/10.1016/ j marpolbul 2018 05 057
Nath S Mukherjee R Bose S and Ghosh S (2017) A short period assessment of water physicochemical characteristics of Hooghly River West Bengal India Int Res J Environment Sci 6(2) 1-6 ISSN 2319–1414
National River Conservation Directorate MOEF (2009) Status paper on river Ganga State of Environment and Water Quality Alternate Hydro Energy Centre Indian Institute of Technology Roorkee pp-05
Omer W M M (2010) Ocean Acidification in the Arabian Sea and the Red Sea Faculty of Mathematics and Natural Sciences Institute Chemical Oceanography
Osibanjo O Daso A P and Gbadebo A M (2011) The impact of industries on surface water quality of River Ona and River Alaro in Oluyole Industrial Estate Ibadan Nigeria African Journal of Biotechnology 10 (4), 696–702
Pal S Kundu S and Mahato S (2020) Groundwater potential zones for sustainable management plans in a river basin of India and Bangladesh J Clean Prod 257 120311
Paul D and Sinha S N (2013) Assessment of various heavy metals in surface water of polluted sites in the lower stretch of river Ganga West Bengal: a study for ecological impact Discov Nat 6 (2013) 8e13
Rai B (2013) Pollution and Conservation of Ganga River in Modern India International Journal of Scientific and Research Publications 3(4) April 2013 1 ISSN 2250-3153
Rudra K (2016) State of India’s Rivers for India Rivers Week 2016 WBPCB (West Bengal Pollution Control Board) West Bengal India
Satpathy K K Panigrahi S Mohanty A K Sahu G Achary M S Bramha S N Padhi R K Samantara M K Selvanayagam M and Sarkar S K (2013) Severe oxygen depletion in the shallow regions of Bay of Bengal off Tamil Nadu coast Curr Sci 104 (11) 1467
Soo C L Ling T Y and Lee N A K (2016) Assessment of the characteristic of nutrients total metals and fecal coliform in Sibu Laut River Sarawak Malaysia Applied Water Science 2016 6 77–96
State of Environment Report West Bengal (2016) West Bengal Pollution Control Board
WBPCB (West Bengal Pollution Control Board) Database – www.wbpcb.gov.in
WHO (World Health Organization) (2011) Guidelines for drinking water quality 4th ed http://www.who.int/water-sanitation-health/publications/2011/dwq-guidelines/en/(accessed14 April 2019)

