S Priya![]() and R Manavalan
and R Manavalan![]()
Department of Computer Science, Arignar Anna Government
Arts College, Villupuram, Tamil Nadu, India.
Corresponding author email: priyasri.ash@gmail.com
Article Publishing History
Received: 04/06/2021
Accepted After Revision: 24/09/2021
The detection of gene-gene interactions (GGIs) is essential in determining disease susceptibility of complex human diseases. Epistasis (genetic interactions) is defined as interactions between varied Single-Nucleotide Polymorphism (SNPs). Numerous computational strategies for detecting SNP interactions have been suggested. However, currently available methods are overwhelmed by a high degree of computational complexity caused by the explosion of high-order interactions. This research aims to develop a multi-locus epistasis model that accelerates the detection of disease-related SNP-SNP interactions. This paper introduces a two-stage method for epistasis detection based on K-Means clustering and optimization strategies to find genetic interactions of complex human diseases. K-Means clustering algorithm segments the genotype dataset into different clusters during the screening stage. The accuracy and performance of the K-Means clustering algorithm are highly dependent on the selection of the initial centroids.
The initial centroids are usually randomly chosen in K-Means algorithm which leads to closest possible local minima, rather than the global optimum. To address the above issue, we introduced a hybridized technique that is built on the K-Means algorithm and the Pillar algorithm to avoid local optima as well as all the SNPs falls into a unique collection of clusters for different runs. Salp optimizations with a single objective function (Salp-SO) and Salp optimization with multiple objective functions (Salp-MO) have been applied to the clusters during the search stage to identify disease-associated SNP combinations. Experimental findings indicated that the KMeans-Pillar-SalpEpi-MO method yielded superior performance than traditional K-Means with the Salp optimization technique. This study is expected to become a suitable milestone for future studies by becoming a credible source of updated information on Kmeans-Pillar-Salpepi.
Epistasis; Genetic Interactions; K-Means, Pillar, Single Nucleotide Polymorphism.
Priya S, Manavalan R. Kmeans-Pillar-Salpepi: Genetic Interactions Detection Through K-Means Clustering with Pillar and Salp Optimization Techniques in Genome-Wide Association Studies. Biosc.Biotech.Res.Comm. 2021;14(3).
Priya S, Manavalan R. Kmeans-Pillar-Salpepi: Genetic Interactions Detection Through K-Means Clustering with
Pillar and Salp Optimization Techniques in Genome-Wide Association Studies. Biosc.Biotech.Res.Comm. 2021;14(3). Available from: <ahref=”https://bit.ly/3mbgVBi“>https://bit.ly/3mbgVBi</a>
Copyright © Priya and Manavalan This is an open access article distributed under the terms of the Creative Commons Attribution License (CC-BY) https://creativecommns.org/licenses/by/4.0/, which permits unrestricted use distribution and reproduction in any medium, provide the original author and source are credited.
INTRODUCTION
The principle of epistasis played an influential role in the research field of genomics and genetics for over a century. A genetic interaction is a set of genetic changes that may cause an unexpected loss or benefit of cell viability (Skwark et al. 2017). A single-nucleotide polymorphism (SNP) is a mutation in a single nucleotide present in most human genomes. Variation in SNPs are responsible for identifying diseases susceptibility in human (Leaché and Oaks 2017).
A genome-wide association analysis (GWAS) investigates various genetic variants among the whole genome to identify those that have statistically significant connections with a particular disease manifestation (Elliott et al. 2018). GWAS researchers strive to identify significant genotype variants for various disease categories, such as high blood pressure, arthritis, leukemia, chronic disease, heart disease, obesity, psoriasis, etc. GWAS examined multiple SNPs and phenotypic biomarkers related to human disease cases and controls. Identifying epistasis is a common way to discover the aetiology of complex disorders (Tam et al. 2019).
Typically, several possible techniques have been used to discover epistasis: stochastic search, exhaustive search, statistical-based techniques, and optimization-based strategies. Researchers employed both parametric and nonparametric statistical approaches in epidemiological research to identify genetic associations. Stochastic search methods use random sampling strategies to identify the combinations of epistasis statistically correlated to disease effects. Stochastic search is subject to randomness, so it takes too little time to complete the search than the exhaustive search (Sun et al. 2019; Priya and Manavalan 2020).
It is possible to discover all disease correlated SNP combinations through exhaustive research, but its computational cost is exorbitant. It analyzes each SNP interaction by estimating interaction’s score and select the interactions that correspond with a disease using the user-specified threshold. The epistasis-based algorithms such as MDR, GMDR, BOOST, ES-MDR, PLINK, GMDR-GPU are evaluated based on exhaustive analysis (Priya and Manavalan 2020).
An exhaustive and stochastic algorithm demands substantial computational expenses and a proneness only to specific disease models. Recently, evolutionary algorithms for epistasis identification have significantly been concerned with finding low-cost solutions to address computational problems. Evolutionary strategies reduce search time complexity, and scoring functions aid them to detect the best SNP combinations. The epistasis techniques like MACOED, CSE, epiACO, epiBat, and EIMOABC/D can be employed as an optimization strategy (Manavalan and Priya 2021).
We presented a novel epistasis identification strategy using a two-stage approach called hybridization of K-Means clustering with Pillar algorithm and Salp Swarm Algorithm (SSA) for Epistasis detection (KMeans-Pillar-SalpEpi) to focus on candidate SNP combinations. The main issues with currently available epistasis detection algorithms often have higher computational cost, low detection power, and almost all models are only designed for looking at two-locus interactions rather than addressing multiple loci interactions.
In contrast to existing methods, the proposed approach aims to identify disease-associated SNPs with high detection power and focus on multi-locus interactions (Manavalan and Priya 2021). This research aims to develop a multi-locus epistasis model that accelerates the detection of disease-related SNP-SNP interactions. The proposed approaches’ efficiency is tested over the 2-locus and 3-locus disease models with marginal effects (DMEs) and disease models with no marginal effects (DNMEs).
MATERIAL AND METHODS
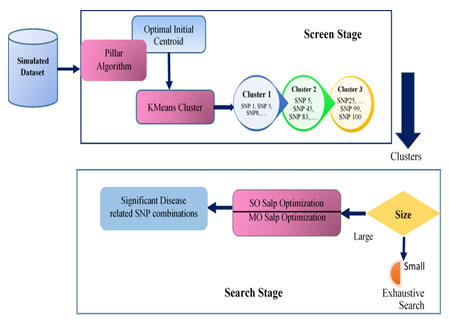
The proposed KMeans-Pillar-SalpEpi algorithm was divided into two stages: the screening stage and the search stage. At the screening stage, the SNPs were categorized into three clusters using the Pillar based K-Means clustering technique. K-Means clustering was fused with pillar algorithm to address the issue of random initial centroid, and determine the optimal initial centroid. The outcome of pillar-KMeans was a set of clusters passed as input into the search stage to identify disease-associated SNP combinations. K-Means clustering is a widely used approach for cluster analysis.
The main aim of this algorithm was to divide n number of unlabeled observations into k number of clusters. The degree of similarity between two objects was measured using Euclidean distance (Su and Dy 2004). Pillar algorithm was based on the pillars position strategy used in the construction of a stable building. The pillars can support the roof’s weight and stabilize the building when placed as far apart from each other as possible in the roof’s pressure distribution. As a result, this algorithm chose initial centroids at the furthest distance apart in the given data (Barakbah and Kiyoki 2009).
Two search strategies were followed during the search stage. When the size of the cluster was small (less than ten), an exhaustive search technique found disease-related SNP combinations within the cluster. In contrast, the salp optimization technique found disease-related SNP combinations within the cluster for a large cluster. The Salp Swarm Algorithm (SSA) is a population-based optimization method.
SSA mimics the social behavior of salps that are chained together when sailing and foraging the food in the sea. There are two types of agents in SSA; the leader is located at the top of the chain, while the other salps are designated as followers. The leader is responsible for guiding the population’s movement direction, while the supporters obey the leader (Mirjalili et al. 2017).
In this research, two variants of the Salp optimization techniques, single-objective (SO) salp optimization and multi-objective (MO) salp optimization, were proposed to identify disease-associated SNP combinations. The G-test served as a fitness function in SalpEpi-SO, whereas K2 score and AIC score act as fitness functions in SalpEpi-MO, and the Pareto optimal front method selected non-dominated SNPs from these two fitness functions. Then, the chosen non-dominant SNPs were evaluated using G-test to identify disease-associated SNP combinations in 2-locus and 3-locus models. Pseudo code for screen stage is presented hereunder.
Step 1: Utilize the Pillar algorithm to initialize cluster centroids; the pillar technique took a simulated dataset as input and generated optimal centroids as outputs.
Step 2: For Each SNP, Euclidean distance was calculated between Si and centroid of cluster Cm (m = 1, 2, 3). Then, SNP (Si), Si (i=1,2, 3, 100) is divided into the mth (1 ≤ m ≤ k) group.
Step 3: Each individual SNP was assigned to one of the k clusters. Then, the centroids of each clusters were updated for each iteration.
Step 4: Steps (2) and (3) were repeated until the centroids of k clusters no longer changed or the maximum number of iterations were reached.
The algorithmic step for Search Stage for SalpEpi-SO is given below.
Step 1: Initialize the salp positions.
Step 2: Assign each salp with a random position based on the SNPs in the clusters
Step 3: While t < max_iter do
For every salp in the solution space, combination of SNPs was chosen. Then, SNP combinations were selected and local solutions were generated based on the G-test statistic. The leader and follower position were updated based on the condition.
End while
The Search Stage for SalpEpi-MO is given below.
Follow the steps Step 1 to Step 3 in SalpEpi-SO
Step 4: Pareto optimal front return the Non-dominated SNPs
Step 5: For i=1 to size (non-dominated SNPs)
For j =i+1 to size (non-dominated SNPs)
Epistasic_pair = G-test (xi, xj)
End For
Finally, the performance of KMeans-Pillar-SalpEpi-SO and KMeans-Pillar-SalpEpi-MO were tested and compared to SalpEpi-SO, SalpEpi-MO and traditional K-Means with salp techniques like KMeans-SalpEpi-SO and KMeans-SalpEpi-MO. The pseudo-code for screen and search stages of KMeans-Pillar-SalpEpi is presented in Figure 2 and Figure 3, respectively. The pseudo-code for screen and search stages of KMeans-Pillar-SalpEpi is presented in Figure 2 and Figure 3, respectively.
RESULTS AND DISCUSSION
The general architecture of the proposed approach is presented in Figure 1.
Figure 1: General Architecture of KMeans-Pillar-SalpEpi
The proposed epistasis models were implemented using MATLAB R2018(b) software. Section 4.3 exposes the experimental outcome of epistasis disease models. The architecture of the proposed approach is exhibited in simulated datasets.
Simulated Datasets: The proposed approach was evaluated over the simulation dataset for genotype created using widely adapted software called GAMETES_2.0 (Urbanowicz et al. 2012). In this research, we generated two-locus and three-locus disease models. Two distinct types of epistatic disease models, such as Disease Loci with Marginal effect (DME) models and Disease Loci without Marginal Effects (DNME) models, were generated for two-locus and multi-locus disease analysis (Tuo et al. 2017). The description of DME and DNME models chosen for experimental analysis is exposed in Table 1.
Table 1. Simulated Dataset Details
| Dataset Name | Disease Model | No. of Models | SNP Details | Description |
| 3-Locus Dataset | DME Models – Additive, Multiplicative, Threshold Models | 5 Models | 3 Pathogenic SNPs
97 Non-Pathogenic SNPs
|
No. of Datasets – 100
No. of Samples – 1600 with 800 cases and 800 controls |
| DNME Models | 10 Models | |||
| 2-Locus Dataset | DME Models – Additive Model, Multiplicative, Threshold models | 4 Models | 2 Pathogenic SNPs
98 Non-Pathogenic SNPs
|
|
| DNME Models | 10 Models |
Performance Metrics: The efficacy of the proposed epistasis detection model was evaluated using evaluation metrics power. Power is defined as the statistical measure of detecting true disease loci by rejecting the null hypothesis, and the same is expressed as

where #Dcount represents the number of datasets containing successful detection of disease-related SNPs among the Total number of Datasets (TDS) (Chen et al. 2019).
Simulation Results and Interpretation: The primary focus of GWAS was to identify associations between SNP and phenotype for the essential of epistasis detection. In this section, the performance of proposed approaches was compared with epistasis detection ability of SalpEpi-SO and SalpEpi-MO with G-test fitness function using DNME and DME models. In addition, the superiority of the proposed methods was compared to the previous research work Multi-Objective Ant Colony Optimization for Epistasis Detection (MACOED) and Multi-Objective Atom Search Optimization for Epistasis
where #Dcount represents the number of datasets containing successful detection of disease-related SNPs among the Total number of Datasets (TDS) (Chen et al. 2019).
Simulation Results and Interpretation: The primary focus of GWAS was to identify associations between SNP and phenotype for the essential of epistasis detection. In this section, the performance of proposed approaches was compared with epistasis detection ability of SalpEpi-SO and SalpEpi-MO with G-test fitness function using DNME and DME models. In addition, the superiority of the proposed methods was compared to the previous research work Multi-Objective Ant Colony Optimization for Epistasis Detection (MACOED) and Multi-Objective Atom Search Optimization for Epistasis Detection (MASO-Epi) (Jing and Shen 2014; Priya and Manavalan 2021).
Experimental Results of 2-Locus DME Models: The power of Salp-SO, Salp-MO, KMeans-SalpEpi-SO, KMeans-SalpEpi-MO, KMeans-Pillar-Epi-SO and KMeans-Pillar-Epi-MO for twelve 2-locus DME models is exhibited in Figure 2. KMeans-Pillar-SalpEpi-MO, KMeans-Epi-SO and KMeans-Pillar-Epi-MO achieved 100% power for the additive model 3. KMeans-Pillar-SalpEpi-MO and KMeans-SalpEpi-SO obtained power of 100% for the additive model 4, which were superior to others. In additive model 1, KMeans-Pillar-Epi-SO obtained the power of 4%, whereas the remaining methods found only a single disease causative SNP pairs among 100 datasets. None of the methods found any disease causative
Figure 2: Power Analysis of 2-locus DME Models
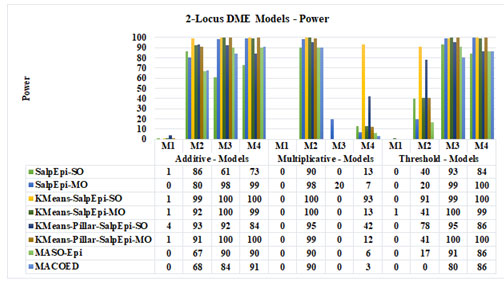
SNP pairs for the multiplicative model 1.
In multiplicative model 2, KMeans-Epi-SO and KMeans-Epi-MO achieved 100% power, whereas KMeans-Pillar-SalpEpi-MO achieved the power of 99%. In threshold model 3, KMeans-SalpEpi-MO and KMeans-Pillar-SalpEpi-MO yielded 100% power. In threshold model 4, KMeans-SalpEpi-SO, Salp-MO and KMeans-Pillar-SalpEpi-MO achieved 100% power. The experimental finding proved that one of the proposed methods, KMeans-Pillar-SalpEpi-MO yielded superior detection power compared to others. Among the 12 DME models MACOED and MASO-Epi didn’t yield 100% detection power even for a model, whereas KMeans-Pillar-SalpEpi-MO produced 100% detection power for 4 models. It was clearly observed that KMeans clustering with salp optimizations performs superior to the existing algorithms MACOED and MCASO-Epi for all DME models (Jing and Shen 2014; Priya and Manavalan 2021).
The running time of twelve 2-Locus DME models is exposed in Figure 3. For all the 12 DME models, the approaches KMeans-Pillar-SalpEpi-SO and KMeans-Pillar-SalpEpi-MO take the lowest running time. The highest running time required for 2-locus DME models was
Figure 3: Running Time Comparison of 2-locus DME Models
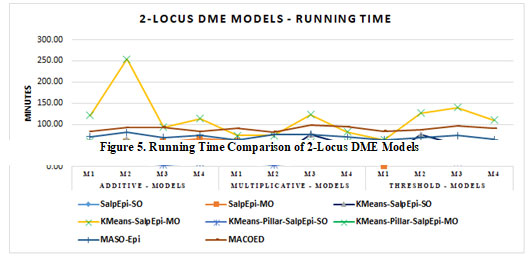
KMeans-SalpEpi-MO. It was noticed that our proposed single objective models KMeans-Pillar-SalpEpi-SO, KMeans-SalpEpi-SO took minimum running time compared to others. Further, the time consumption of one of the proposed multi-objective model KMeans-Pillar SalpEpi-MO models was lower than the state-of-art methods MACOED and MASO-Epi (Jing and Shen 2014; Priya and Manavalan 2021).
Experimental Results of 2-Locus DNME Models: Figure 4 exposed the detection power of proposed approaches for all the 2-Locus DNME models. Among the 10 DNME models, KMeans-Pillar-SalpEpi-MO achieved 100% power for all the models, which was superior to others. The KMeans-Pillar-SalpEpi-SO achieved 100% detection power for seven models, such as model 1, model 2, model 5 to model 8, and model 10. KMeans-SalpEpi-MO obtained 100% power for 6 DNME models such as model 1, model 4 – model 6, model 8, and model 9. The SalpEpi-MO yielded 100% power for four models such as model 1, model 2, model 5 and model 8.
The SalpEpi-SO achieved the highest detection power of 97% for model 9. MACOED obtained 93% detection power for 4 DNME models, whereas proposed model KMeans-Pillar-SalpEpi-MO gained 100% detection power in all DNME models. The MASO-Epi achieved the minimum detection power of 85% for model 9 and, maximum detection power of 90% in model 1. Hence, the outcome revealed that our proposed models were superior to MACOED and MASO-Epi in all 10 DNME models (Jing and Shen 2014;
Figure 4: Power Analysis of 2-Locus DNME Models
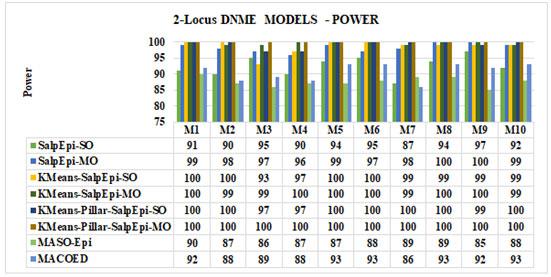
Priya and Manavalan 2021).
Figure 5 presented the running time of 2-locus DNME models. For all the ten models, the KMeans-Pillar-SalpEpi-SO and KMeans-SalpEpi-SO require minimal running time compared to others. The SalpEpi-MO method spent the highest running time for all ten models. The state-of-art methods such as MACOED and MASO-Epi consumed more running
Figure 5: Running Time of 2-Locus DNME Models
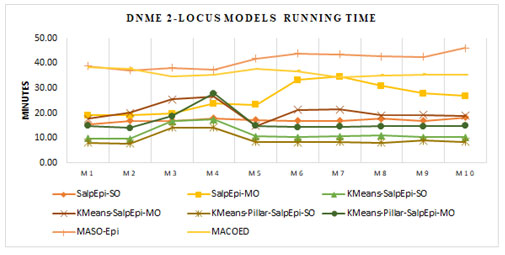
time, whereas the proposed models KMeans-Pillar-SalpEpi-SO and KMeans-Pillar-SalpEpi-MO took less running time for all DNME models. The state-of-art approaches such as MACOED and MASO-Epi was tested over 2-locus interactions only due to the computational overhead. Hence, these two models were not considered as comparative methods in this research for the analysis of 3-locus disease models (Jing and Shen 2014; Priya and Manavalan 2021).
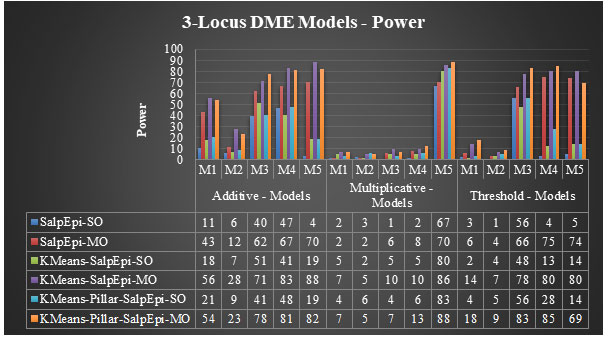
Experimental Results of 3-Locus DME Models: The power of proposed approaches for fifteen 3-Locus DME models was exhibited in Figure 6. For the additive model 1, KMeansEpi-MO and KMeans-Pillar-SalpEpi-MO achieved 56% and 54% of power, respectively, which were superior to other approaches. The KMeans-Pillar-SalpEpi-MO yielded the power of 78% for additive model 3. In additive model 4, KMeans-SalpEpi-MO obtained the highest power of 83%, which was superior to the other five approaches. KMeans-SalpEpi-MO gained the power of 88% for model 5, which was superior to Salp-SO, Salp-MO, KMeans-SalpEpi-SO, KMeans-Pillar-SalpEpi-SO, and KMeans-Pillar-SalpEpi-MO, respectively.
KMeans-Pillar-SalpEpi-MO obtained the highest detection power of 88% for multiplicative model 5. KMeans-SalpEpi-MO obtained the highest detection power of 80% for threshold model 5, whereas SalpEpi-SO gained the lowest detection power of 5%. In threshold model 4, KMeans-Pillar-SalpEpi-MO yielded the power of 85%, which was 5% higher than KMeans-SalpEpi-MO.
KMeans-Pillar-SalpEpi-MO obtained the highest detection power of 83%, whereas KMeans-SalpEpi-SO achieved the lowest detection power of 48% for the threshold model 3. The efficacy of the methods highly dependent on the nature of the dataset, and its dimension and the simulated parameter settings. The DualWMDR approach was proposed to find high-order epistasis interactions and tested over two 3-locus disease models with and without marginal effects. The DualWMDR achieved 82% power for a DME model (Cao et al. 2020).
Figure 6: Performance Evaluation of 3-Locus DME Models
The running time of 3-Locus DME models was exposed in Figure 7. KMeans-Pillar-SalpEpi-SO taken the lowest running time compared to Salp-SO and Salp-MO, KMeans-
SalpEpi-SO and KMeans-SalpEpi-MO. The SalpEpi-MO approach taken the highest running
Figure 7: Running Time of 3-Locus DME Models
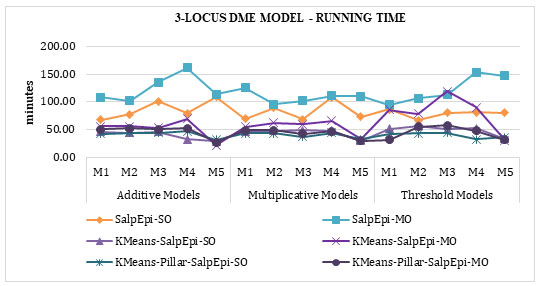
time for all the 15 DME models.
Experimental Results of 3-Locus DNME Models: The detection power of ten 3-Locus DNME models is presented in Figure 8. The highest accuracy of 87% is obtained for Model 3 by KMeansEpi-MO, whereas KMeans-Pillar-SalpEpi-MO achieved 83% for the same model.
The Running time of ten 3-Locus DNME models is shown in Figure 9. The line chartThe second highest detection power was 66% yielded by KMeans-Pillar-SalpEpi-MO for the model 10. Salp-SO obtained the lowest detection power of 1% for Model 1. The experimental outcome revealed that clustering-based approaches were superior to Salp-MO and Salp-MO for the 3-Locus DNME models.
The Running time of ten 3-Locus DNME models is shown in Figure 8. The line chart
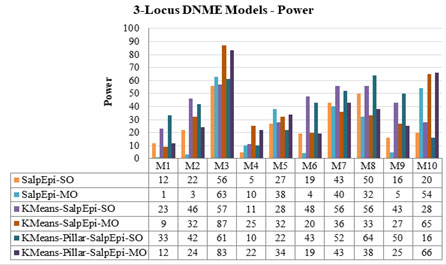
Figure 9
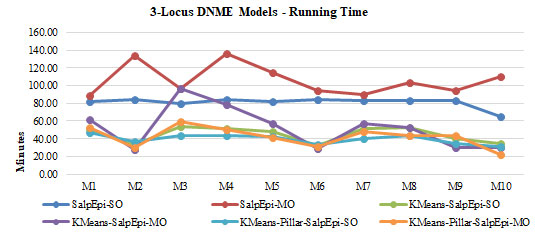
clearly proved that the KMeans-Pillar-SalpEpi-SO and KMeans-Pillar-SalpEpi-MO were taken the lowest running time for 10 DNME models compared to others.
CONCLUSION
The findings of the present study highlight the discovery of epistatic interactions aids in the detection of complex human diseases in GWAS. In this paper, we proposed a two-stage method called KMeans-Pillar-SalpSO and KMeans-Pillar-SalpMO. The proposed methods were more suitable for finding higher-order SNP interactions during the search stage through exhaustive search or optimization-based search. Exhaustive search was applied to a small clustered dataset, and salp based search was used for a large candidate set. The proposed method had the capability for discovering high-order epistatic interactions with a minimal computational effort. The results from the experiment on simulated datasets showed that KMeans-Pillar-SalpSO and KMeans-Pillar-SalpMO outperform SalpEpi-SO and SalpEpi-MO.
Conflict of Interests: Authors declare no conflicts of interests to disclose.
REFERENCES
Barakbah, A.R. and Kiyoki, Y. (2009), A new approach for image segmentation using Pillar-Kmeans algorithm, World Academy of Science, Engineering and Technology, Vol. 59 No. 11, pp. 23–28.
Cao, X., Yu, G., Ren, W., et al. (2020), DualWMDR: Detecting epistatic interaction with dual screening and multifactor dimensionality reduction, Human Mutation, John Wiley & Sons, Ltd, Vol. 41 No. 3, pp. 719–734.
Chen, Q., Zhang, X. and Zhang, R. (2019), Privacy-preserving decision tree for epistasis detection, Cybersecurity, Cybersecurity, Vol. 2 No. 1, available at:https://doi.org/10.1186/s42400-019-0025-z.
Elliott, L.T., Sharp, K., Alfaro-Almagro, F., et al. (2018), Genome-wide association studies of brain imaging phenotypes in UK Biobank, Nature, Vol. 562 No. 7726, pp. 210–216.
Jing, P.-J. and Shen, H.-B. (2014), MACOED: A multi-objective ant colony optimization algorithm for SNP epistasis detection in genome-wide association studies, Bioinformatics (Oxford, England), Vol. 31 No. 5, pp. 634–641.
Leaché, A.D. and Oaks, J.R. (2017), The Utility of Single Nucleotide Polymorphism (SNP) Data in Phylogenetics, Annual Review of Ecology, Evolution, and Systematics, Annual Reviews, Vol. 48 No. 1, pp. 69–84.
Manavalan, R. and Priya, S. (2021), Genetic interactions effects for cancer disease identification using computational models: a review, Medical & Biological Engineering & Computing, United States, Vol. 59 No. 4, pp. 733–758.
Mirjalili, S., Gandomi, A., Mirjalili, S.Z., et al. (2017), Salp Swarm Algorithm: A bio-inspired optimizer for engineering design problems, Advances in Engineering Software, Vol. 114, available at:https://doi.org/10.1016/j.advengsoft.2017.07.002.
Priya, S. and Manavalan, R. (2021), Multi-objective Chaotic Atom Search Optimization for Epistasis Detection in Genome-Wide Association Studies BT – Proceedings of International Conference on Scientific and Natural Computing, Springer Singapore, pp. 11–22.
Priya, S. and Manavalan, R.K. (2020), Genetic Interactions Effects of Cardiovascular Disorder Using Computational Models: A Review, Current Biotechnology, Vol. 9 No. 3, pp. 177–191.
Skwark, M.J., Croucher, N.J., Puranen, S., et al. (2017), Interacting networks of resistance, virulence and core machinery genes identified by genome-wide epistasis analysis, PLOS Genetics, Public Library of Science, Vol. 13 No. 2, p. e1006508.
Su, T. and Dy, J. (2004), A deterministic method for initializing K-means clustering, Proceedings – International Conference on Tools with Artificial Intelligence, ICTAI, No. Ictai, pp. 784–786.
Sun, L., Liu, G., Su, L., et al. (2019), SEE: a novel multi-objective evolutionary algorithm for identifying SNP epistasis in genome-wide association studies, Biotechnology and Biotechnological Equipment, Taylor & Francis, Vol. 33 No. 1, pp. 529–547.
Tam, V., Patel, N., Turcotte, M., et al. (2019), Benefits and limitations of genome-wide association studies, Nature Reviews Genetics, Vol. 20 No. 8, pp. 467–484.
Tuo, S., Zhang, J., Yuan, X., et al. (2017), Niche harmony search algorithm for detecting complex disease associated high-order SNP combinations, Scientific Reports, Vol. 7 No. 1, pp. 1–18.
Urbanowicz, R.J., Kiralis, J., Sinnott-Armstrong, N.A., et al. (2012), GAMETES: A fast, direct algorithm for generating pure, strict, epistatic models with random architectures, BioData Mining, Vol. 5 No. 1, available at:https://doi.org/10.1186/1756-0381-5-16.

