1Department of Microbiology, School of Life Sciences, Central University of Rajasthan, NH-8, Bandarsindri, Tehsil Kishangarh, Dist-Ajmer-305817, Rajasthan, India
2Institute of Minerals & Materials Technology (IMMT), Council of Scientific & Industrial Research (CSIR), Bhubaneswar-751 013, India.
3Department of Sport Biosciences, School of Sport Sciences, Central University of Rajasthan, NH-8, Bandarsindri, Tehsil Kishangarh, Dist-Ajmer-305817, Rajasthan, India
Corresponding author Email: csgahan_mbio@curaj.ac.in
Article Publishing History
Received: 19/04/2019
Accepted After Revision: 25/06/2019
The present study aims to compare copper recovery from pulverized ground copper slag obtained from pyrometallurgical processing of copper. The method employed for copper leaching/recovery is a microbial catalyzed process with a solid% of 10% (w/v). Grinding/pulverization of the copper slag was carried out for a variable time period of 30, 60, 90 mins and the copper content in all the ground slag was 3.88% (w/w). Reason for varying grinding time was to allow liberation copper from the complex mineral matrix to enhance Cu leaching.2.5 Liters Batch Bioreactor was used with one- Liter working volume for bioleaching of copper slag using the mixed culture of chemolithotrophic acidophilic iron and sulfur-oxidizing microorganisms. The Cu recovery from bioleaching of copper slag with a variable grinding time of 30, 60 and 90 mins was 77.8, 84.7 and 86.6% respectively. The recovery % obtained was highest with 90 mins but even 60 mins grinding time also resulted in an appreciable percentage of recovery.
Copper slag, Redox potential, sulphate, acidophillic, iron oxidising microorganism, Sulphur oxidising microorganism, copper, oxidation
Nagar N, Garg H, Sharma H, Angadi S. I, Gahan C. S. Influence of Grinding Time on the Bioleaching of Copper from Copper Slag. Oryzae.Biosc.Biotech.Res.Comm. 2019;12(2).
Nagar N, Garg H, Sharma H, Angadi S. I, Gahan C. S. Influence of Grinding Time on the Bioleaching of Copper from Copper Slag. Biosc.Biotech.Res.Comm. 2019;12(2). Available from: https://bit.ly/2RCjiw1
Copyright © Nagar et al., This is an open access article distributed under the terms of the Creative Commons Attribution License (CC-BY) https://creativecommns.org/licenses/by/4.0/, which permits unrestricted use distribution and reproduction in any medium, provide the original author and source are credited.
Introduction
Metallurgical and mineral processing industries are generating a bulk amount of wastes like slimes, slag, sludge, etc., posing several environmental issues creating a greater challenge for the waste disposal. Slags generated from copper forming process via pyro-metallurgical processes is one the important challenges faced by many industrial houses involved in copper production. Copper slag has been one of the potential industrial wastes generated during the smelting and converting steps in copper matte production from copper ores. The estimated global production of copper metal has reached 19.7 million tons by 2017 and for every ton of copper metal produced, around 2.2 tons of slag is generated annually (Gorai et al., 2003; Jarošíková et al., 2017; Mikoda et al., 2019). Copper slag consists of a matrix of iron silicates, aluminum oxide and included droplets of matte, metal, and blister Copper (Cu). Almost all copper slag contains 0.6 to 3% of Cu (Carranza et al., 2009; Roy et al., 2016). Conventionally, copper slag is either dumped directly or used in the preparation of value-added products like cement, glass, tiles, abrasive, cutting tools, etc.(Gorai et al., 2003; Jarošíková et al., 2017; Murari et al., 2015).Owing to the hazardous nature of copper slag due to its heavy metals content, dumping them directly may pose major threat to the environment. However, in either of the scenario the valuable copper present in copper slag goes to the land with a loss of revenue (Agnello et al., 2018; Kaksonen et al., 2016; Potysz et al., 2018a, 2018b). It is expected that by 2025, the global demand for copper is expected to rise to 35 million tons (Market Survey Series MS-33, 2011). Therefore, the need of the time has driven the Industries and research organizations to develop alternative methods of copper recovery considering copper slag as a potential secondary source of copper(Mikoda et al., 2019; Piatak, 2018). Slags are found to be highly reactive in the acidic medium; the solubilization of several oxidic phases of copper slag has been found to increase in the acid solution (Kaksonen et al., 2017, 2016; Roy et al., 2016; Urosevic et al., 2015).
The use of ferric sulfate (11.5 g Fe3+/l) and a combination of ferric sulfate-sulfuric acid as a lixiviant have led to 90% copper recovery at 2% pulp density at 60 °C (Carranza et al., 2009; Kaksonen et al., 2016; Muravyov et al., 2012). Several studies employing bioleaching as a potential environment-friendly, energy extensive and economical alternative approach for the recovery of metal values from solid wasteshave been reported (Ding et al., 2019; Dong et al., 2013; Fu et al., 2008).The oxidative dissolution of metal (from its sulfide or oxide) into the solution takes place by the action of biooxidized ferric ion and biogenic protons (Zhang et al., 2018). The efficacy of bioleaching over chemical leaching has been mentioned in a study, where biogenic acid production by acidophilic Acidithiobacillus ferrivorans and Alicyclobacillus spp. has led to 80% Cu dissolution. It is worth mentioning here that the study was conducted on a shake flask, where elemental sulfur (S0) was fed to the bacteria for H2SO4 production (Kaksonen et al., 2016). A recent article reported good recovery of metals from slag employing bioleaching using a sulfur-oxidizing microorganism (Acidithiobacillus thioxidans) for 28 days with 1% pulp density and 10g/l elemental Sulphur (Mikoda et al., 2019).
A research study on the physical beneficiation of copper slag by flotation technique followed by bioleaching by a mixed culture of iron-oxidizing and sulfur-oxidizing microorganisms (At. ferroxidans and At. thioxidans) in shake flask could dissolve 93% of Cu into the solution at pH 1.5 within 12 days (Panda et al., 2015). It is noteworthy that in many bioleaching studies on copper slag, a grinding step prior to leaching has been followed, due to their refractory nature. The reason for grinding is that the occluded phases of Cu in the slag matrix can be easily liberated by mild grinding (Carranza et al., 2009; Panda et al., 2015). Therefore, in the present study, the copper slag was ground for three different time intervals like 30 minutes, 60 minutes and 90 minutes prior to the bioleaching steps. Three bioleaching experiments were conducted on a bench scale 2.5 L bioreactor with a working volume of 1 L. The three different copper slag samples obtained from different grinding times were used as the feed material. The effect of grinding time of copper slag on the bioleaching mechanism and bio-catalyzed copper recovery by a mixed culture of iron oxidizing and sulfur-oxidizing microorganismsin an iron and sulfur-free 0K medium was investigated. All the three bioleaching experiments were compared for their Cu recovery and bioleaching kinetics and together with their order of reaction.
Material and Methods
Copper Slag
The copper slag used as a feed material in the bioleaching experiments was obtained from M/s Hindalco Industries Limited, India.The slag sample as received was coarse-grained and was subjected to grinding into fine particle sizes at Mineral Processing Department of CSIR-Institute of Minerals and Materials Technology (IMMT), Bhubaneswar, Odisha, India. A size fraction analysis was carried out on the ground copper slag samples followed by a copper content analysis. It was observed that about 80% of the copper slag was finer than 1800 microns. The ground sample of copper slag had 80% passing size and was found to be ~1800 micron. As the coarse size copper slag samples were not suitable for bioleaching experiments, a wet grinding was carried out on a standard Ball Mill (12″ x 12″) under specified conditions for different time intervals of 30, 60 and 90 mins respectively. All ground products were analyzed for their size fractions (Table 1). It was observed that, with the increasing grinding time from 15 to 120 minutes the d80 of the product decreased from the size of 360 microns to 46 microns respectively. Among all the samples only three samples were selected for the study such as 30, 60 and 90 minutes with a particle size of 210, 83 and 68 microns respectively. These three different ground copper slags with varying grinding time were used for the bioleaching tests to evaluate the copper recovery from the copper slag.
Table 1: Size analysis of the different time ground products
| Size in microns | Grinding Time | ||
| cum Wt % Finer | |||
| 30 min | 60 min | 90 min | |
| 500 | 100.0 | – | – |
| 212 | 84.1 | – | – |
| 150 | 61.6 | 100.0 | – |
| 100 | 44.2 | 92.4 | 100.0 |
| 75 | 31.2 | 68.2 | 87.9 |
| 63 | 23.9 | 59.1 | 71.2 |
| 45 | 20.3 | 52.3 | 71.2 |
| 38 | 13.8 | 38.6 | 52.3 |
| 0 | 0.0 | 0.0 | 0.0 |
| d80, microns | 210 | 83 | 68 |
Microorganisms
The microbial culture for bioleaching was obtained from Lulea University of Technology, Lulea, Sweden. Q-PCR analysis conducted by Bioclear B.V., Netherlands, revealed that it was a mixed culture of chemolithotrophic, mesophilic acidophilic Fe & S oxidizers. The microbial culture was dominated by Acidithiobacillus ferroxidans(Fe and S), Leptospirillum ferriphilum (Fe oxidizer) followed by Acidithiobacillus caldus (S-oxidizer), and with approximately the same amount of Acidithiobacillus thiooxidans (S-oxidizer), Sulphobacillus sp. (Fe-oxidizer) and Ferroplasma (Archaeal species, Fe-oxidizer).The microbial culture was grown and sub-cultured regularly on modified 9K medium supplemented with ferrous sulfate 22 g/l (4.5g/l of Fe2+) and 2mM of potassium tetrathionate as S source. The culture was grown at optimum temperature and pH conditions i.e., temperature 30°C (Franzmann et al., 2005), pH 1.50±0.05 in a 2L bioreactor with an impeller speed of 220 rpm. The growth medium pH was maintained at 1.5 to provide a conducive environment for bacterial growth (Plumb et al., 2008; Tan et al., 1998) and prevent iron precipitation and jarosite formation (Fu et al., 2008; Kinnunen and Puhakka, 2005; Leahy and Schwarz, 2009). The bioleaching experiments were set up when the viable microbial cells reached their late log phase i.e. oxidized all the ferrous ions available in the growth medium (redox ~700 mV) and a good viable cell count was achieved.
Analytical techniques
Regular pH measurements were carried out by a bench top Rivera Eutech pH meter to ensure the optimized pH conditions for microbial growth and biooxidation. Three-point calibration of the pH meter with standard buffers of pH 1.68, 4.01 and 7.0 was done on a daily basis to ensure a slope percentage of 95- 100%. The measurement of Redox potential (Rivera Eutech ORP meter) with a platinum electrode against Ag/ AgCl reference electrode was done at regular time intervals to check ferrous- ferric redox activity. Microbial growth was analyzed by the viable cell counting using a bright field microscope (Rescholar) with the 10x eyepiece and 100x objectives on an improved Neubauer hemocytometer. The estimation of ferrous ions was done by titrating the daily eluted bioleaching solution (with 1, 10 phenanthroline indicator) against cerium sulfate (Sundkvist et al., 2008). The Fe (Total) concentration of the bioleaching solution was measured by vis- spectrophotometer at 510 nm using ammonium acetate as buffer and 1,10-phenanthroline as indicator and the solution was saturated with hydroxylamine hydrochloride whereas the Fe (III) concentration of the bioleaching solution was calculated by subtracting concentration of Fe (II) from the Fe (Total). The sulfate ion concentration was measured by a turbidimetric method involving the formation of barium sulfate colloidal precipitates on the addition of barium chloride to the diluted samples; absorbance was taken at 420 nm as described in American Public Health Association, 1975 (APHA) (Kolmert et al., 2000). Cu content in bioleaching solutions was measured on regular time intervals by Atomic absorption Spectroscopy (Thermo Scientific-iCE 3000 Series).
Bioleaching Studies
Batch bioleaching experiments with iron and sulfur-oxidizing microorganisms (20% v/v) were conducted in 2 L baffled stirred tank reactor at a working volume of 1 L under controlled pH 1.5 and temperature 30ᵒC±2. The pulp density of the feed materials viz. 30, 60 and 90 minutes grounded copper slag was 10% (w/v). On the basis of the time interval of grinding of copper slag the bioleaching experiments were named as CSGT0.5h, CSGT 1h, and CSGT 1.5h for 30, 60 and 90 minutes grinding. The mineral salt growth medium (80% v/v) used for the experiments was iron free 9K mineral salt medium (Silverman and Lundgren, 1959). The actively grown culture of Fe & S oxidizers had 2.64×10⁸microbial cells/ml and redox potential ~700mV. Homogeneous mixing of the pulp was obtained by an overhead stirrer with an impeller speed of 220 rpm. A hot plate was placed beneath the reactor for maintaining the temperature of the system at 30ᵒC. The increase in pH was maintained at 1.5 by adding 5M H2SO4. The water loss due to evaporation during the study was compensated by the regular addition of deionized water.
Results and Discussion
Characterization of Copper Slag
A representative sample of the copper slag after fine grinding was digested with aqua regia. The liquid obtained after digestion was analyzed by atomic absorption spectrophotometry for copper content analysis. The Cu concentration was measured to be 3.88%.XRD (Rigaku) was done for the mineralogical study of the bioleached residue by measuring the diffraction patterns at angles between 5º to 90º and step size 0.02 angle/sec using Cu-Kα (λ=1.540598) as an X-Ray source. The peaks of the phases of fayalite (Fe2SiO4), Iron Oxide (Fe2O3), Silicon Oxide (SiO2), Copper Iron Oxide and Copper (Cu0) were prominent in the X-Ray Diffractogram (Figure 1).
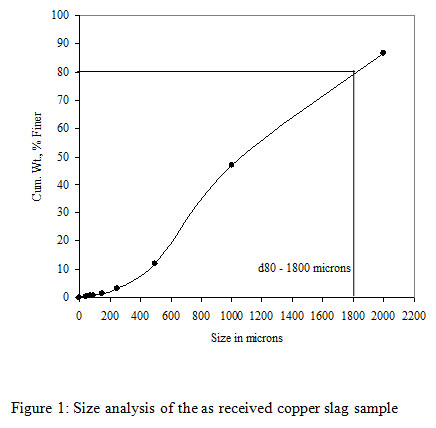 |
Figure 1: Size analysis of the as received copper slag sample |
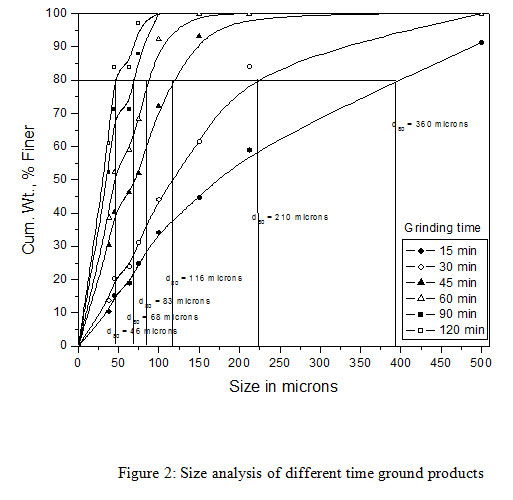 |
Figure 2: Size analysis of different time ground products |
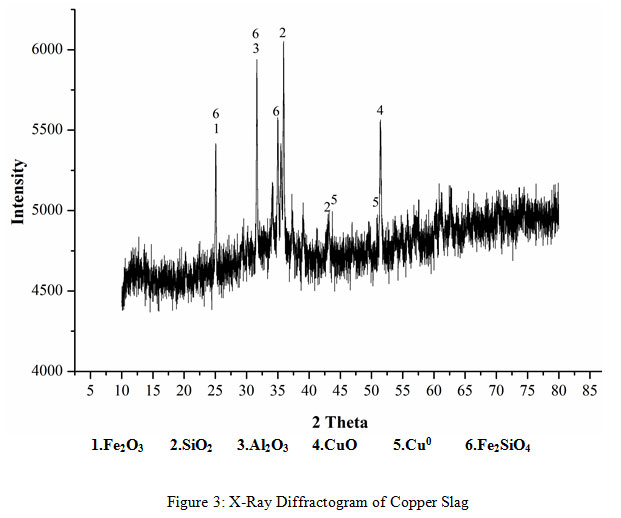 |
Figure 3: X-Ray Diffractogram of Copper Slag |
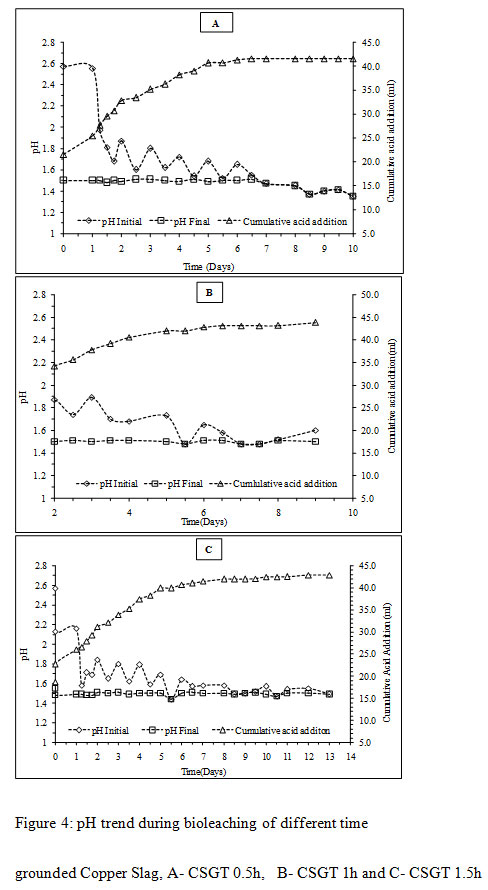 |
Figure 4: pH trend during bioleaching of different time grounded Copper Slag, A- CSGT 0.5h, B- CSGT 1h and C- CSGT 1.5h |
Effect of Copper Slag grinding time on batch bioprocess dynamics
The increase and decrease in the pH during bioleaching operations can be controlled by several factors. The sudden increase in pH just after feed addition is due to the presence of acid consuming species in the feed material. The decrease in pH is may be due to biogenic H+ ions produced by sulfur oxidation mechanism (equation 1) or reduction of ferric to ferrous ion after attacking the feed surface (equation 2) or jarosite precipitation. The increase in pH during the course of bioleaching may be due to ferrous biooxidation which is a proton consuming process (equation 3) or due to proton attack on the metal oxide surface and its subsequent dissolution (equation 4).
S0 + 1.5O2+ H2O → 2H+ + SO42- (1)
MeS + 2Fe3+ + 1.5O2 + H2O → Me2+ + 2Fe2+ + SO42− + 2H+ (2)
Fe2+ + 1/4O2 + H+ → Fe3+ + ½ H2O (3)
MeO + H2SO4 →MeSO4 + H2O (4)
The initial pH in all the experiments was high on the first day was due to the presence of acid consuming gangue minerals like silica and iron oxide (Mikoda et al., 2019; Potysz et al., 2016). The rise in pH on the initial day was highest in the CSGT 1.5h experiment as the acid consuming phases are more exposed in it due to the longest grinding and finest particle size among all. To avoid iron precipitation and cell stress/death, the sudden increment in pH was maintained back to 1.5 by the addition of 5M H2SO4. The amount of acid consumption decreased gradually after the first day with the increase in Cu dissolution signifying the role of bacteria in the leaching process. The total amount of acid consumption was in the order- CSGT 1h > CSGT 1.5h> CSGT 0.5h (Table 2).
Table 2: Acid consumption in all the bioleaching experiments
| Copper Slag | Acid Consumption, kg Conc. H2SO4/ ton spent catalyst | |
| CSGT 0.5h | 787.517 | |
| CSGT 1h | 830.806 | |
| CSGT 1.5h | 812.344 |
The viable planktonic cell count was also high in all the experiments (Figure 2). The growth of microbial cells in CSGT 1.5h remained in increasing order throughout the bioleaching process, whereas in CSGT 0.5h and CSGT 1h the cell count decreased after the 6th dayand remained similar after 3rd day respectively. The sulfate profile in all experiments was almost constant throughout which depicts no jarosite formation. The ferrous ion profile also suggests the presence of a good amount ofiron for bacterial activity. The redox potential graph explains the ferrous/ferric redox conversions effectively. The high ferrous ion concentration in the bioleaching experiments was due to the dissolution of fayalite (Equation 5- 8). The ferrous ion produced served as an electron donor or the energy source for the microorganisms and the biooxidized ferric ion may have attacked the target species (Equation 9).
Fe2SiO4→SiO44−+2Fe2+ (5)
SiO44−+4H+→H4SiO4 (6)
H4SiO4→H2SiO3+H2O (7)
H2SiO3→SiO2+H2O (8)
Cu0+2Fe3+→Cu2++2Fe2+ (9)
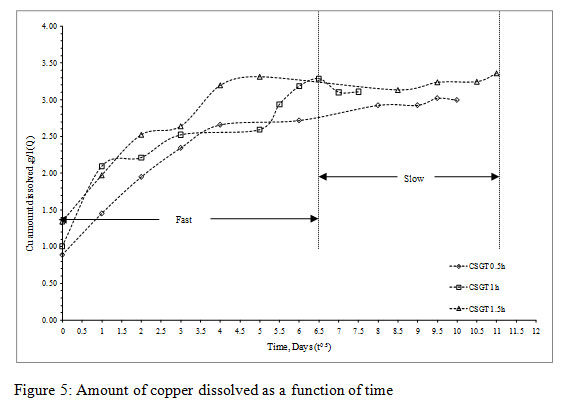 |
Figure 5: Amount of copper dissolved as a function of time |
In CSGT 0.5h, the ferrous ion concentration rose till 2nd day and then started decreasing tending to zero on the final day. As the bacterial cell count was fairly high in the experiment, good ferrous biooxidation was taking place. The ferric ion was getting accumulated in the system due to unavailability of the target metal (Cu) phases. This was confirmed by the redox profile of CSGT 0.5h in which redox started to increase from 2nd day and reached up to~700mV on the 6th day after which the Cu dissolution was also stopped due to the hindrance in lixiviant penetration through the passivation layer of Fe species. Only 77.8% of Cu can be dissolved into the solution. In CSGT 1h and CSGT 1.5h, ferric ion was always present in the bioleaching medium for the reaction and the redox was also increasing. Cu dissolution was also high in CSGT 1h and CSGT 1.5h due to more availability of the phases of Cu.
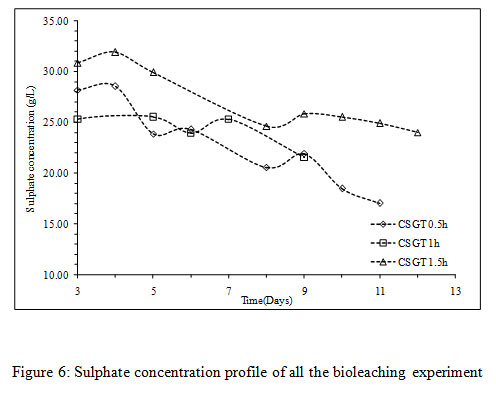 |
Figure 6: Sulphate concentration profile of all the bioleaching experiment |
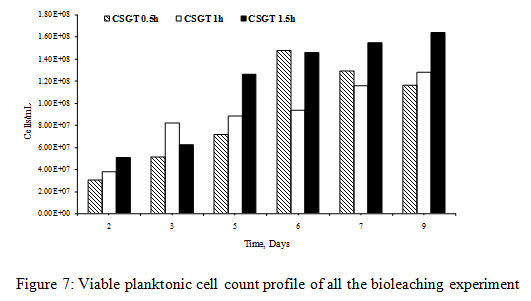 |
Figure 7: Viable planktonic cell count profile of all the bioleaching experiment |
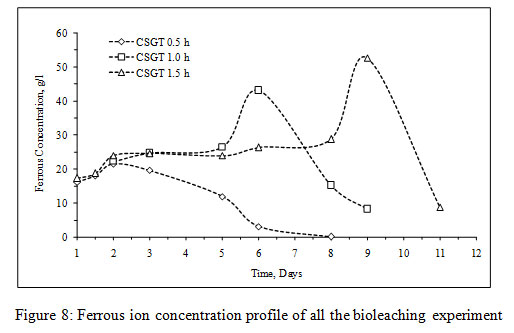 |
Figure 8: Ferrous ion concentration profile of all the bioleaching experiment |
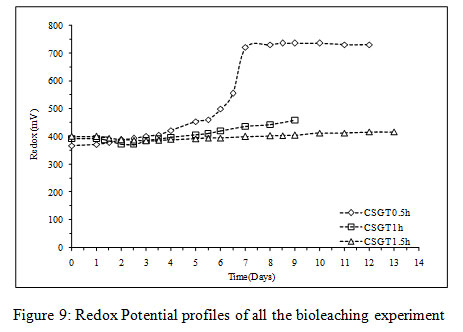 |
Figure 9: Redox Potential profiles of all the bioleaching experiment |
Copper bioleaching kinetics and reaction order studies
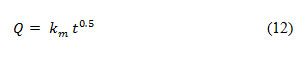
The shrinking core and shrinking particle models were applied to study the heterogeneous reaction kinetics of Cu dissolution. To evaluate the rate determining step in the leaching mechanism, the steps involved in the solid-liquid reaction are considered (Levenspiel, 1999). The Cu dissolution may have the following step –First, diffusion of the lixiviant from the bulk solution to the solid; second, penetration and diffusion through product layer; third, a chemical reaction between lixiviant and solid; fourth, Product diffusion through product layer and the final step fifth is product diffusion into bulk solution. The first step cannot be the rate-determining step as leaching was carried out under mixing condition. The leaching reaction may also not be limited by the fourth and fifth steps since product diffusion is expected to be a fast process. Therefore, the rate-limiting step can be determined by evaluating the second and third steps. In shrinking particle model, the second step i.e., resistance in leaching through product layer diffusion is omitted as there is no product layer formation. The quantity of reacting lixiviant is proportional to the unreacted surface of the solid core, but the chemical reaction at the solid surface is slower than diffusion. Thus, the third step is evaluated for the rate-determining step using equation 10-

Here, α= fraction of Cu leached into the solution, t=time, k= rate constant, ro=original radius of the solid particle, C= concentration of the leach solution, ρ= Density.
Assuming C, ρ, ro to be constant, rate constant (k) can be calculated by plotting right-hand side of equation 10 with time (t). The leach rate in chemically controlled leaching is inversely proportional to the radius of the particle. In the shrinking core model, the reaction is controlled by the formation of the product diffusion layer. The chemical reaction at the solid surface is faster than the diffusion. Thus, the second step is evaluated for the rate-determining step using equation 11-
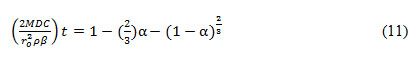
Here, α= fraction of Cu leached into the solution, t=time, ro=original radius of the solid particle, M=molecular weight, D= Diffusion constant, C= concentration of the leach solution, ρ= Density, β= stoichiometric factor.
Similarly, assuming M, C, ρ, β to be constant, Diffusion constant (D) can be determined by plotting right-hand side of equation 11 against time (t). The leach rate in diffusion controlled leaching is inversely proportional to the square of the radius.
It was observed that all three experiments were controlled by the formation of a product diffusion layer. The diffusion-controlled kinetics model gave a better fit with co-relation coefficients R2= 0.93, 0.89 and 0.72 for CSGT 0.5h, CSGT 1h and CSGT 1.5h experiments respectively. The diffusion constants for CSGT 0.5h, CSGT 1h and CSGT 1.5h were 0.0103, 0.0164 and 0.0107 respectively. To obtain further clarity on the diffusion-controlled leaching mechanism, the mass transfer rate constant and rate determining step was also evaluated by the following mass transfer rate equation-
Here, Q = amount of Cu, t0.5 = time, days and km= mass transfer rate constant.
Q was plotted as a function of time (t0.5) and the slope of the graph was km. The collective graph for all the experiments can be divided into two regimes namely fast and slow,which depicts two different diffusion controlled leaching modes on the basis of the Cu leaching rates. The initial region denotes surface diffusion controlled and final region denotes intra-particle or diffusion through product layer or combination of both.It can be concluded that the slow/final region denoting intra-particle or diffusion through product layer or combination of both is the rate determining step as the mass transfer constant (km values) for it was less in all the experiments.
As the Cu is embedded or occluded in the slag matrix, the Fe2O3 present in the feed may have made a passivation layer around the Cu phases and hindered its leaching efficiency. It has also been reported that iron present in the slag gets oxidized to ferric as Fe2O3 or ferric hydroxides. The accumulation of these precipitates on the mineral surface forms a passivation layer which negatively affects the leaching kinetics (Roy et al., 2016). High redox potential and ferric ion concentration in all bioleaching medium support the above assumption.
The more is the grinding of the slag, more is the liberation of inbound copper, lesser is the particle size, lesser is the passivation by the diffusion layer and more is the leaching rates.The Cu leaching rates were also assessed in the experiments (Figure3). The leaching rates of the experiments were in the order- CSGT 0.5h< CSGT 1h< CSGT 1.5h with the R2 values of 0.833, 0.868 and 0.954 respectively. Therefore, the experiment CSGT 1.5h had the highest mass transfer rate and Cu leaching rate (rate constant=0.390) as the Cu phases are more exposed in it due to its longest grinding time and smallest particle size.
 |
Figure 10: Chemically controlled leaching kinetics study of the bioleaching experiments, A- CSGT 0.5h, B- CSGT 1h and C- CSGT 1.5h |
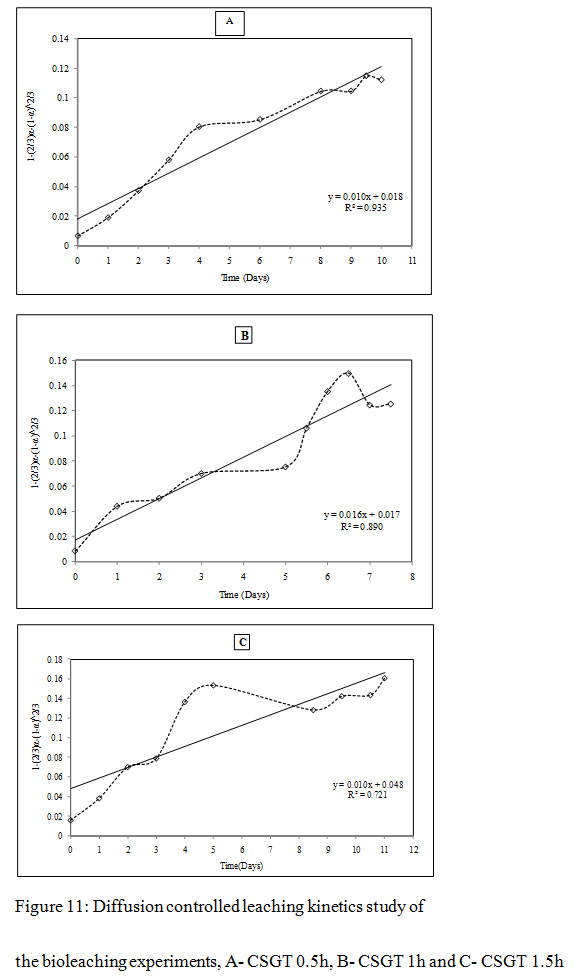 |
Figure 11: Diffusion controlled leaching kinetics study of the bioleaching experiments, A- CSGT 0.5h, B- CSGT 1h and C- CSGT 1.5h |
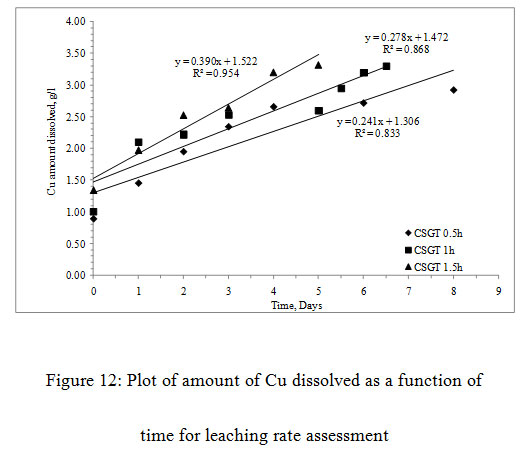 |
Figure 12: Plot of amount of Cu dissolved as a function of time for leaching rate assessment |
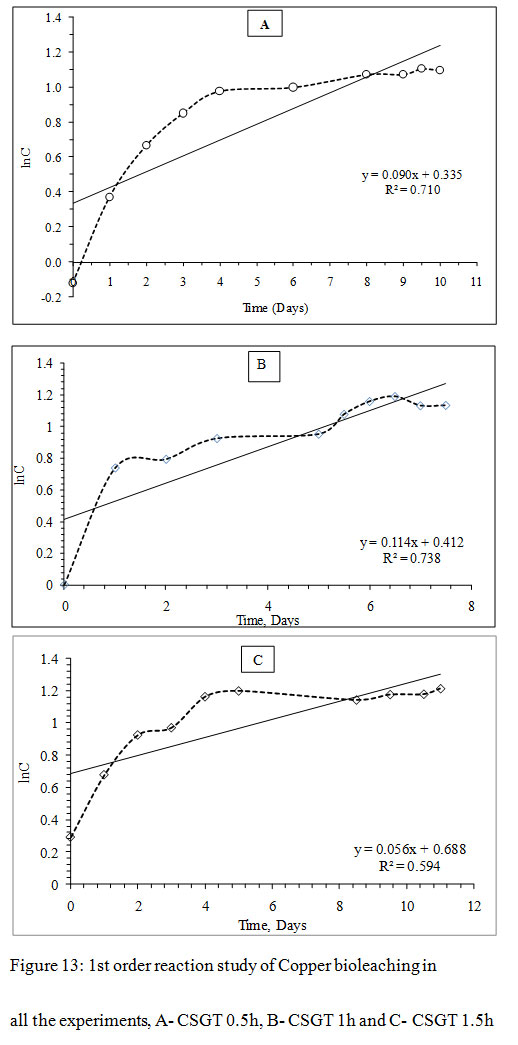 |
Figure 13: 1st order reaction study of Copper bioleaching in all the experiments, A- CSGT 0.5h, B- CSGT 1h and C- CSGT 1.5h |
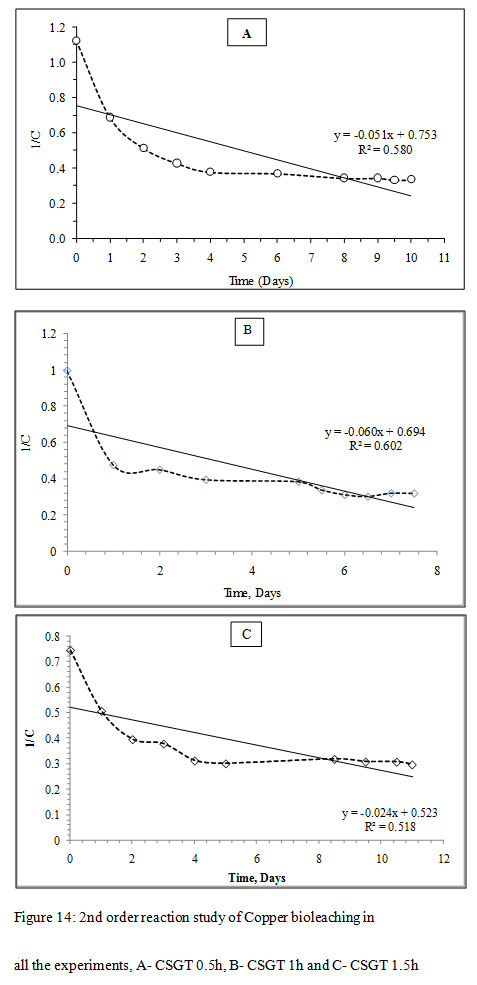 |
Figure 14: 2nd order reaction study of Copper bioleaching in all the experiments, A- CSGT 0.5h, B- CSGT 1h and C- CSGT 1.5h |
The Cu leaching reaction was evaluated for 1st order or 2nd order reaction kinetics. For 1st order model, ‘lnC’ was plotted as a function of ‘t’ and for 2nd order model, ‘1/C’ was plotted as a function of ‘t’, where C is the metal ion concentration and t is the time. The slope of each model gives the reaction rate ‘k’. The correlation coefficient for the 1st order reaction model was found to be higher in all experiments CSGT 0.5h, CSGT 1h, and CSGT 1.5h. Therefore, Cu leaching kinetics is following 1st order reaction with a reaction rate of 0.090, 0.114 and 0.056 in the order of experiments.
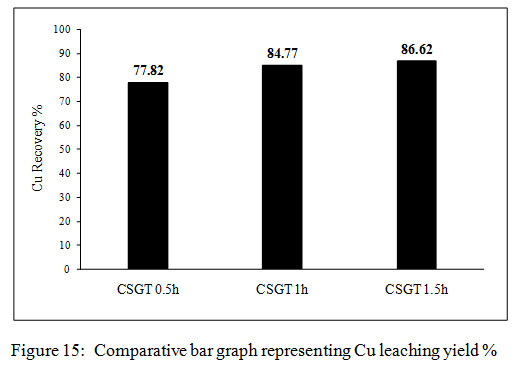 |
Figure 15: Comparative bar graph representing Cu leaching yield % |
Copper leaching yields
The copper leaching yields in all the experiments were calculated from the amount of copper measured in the feed. The Cu recovery in CSGT 0.5, CSGT 1h and CSGT 1.5h was 77.8%, 84.7% and 86.6% (Figure 4). The Cu recovery was affected by the formation of a passivation layer of the oxidized iron species and grinding of copper slag. The lesser recovery of Cu in CSGT 0.5h was due to less grinding and larger particle size of the copper slag. Grinding of 30 minutes could not liberate the inbound copper inside the iron matrix completely. This iron matrix acted as a passivation layer which did not allow the lixiviant attack and Cu dissolution. In CSGT 1h and CSGT 1.5h, the Cu recovery was higher and almost similar due to their longer grinding times. The maximum Cu dissolution in CSGT 0.5h experiment was achieved in 8 days, in CSGT 1h and CSGT 1.5h Cu was dissolved in 6-7 and 4-5 days respectively.
Conclusion
The copper slag ground for 30, 60 and 90 mins and studied for copper bioleaching resulted with a highest copper recovery at 90 mins grinding time within 4-5 days leaching time. Copper leaching with different grinding time followed first order reaction kinetics with fastest leaching rate at 90 mins grinding time. The bioleaching of Cu followed diffusion controlled for all the experiments.
Acknowledgment
Authors are thankful to the Department of Science and Technology, Govt. India for funding the research from DST-SERB for Young Scientist YSS/2014/000895. Authors would like to thank UGC, DST Inspire and Central University of Rajasthan for providing the scholarships. Authors would also like to be grateful to M/s Hindalco Industries Limited, India. The support in the XRD analysis of the samples by Department of Physics, Central University of Rajasthan is also highly acknowledged.
References
Agnello, A.C., Potysz, A., Fourdrin, C., Huguenot, D., Chauhan, P.S. (2018) Impact of pyrometallurgical slags on sunflower growth, metal accumulation and rhizosphere microbial communities, Chemosphere. Elsevier, 208, pp. 626–639. https://doi.org/https://doi.org/10.1016/j.chemosphere.2018.06.038
Carranza, F., Romero, R., Mazuelos, A., Iglesias, N., Forcat, O. (2009) Biorecovery of copper from converter slags: Slags characterization and exploratory ferric leaching tests, Hydrometallurgy. Elsevier, 97, pp. 39–45. https://doi.org/https://doi.org/10.1016/j.hydromet.2008.12.012
Ding, Y., Zhang, S., Liu, B., Zheng, H., Chang, C., Ekberg, C. (2019) Recovery of precious metals from electronic waste and spent catalysts: A review, Resource Conservation and Recycling. Elsevier, 141, pp. 284–298.
Dong, Y., Lin, H., Xu, X., Zhang, Y., Gao, Y., Zhou, S. (2013) Comparative study on the bioleaching, biosorption and passivation of copper sulfide minerals, International Biodeterioration and Biodegradation. Elsevier, 84, pp. 29–34. https://doi.org/https://doi.org/10.1016/j.ibiod.2013.05.024
Franzmann, P.D., Haddad, C.M., Hawkes, R.B., Robertson, W.J., Plumb, J.J. (2005) Effects of temperature on the rates of iron and sulfur oxidation by selected bioleaching Bacteria and Archaea: Application of the Ratkowsky equation, Minerals Engineering. Elsevier, 18, pp. 1304–1314.
Fu, B., Zhou, H., Zhang, R., Qiu, G. (2008) Bioleaching of chalcopyrite by pure and mixed cultures of Acidithiobacillus spp. and Leptospirillum ferriphilum, International Biodeterioration and Biodegradation. Elsevier, 62, pp. 109–115. https://doi.org/https://doi.org/10.1016/j.ibiod.2007.06.018
Gorai, B., Jana, R.K., Premchand (2003) Characteristics and utilisation of copper slag—a review, Resource Conservation and Recycling. Elsevier, 39, pp. 299–313. https://doi.org/https://doi.org/10.1016/S0921-3449(02)00171-4
Jarošíková, A., Ettler, V., Mihaljevič, M., Kříbek, B., Mapani, B. (2017) The pH-dependent leaching behavior of slags from various stages of a copper smelting process: environmental implications, Journal of Environment Management. Elsevier, 187, pp. 178–186.
Kaksonen, A.H., Särkijärvi, S., Puhakka, J.A., Peuraniemi, E., Junnikkala, S., Tuovinen, O.H. (2017) Solid phase changes in chemically and biologically leached copper smelter slag, Minerals Engineering. Elsevier, 106. https://doi.org/10.1016/j.mineng.2016.08.029
Kaksonen, A.H., Särkijärvi, S., Puhakka, J.A., Peuraniemi, E., Junnikkala, S., Tuovinen, O.H. (2016) Chemical and bacterial leaching of metals from a smelter slag in acid solutions, Hydrometallurgy. Elsevier,159, pp. 46–53. https://doi.org/https://doi.org/10.1016/j.hydromet.2015.10.032
Kinnunen, P.H.-M., Puhakka, J.A. (2005) High-rate iron oxidation at below pH 1 and at elevated iron and copper concentrations by a Leptospirillum ferriphilum dominated biofilm, Process Biochemistry. Elsevier, 40, pp. 3536–3541.
Kolmert, Å., Wikström, P., Hallberg, K.B. (2000) A fast and simple turbidimetric method for the determination of sulfate in sulfate-reducing bacterial cultures, Journal of Microbiological Methods. Elsevier, 41, pp. 179–184.
Leahy, M.J., Schwarz, M.P. (2009) Modelling jarosite precipitation in isothermal chalcopyrite bioleaching columns, Hydrometallurgy. Elsevier, 98, pp. 181–191.
Levenspiel, O. (1999) Chemical reaction engineering, Industrial & engineering chemistry research. 38, 4140–4143.
Market Survey Series MS-33 (2011) Market Survey on Copper.
Mikoda, B., Potysz, A., Kmiecik, E. (2019) Bacterial leaching of critical metal values from Polish copper metallurgical slags using Acidithiobacillus thiooxidans, Journal of Environmental Management. Elsevier, https://doi.org/10.1016/j.jenvman.2019.02.032
Murari, K., Siddique, R., Jain, K.K. (2015) Use of waste copper slag, a sustainable material, Journal of Material Cycles and Waste Management. Springer, 17, pp. 13–26. https://doi.org/10.1007/s10163-014-0254-x
Muravyov, M.I., Fomchenko, N. V, Usoltsev, A. V, Vasilyev, E.A., Kondrat’eva, T.F. (2012) Leaching of copper and zinc from copper converter slag flotation tailings using H2SO4 and biologically generated Fe2(SO4)3, Hydrometallurgy. Elsevier, 119–120, pp. 40–46. https://doi.org/https://doi.org/10.1016/j.hydromet.2012.03.001
Panda, S., Mishra, S., Rao, D.S., Pradhan, N., Mohapatra, U., Angadi, S., Mishra, B.K. (2015) Extraction of copper from copper slag: Mineralogical insights, physical beneficiation and bioleaching studies, Korean Journal of Chemical Engineering. Springer, 32, pp. 667–676. https://doi.org/10.1007/s11814-014-0298-6
Piatak, N.M. (2018) Chapter 19 – Environmental Characteristics and Utilization Potential of Metallurgical Slag, in: De Vivo, B., Belkin, H.E., Lima, A.B.T.-E.G. (Second E. (Eds.), Elsevier. pp. 487–519. https://doi.org/https://doi.org/10.1016/B978-0-444-63763-5.00020-3
Plumb, J.J., Muddle, R., Franzmann, P.D. (2008) Effect of pH on rates of iron and sulfur oxidation by bioleaching organisms, Minerals Engineering. Elsevier, 21, pp. 76–82.
Potysz, A., Grybos, M., Kierczak, J., Guibaud, G., Lens, P.N.L., van Hullebusch, E.D. (2016) Bacterially-mediated weathering of crystalline and amorphous Cu-slags, Applied Geochemistry. Elsevier, 64, pp. 92–106. https://doi.org/https://doi.org/10.1016/j.apgeochem.2015.07.011
Potysz, A., Kierczak, J., Grybos, M., Pędziwiatr, A., van Hullebusch, E.D. (2018a) Weathering of historical copper slags in dynamic experimental system with rhizosphere-like organic acids, Journal of Environment Management. Elsevier, 222, pp. 325–337. https://doi.org/https://doi.org/10.1016/j.jenvman.2018.05.071
Potysz, A., Kierczak, J., Pietranik, A., Kądziołka, K. (2018b) Mineralogical, geochemical, and leaching study of historical Cu-slags issued from processing of the Zechstein formation (Old Copper Basin, southwestern Poland), Applied Geochemistry. Elsevier, 98, pp. 22–35. https://doi.org/https://doi.org/10.1016/j.apgeochem.2018.08.027
Roy, S., Sarkar, S., Datta, A., Rehani, S. (2016) Importance of mineralogy and reaction kinetics for selecting leaching methods of copper from copper smelter slag, Separation Science and Technology. Taylor and Francis, 51, pp. 135–146.
Silverman, M.P., Lundgren, D.G. (1959) Studies on the chemoautotrophic iron bacterium Ferrobacillus ferrooxidans: I. An improved medium and a harvesting procedure for securing high cell yields, Journal of Bacteriology. American Society for Microbiology, 77, pp. 642.
Sundkvist, J., Gahan, C.S., Sandström, Å. (2008) Modeling of ferrous iron oxidation by a Leptospirillum ferrooxidans‐dominated chemostat culture, Biotechnology and Bioengineering. Wiley online, 99, pp. 378–389.
Tan, Y., Wang, Z.-X., Marshall, K.C. (1998) Modeling pH effects on microbial growth: a statistical thermodynamic approach, Biotechnology and Bioengineering. Wiley online, 59, pp. 724–731.
Urosevic, D., Dimitrijević, M., D. Jankovic, Z., V. Antic, D. (2015) Recovery of copper from copper slag and copper slag flotation tailings by oxidative leaching, Physicochemical Problems of Mineral Processing. https://doi.org/10.5277/ppmp150107
Zhang, S., Yan, L., Xing, W., Chen, P., Zhang, Y., Wang, W. (2018) Acidithiobacillus ferrooxidans and its potential application, Extremophiles. Springer, 22, pp. 563–579. https://doi.org/10.1007/s00792-018-1024-9

