1Department of Biological Science and Engineering, MANIT Bhopal (M.P.) India
2Department of Applied Mechanics, MANIT Bhopal (M.P.) India
Corresponding author Email: kmpbiomanit@gmail.com
Article Publishing History
Received: 25/10/2017
Accepted After Revision: 19/12/2017
Flaviviridae family is a group of viruses that cause several deadly diseases like Dengue Fever Virus, Zika Virus, Japanese Encephalitis Virus, and Hepatitis C Virus etc. The codon usage analysis can serve as a tool to understand about the molecular evolution and regulation of viral gene expression. The objective of this study is to find the key determinants of codon usage in the family. In this study, the codon usage pattern for 114 genomes of Flaviviridae family (with four genus Flavivirus, Hepacivirus, Pegivirus, Pestivirus) was analysed through codon usage indices (like NC, RSCU, ENC, PCA) and multivariate statistical methods. Our results show that among the four genus Flavivirus and Pestivirus show similarity in preferred base on the count of being AG rich. On the other hand, Pegivirus and Hepacivirus show similarity in preferred base on the count of being GC rich. The overall codon usage bias in the entire family is slightly biased. RSCU analysis showed that Flavivirus and Pestivirus prefer AG ending codons, whereas Pegivirus and Hepacivirus show preference to GC ending codons. Many unclassified members show similarity with members of genus Flavivirus in choices of codon. The ENC -GC3 plot show that mutation pressure is dominating evolutionary driving force in making codon usage preferences. The study represents comprehensive analysis of codon usage pattern and help to better understand the mechanism of codon usage bias.
Effective Number Of Codon, Mutation Pressure, Nucleotide Contents, Principal Component Analysis, Relative Synonymous Codon Usage
Mune A, Pandey A, Pandey K. M. Genome-wide Comparative Analysis of the Codon Usage Pattern in Flaviviridae Family. Biosc.Biotech.Res.Comm. 2017;10(4).
Mune A, Pandey A, Pandey K. M. Genome-wide Comparative Analysis of the Codon Usage Pattern in Flaviviridae Family. Biosc.Biotech.Res.Comm. 2017;10(4). Available from: https://bit.ly/2KbvQcK
Introduction
Flaviviridae family is composed of fast evolving RNA viruses. The members of the family are positive single stranded RNA viruses that are causative agents for number of neglected tropical diseases in humans and animals. Flaviviridae family is mainly classified into four genera: Flavivirus, Hepacivirus, Pegivirus and Pestivirus (Lobo et al., 2009; Lu et al., 2017). The viral genomes vary from 9 to 13 Kb and contain a single known ORF that codes for a polyprotein, which is processed co- and post-translationally by host and viral proteases into at least 10 functional, individual polypeptides (Blitvich and Firth, 2015; Brand et al., 2017).
Flavivirus genus comprises arthropod born viruses (arboviruses) which are transmitted to host by vectors (mosquitoes or ticks) via blood feeding. Birds and mammals are usual primary hosts. Members of this genus are further classified into groups on the basis of vector. They are mosquito born, tick born, and non-known arthropod vector (NKV) (Velazquez-Salinas et al., 2016). Flavivirus includes viruses which cause several diseases including: Dengue fever, Japanese encephalitis, Murray valley encephalitis, West Nile fever, Zika fever. These viruses are distributed worldwide but individual species are restricted to particular epidemic areas (Moosavi et al., 2011; Huang et al., 2014; Zhang et al.,2017).
Hepacivirus are the group of viruses mainly transmitted by blood contact in mammals (horses, rodents, bats, cows and primates); its best species being Hepatitis C virus. Genus Pestivirus infect mammal’s members of family Bovidae (cattle, sheep, and goats) and suidae family (various species of swine). Compared to the other viruses in the family Pestivirus encode two unique gene products, namely Nproand Erns. These unique proteins are involved in repression of the host type I IFN response. The genus Pegivirus commonly causes persistent infection in a broad range of mammals (humans, non-human primates, pigs, horses and a range of rodent and bat species).Less information is available on transmission of these viruses in different host species (Theze et al., 2015; Zhou et al., 2012; Tautz et al., 2015).
Many new viruses have been documented but their relationship with other virus, mode of transmission and vector association is not clear, hence they are not assigned under any genus and we consider them unclassified. The genetic code comprises 64 codons that can be divided into 20 groups. Each group corresponds to each of the standard amino acids and consists of one to six codons (Butt et al., 2013; Chen, 2013; Gu et al., 2003). Alternative codons within the same group coding for the same amino acid are often termed ‘synonymous’ codons. Most amino acids can be translated by more than one codon. This redundancy is an important factor that provides accuracy in production of protein. These synonymous codons are not used randomly. There are some codons that are used more often than other codons. This phenomenon is referred to as codon usage bias (Tao et al., 2009; Moratorio et al., 2013; Wang et al., 2016; Van et al., 2016).
| Table 1: List of Over-represented and Under-represented codons of four genus and unclassified members of Flaviviridae family. | ||
| Genus | Over-represented codons | Under- represented codons |
| Flavivirus
(mosquito born) |
UUG and CUG (Leu), GUG (Val), GGA (Gly), UCA (Ser), CCA(Pro), ACA(Thr), AGA and AGG (Arg), | UUA (Leu), GUA (Val), CCG (Pro), GCG (Ala), GGU (Gly) |
| Flavivirus
(tick born) |
CUG (Leu), AUC ( Ile), GUG (Val), CCA (Pro), AGA and AGG (Arg), GGA (Gly), AGU and AGC (Ser) | UUA and CUA (Leu), GUA (Val), UCG (Ser), CCG (Pro), GCG (Ala), CGU and CGA (Arg) |
| Flavivirus
(NKV) |
UUG (Leu), UCA (Ser), CCA (Pro), AGA & AGG (Arg), GGA (Gly), ACA (Thr), GUG (Val) | GUA (Val), CGC & CGU (Arg) |
| Pestivirus | CUA and CUG (Leu), AUA (Ile), GUG and GUA (Val), UCA, AGC and AGU (Ser), CCA for Pro, GCA for Ala, AGA and AGG for Arg , GGG for Gly, ACA (Thr) | UCG (Ser), GCG (Ala), CGU, CGC, CGA and CGG (Arg), UCG (Ser) and CCG (Pro).
|
| Pegivirus | UUG and CUG (Leu), AUC (Ile), GUG (Val), UCU and UCC (Ser), ACU and ACC (Thr), CGC and CGG (Arg) | GUA (Val), UUA and CUA (Leu), AUA (Ile), and AGA (Arg) and GGA (Gly). |
| Hepacivirus | AUC (Ile), CUC (Leu), GGC (Gly), AGG (Arg), UCC (Ser) | UUA and CUA (Leu), GUA (Val), CGA (Arg) |
| Unclassified | UUG (Leu), GUG (Val), CCA (Pro)
GGA (Gly) |
GUA (Val), UUA (Leu) |
Studies on codon usage have determined several factors that could influence codon usage pattern, including mutational pressure, natural or translational selection, secondary protein structure, replication and selective transcription, hydrophobicity of the protein, and the external environment. Among these, the major factors responsible for codon usage variation among different organism are considered to be compositional constraints under mutation pressure and natural selection. Numbers of previous studies on codon usage of different viruses have highlighted mutation pressure as the major factor in shaping codon usage patterns compared with natural selection. But with increasing understanding of codon usage it appears that although mutational pressure is still a dominating force, it is certainly not the only one when different viruses are considered (Sharp et al., 1988; Cristina et al., 2015; Xiang et al.,2015, Butt et al., 2016 ).
Analysis of codon usage patterns of Flaviviridae would not only provide a base for better understanding of biased usage of synonymous codons, the evolution and pathogenesis of Flaviviridae, but also improve our understanding of the regulation of viral genes expression and aid vaccine design, where the efficient expression of viral protein may be required to generate immunity. In order to gain insight into these matters, we have analysed codon usage and base composition of the 114 species of Flaviviridae family. The patterns of preferred codons for each individual amino acid in each species were identified.
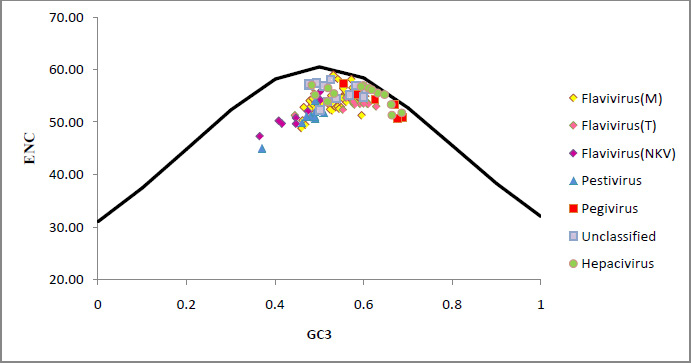 |
Figure 1: The ENC vs GC3 plots of four genus and unclassified members (Pestivirus, Pegivirus, Hepacivirus, and Flavivirus) of Flaviviridae family. |
Materials and Methods
Total 114 complete genome sequences of viruses of Flaviviridae family were downloaded from the National Centre for Biotechnology (NCBI) database (http://www.ncbi.nlm.nih.gov) in FASTA format. The accession numbers and other detailed information of the selected genomes were listed in [supplementary material Table 1]. Open reading frames (ORF) of all the genomic sequences were identified by using NCBI ORF finder (https://www.ncbi.nlm.nih.gov/orffinder/).
In order to understand the frequencies of occurrence of each nucleotide in ORFs, composition analysis was conducted. The overall frequency of occurrence of the nucleotides (A %, C %, U %, and G %) was calculated along with the frequency of each nucleotide at the third site of the synonymous codons (A3, C3, U3 and G3). Also the overall GC, AU and GC3 content were calculated to investigate the compositional properties. The codons AUG and UGG are the only codons for Met and Trp, respectively, and the termination codon UAA, UAG, and UGA do not encode any amino acids. Therefore, these five codons are excluded from the analysis.
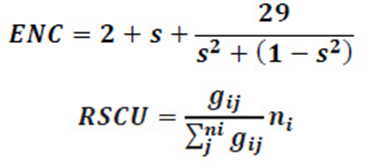
The ENC is a very effective estimator to measure the magnitude of codon usage bias in the coding sequences of members of Flaviviridae family. The ENC value ranges from 20 (when only one synonymous codon is chosen by the corresponding amino acid) to 61 (when all synonymous codons are used equally) (Lu et al., 2005). In an extremely biased gene where only one codon is used for each amino acid, this value would be 20; if all codons are used equally, it would be 61; and if the value of ENC is greater than 40, the codon usage bias is regarded as low (Wright F, 1990). We calculated ENC to measure the degree of departure from equal use of synonymous codons of ORF of members of Flaviviridae family. The values of ENC were obtained by EMBOSS CHIPS program. These ENC values were further analysed as suggested by Wright’s ENC – plot (Zhang et al., 2011). The ENC values are plotted against GC3 as a method to understand the pattern of codon usage. The viruses, whose codon choice is constrained only by a mutation bias, will lie on or just below the curve of the predicted values. The predicted values of ENC were calculated as
Where s represents the given (G+C)3 % value.
Relative synonymous codon usage (RSCU) Analysis: The RSCU values of codons in each ORF for all the member of Flaviviridae family were calculated by the given formula to determine the characteristics of synonymous codon usage. The synonymous codons with RSCU values > 1.0 have positive codon usage bias and were defined as preferred codons, while those with RSCU values < 1.0 have negative codon usage bias and were defined as less- preferred codons. When the RSCU value is 1.0, it means there is no codon usage bias for that amino acid and the codons are chosen equally or randomly. Moreover, the synonymous codons with RSCU values >1.6 and < 0.6 were treated as over-represented and under-represented codons, respectively (Wong et al., 2010; Ma et al., 2013).
Where gij is the observed number of the ith codon for the jth amino acid, which has ni types of synonymous codons.
The correlation analysis was performed between each general nucleotide composition (U%, A%, C%, and G %) and each nucleotide composition in the third site of codon (U3%, A3%, C3%, and G3%) and the value A%, T%, C%, G% and A3%, T3%, C3%, G3% were compared with GC%,, GC3% and ENC Using statistical software SPSS 19 for windows. It is used to identify the relationship between nucleotide composition and synonymous codon usage pattern of viruses Flaviviridae family.
Principal component analysis (PCA): In this study PCA was performed to analyse the major trend in codon usage pattern among members of flaviviridae family. Principal component analysis is one of the most frequently used multivariate statistical techniques (Su MW et al., 2009; Yadav and Swati D, 2012; Kanaya et al., 2001; Wang et al., 2011). PCA is an orthogonal linear transformation that is used to transform the original data set into a new coordinate system. It involves a mathematical transformation procedure that transforms some correlated variable (RSCU) into a smaller number of uncorrelated variables called principal components. The greatest variance represented by the data lies on the first coordinate, thus known as the first principal component (PC), the second greatest variance is on the second PC, and so on. One can use top 2 or 3 PCs to represent the data instead of the large number of original variables (in this case, 59 Variables). In this study PCA was done by constructing a 114 × 59 RSCU data matrix. In the matrix each row denotes the codon usage pattern of a specific virus, demonstrated by its RSCU value. Each member of Flaviviridae family was represented as a 59 dimensional vector and each dimension corresponds to the RSCU value of one sense codon, which only included several synonymous codons for a particular amino acid, excluding Met (AUG), Trp (UGG) and three stop codon.
Results and Discussion
Compositional Properties of Orfs of 114 Flaviviridae Genomes
The nucleotide contents (A, U, C, G and AU, GC %) and each nucleotide contents in the third site of codon (A3, U3, C3, G3 and GC3%) in the orf of members of Flaviviridae family do not show similarity and are found to be quite different from each other. [Table 1 supplementary material].The genome of genus Flavivirus is enriched for purines (A and G) compared to Pyrimidines (U and C) with high frequency of base G ranging from 21.52-34.01.The purine richness is maintained throughout the genus without getting affected by the vector choice of that virus. But the content of G is higher in tick born viruses as compared to others. The effect of purine richness can be observed on the selection of codons as the most preferentially used codons are A – ended or G – ended codons with higher preference to A – ended codons except AUC for Ile in Flavivirus. Members of genus Pestivirus are also enriched for purine bases, with high A content ranging from 31.54-36.94 unlike Flavivirus .Most preferentially used codons are A – ended or G – ended codons with higher preference to A – ended codons except AGU for Ser in Pestivirus. The genus Pegivirus and Hepacivirus are rich in GC content with High content of G base in Pegivirus ranging from 27.67-32.41 and content of base C is almost similar in both the genus. The GC and GC3 compositions also highlight the richness of these nucleotides in Pegivirusand Hepacivirus.
As a result of this they prefer using G – ended or C – ended codons with higher preference to C – ended codons. The unclassified group of virus show similarity with genus Flavivirus, enriched for purines, hence most preferentially used codons are A- ended or G with higher preference to A – ended codons. Two out of the four genus, Flavivirus and Pestivirus, are AG rich and show similarity in preferred base. On the other hand, Pegivirus and Hepacivirus are GC rich and show similarity in preferred base. We observed that the four possible nucleotides are not used at equal frequencies. Flavivirus and Pestivirus genus show low C content whereas Pegivirus and Hepacivirus genus show low A content. The base U is observed to be stable in the entire Flaviviridae family.
Effective Number of Codon Usage (Enc)
Different species have different tendencies to prefer specific codons, symbolized by Effective number of codons values. To investigate the overall codon usage pattern of Flaviviridae family, the ENC values for each orf is calculated and compared among the four genus [Supplementary material Table 1]. The values were analysed and compared within a genus and between different genus. Overall, the observed ENC values range between 44.99 (Norway rat Pestivirus) to 58.97 (Aedes Flavivirus) with the average being 53.74 across the Flaviviridae family. We also observed the values across 4 Genus. The codon bias of Flavivirus genus was on average 53.54 and ranged from 58.97 (Aedes Flavivirus) to 47.30 (Tamana bat virus) with standard deviation of 2.14. The overall codon bias of Hepacivirus genus was on average 55.07 and ranged from 57.02 (Hepatitis GB virus B) to 51.27 (Norway rat Hepacivirus) with standard deviation of 1.85. The overall codon bias of Pegivirus genus had an average value of 54.17 and ranged from 57.37 (Human Pegivirus 2) to 50.59 (Rodent Pegivirus) with standard deviation of 2.48.The overall codon bias of Pestivirus had an average value of 50.71 and ranged from 54.08 (Atypical porcine Pestivirus 1) to 44.99 (Norway rat Pestivirus) with standard deviation of 2.19. Finally, the codon bias of unclassified members was represented by an average value of 55.89 and ranged from 58.15 (Anopheles flavivirus variant 1) to 52.30 (Bamaga virus) with standard deviation of 1.75.
Among the entire genus Flavivirus showed highest variation in ENC value and members of unclassified group have shown the least variation. The codon variation of Flavivirus genus is higher than the variation of other three genus, implying that the evolution speed of these viruses is higher than the speed of the remaining viruses of the family. Conceptual value is comprised between 21 (if only single codon is used for each amino acid) and 61 (if all codons are used with equal frequency). In general, the overall codon bias of the four genus and unclassified members of Flaviviridae viruses is considerably weak. This is in agreement with previous reports about some other RNA viruses, for example BVDV (ENC=51.42), H5N1 (ENC=50.91) and SARS-covs (ENC=48.99), NDV (ENC=56.15) (Wang et al., 2011; Zhou et al., 2005; Gu et al., 2003; Wang et al., 2011). The possible explanation of weak codon bias in RNA virus is that a weak bias is helpful for efficient replication of virus in host cells. (Zhong et al., 2007).
Mutation Pressure Affects The Codon Usage Pattern
Mutational pressure and natural selection are considered the two major factors that shape codon usage patterns (Jenkins and Holmes, 2003). A general mutational pressure, which affects the whole genome, would certainly account for the majority of the codon usage among certain RNA viruses (Tatarinova et al., 2010). To identify whether the evolution and variation pattern of codon usage had been driven alone by mutation pressure or also contributed by natural selection, we compared the correlation between overall nucleotide composition (A, U, C, G) and nucleotide composition at the third position of codon (A3, U3, C3, G3) and correlation between overall nucleotide composition (A, U, C, G, A3, U3, C3, G3) and GC, GC3 and ENC for individual genus using Pearson s correlation [supplementary material ( Tables 2-3).
In genus Flavivirus GC and GC3 show significant positive correlation with G(r=0.87, P<0.01) (r=0.80, P<0.01), C (r=0.75, P<0.01) (r=0.80, P<0.01) and G3 (r=0.86, P<0.01) (r=0.85, P<0.01), C3 (r=0.75, P<0.01) (r=0.82, P<0.01).and negative correlation with A (r=-0.84, P<0.01) (r= -0.85, P<0.01), U (r= -0.70, P<0.01) (r= -0.65, P<0.01), and A3(r= -0.76, P<0.01), (r= -0.81, P<0.01), U3(r= -0.69, P<0.01) (r= -0.68, P<0.01). ENC shows positive significant correlation with C (r= 0.73, P<0.01) and C3 (r= 0.70, P<0.01), and negative correlation with A (r= -0.69, P<0.01) and A3 (r= -0.65, P<0.01), and non-significant correlation with U, G, and U3. A shows positive correlation with A3, negative correlation with C3 and G3, and non-significant correlation with U3. U shows significantly negative correlation with C3 and G3 , positive correlation with U3 , and non-significant correlation with A3. G and C show significantly negative correlation with A3 and U3 and significantly positive correlation with C3 and G3. When we study correlation vector wise, tick born and NKV viruses show significant correlation in comparison with mosquito borne viruses of the genus. In genus Pestivirus an interesting and complex correlation was observed.
To sum up, the GC, GC3 and ENC have highly positive significant correlation with C (r=0.84, P<0.01) (r=0.86, P<0.01) (ENC=0.87), C3 (r=0.90, P<0.01) (r=0.94, P<0.01) (ENC=0.89) and G (r=0.94, P<0.01) (r=0.91, P<0.01) (ENC=0.74),G3 (r=0.98, P<0.01) (r=0.97, P<0.01) (ENC=0.82). And significantly negative correlation with A (r= -0.99, P<0.01) (r= -0.99, P<0.01) (ENC= -0.92), A3 (r= -0.97, P<0.01) (r= -0.99, P<0.01) (ENC= -0.90) and U (r= -0.89, P<0.01) (r= -0.84, P<0.01), U3(r= -0.82, P<0.01) (r= -0.80, P<0.01) (ENC= -0.66, P<0.05). A3 and U3 show significantly positive correlation with A and U, and significantly negative correlation with C and G, whereas C3 and G3 show significantly negative correlation with A and U and significantly positive correlation with C and G. In genus Hepacivirus A3 shows positive correlation with A and has non-correlation with U, C, G and GC and GC3. Similarly, A shows non-correlation with U3, C3, G3 and GC, GC3 and ENC. GC and GC3 show significantly negative correlation with U (r= -0.94, P<0.01) (r= -0.97, P<0.01) U3 (r= -0.92, P<0.01) (r= -0.96, P<0.01) and highly positive correlation with G (r=0.95, P<0.01) (r=0.94, P<0.01), G3 (r=0.96, P<0.01) (r=0.97, P<0.01) and C (r=0.98, P<0.01) (r=0.95, P<0.01), C3 (r=0.96, P<0.01) (r=0.99, P<0.01). ENC of Hepacivirus show non-correlation with A, U, C, G, U3, G3.
In genus Pegivirus the GC and GC3 show significantly positive correlation with G (r=0.83, P<0.01) (r=0.83, P<0.01), C (r=0.84, P<0.01) (r=0.71, P<0.05), C3 (r=0.82, P<0.01) (r=0.84, P<0.01) and significantly negative correlation with U (r= -0.77, P<0.05) (r= -0.91, P<0.01) and A3 (r= -0.89, P<0.01) (r= -0.73, P<0.05). ENC have highly significant correlation with A, U, C, G, A3, C3 and non-correlation with U3 and G3.A shows significant correlation with A3 but does not show significant correlation with U3, C3 , G3. U shows significant correlation with U3, C3 and G3, and non-significant correlation with A3.C show significant correlation with A3 and C3 and non-significant correlation with U3 and G3. G shows significant correlation with G3 and non-significant correlation with A3, U3, and C3.The members of unclassified group do not show significant correlation with other nucleotides, they show significant positive correlation with the same type of nucleotide like A show positive correlation with A3. The GC and GC3 show positive correlation with C (r=0.73, P<0.01) (r=0.62, P<0.05) and G (r=0.81, P<0.01) (r=0.67, P<0.01) and negative correlation with A (r=-0.75, P<0.01) (r=-0.69, P<0.01) and U (r=-0.78, P<0.01) (r=-0.59, P<0.05). ENC does not show significant correlation with any nucleotide. This analysis collectively indicates that mutational pressure is most likely responsible for the patterns of nucleotide composition and, therefore, codon usage patterns in all four genus of Flaviviridae family.
Variation of Relative Synonymous Codon Usages in Flaviviridae Family
In order to investigate the extent of codon usage bias in flaviviridae family, all RSCU values of different codons in genus Flavivirus (69), Hepacivirus (14), Pegivirus (8), Pestivirus (11) and unclassified members (12) were calculated. The heat map [supplementary material Fig. 1] show the RSCU results of all codons in the 114 viruses of Flaviviridae family. Green represent lower RSCU value, black represent moderate RSCU, and red represents greater RSCU values. The common over – represented and common under – represented codons are listed for each genus of Flaviviridae family [Table 1]. As we know genus Flavivirus is classified into three groups on the basis of vector. The over – represented and under – represented codons are identified vector wise for this genus.
Viruses in this genus show similarity in choice of codon with their subtype or genotype like the four serotype of Dengue show similar choice of codons. Preferred codons in four serotype are UUG and CUG for Leu, AUA for Ile, GUG for Val, UCA for Ser, CCA for Pro, ACA for Thr, GCC and GCA for Ala, AGA and AGG for Arg, GGA for Gly. Less preferred codons are GUA for val, UCG for Ser, CCG for Pro, ACG for Thr, GCG for Ala, CGU and CGC, CGA and CGG for Arg, GGU and GGC for Gly. Similarly, westnile 1 and westnile 2 virus show similar choice of codon usage UUG, CUC and CUG for Leu, AUC for Ile, GUG for Val, UCA for Ser, CCA for Pro, ACC and ACA for Thr, GCU and GCC for Ala, AGU and AGC for Ser, AGA and AGG for Arg, GGA for Gly. The less preferred codons are UUA for Leu, GUA for Val,UCG for Ser, CCG for Pro,GCG for Ala, CGU and CGA for Arg, GGU for Gly. In genus Hepacivirus Equine and Bovine show similar choices for preference of codon in comparison to the other members of the group. The unclassified members of Flaviviridae family show similarity with genus Flavivirus like, Lammi virus shows similarity with mosquito born Flaviviruses especially with West Nile virus in choice of preferred and less preferred codon. Nhumirim virus shows similarity with nkv group of Flaviviruses especially with Paraiso virus show similarity in preferred codons CCC, CCA & CCG for Pro, GCG for Ala, CGA & CGG for Arg, AGU for Ser and GGA & GGG for Gly. IIomantsi virus and Donggang virus show similarity in preferred codon CCC & CCG for Pro, GCG for Ala, CGA & CGG for Arg, AGU for Ser and GGA & GGG for Gly. IIomantsi ,Lammiand Nienokoue viruses show higher degree of similarity in choice of preferred codon with mosquito born Flavivirus. GUG for Gly is the only common codon in the entire Flaviviridae.
In general, the amount of the over – represented codon is more than the amount of under – represented codon in the four genus of family and this feature is consistent with all the 114 ORF`s, suggesting that the evolution process of viral genome of all four genus is similar to some degree and the codon usage bias is weak which is supporting the results we observed from ENC values. The nucleotide composition also plays an important role in choosing preferred codons, therefore Flavivirus and Pestivirus shows preference to A and G ending codons, as they are rich in purines. And Hepacivirus and Pegivirus show preference to G and C ending codons as they are rich in GC content.
In addition, the RSCU values of the eight codon containing CpG (CCG, GCG, UCG, ACG, CGC, CGG, CGU, and CGA) in four genus were analysed. All of these eight codons were not preferential codons and were found suppressed in genus Flavivirus and Pestivirus. In genus Pegivirus and Hepacivirus six codons are under – represented except CGC and CGG. The explanation for CpG scarcity in these viruses is attributed to their property to escape the host immune response. A high CpG content leads to increased unmethylated CpGs which has immunostimultory property and therefore are easily recognized by the host’s innate immune system as a pathogen signature. This is injurious to the small DNA (or RNA) viruses. Thus high mutational rates are observed in CpGs since its deficit will enable virus to infect the host. (Dorn and Kippenberger, 2008; Krieg, 2003)
Correlation Analysis Between Enc And Gc3 Value
A plot of ENC versus GC3 is widely used to study codon usage variation among different organisms. It is the most important part of investigation of codon usage pattern. The ENC values of each member of Flaviviridae family were plotted against its corresponding GC3 values and all values lie below the expected curve as shown in [Fig. 1]. Therefore it can be hypothesized that the codon usage bias, in all these 114 viruses is principally influenced by the mutational pressure.
Identification of Similarities and Differences in Codon Usage Preferences By Pca
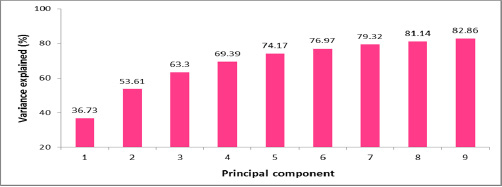
The identification of similarities and differences in codon usage preferences is an involved process that can be handled by using the Principal Component Analysis (PCA) approach. The PCA is a classical data analysis method that identifies patterns and focuses on similarities and differences in a multivariate data set. The exploration of codon usage pattern differences among these RNA viruses involves processing of the 114 × 59 RSCU matrix by PCA. This enables calculating the principal components (PCs) which in turn are employed to highlight the similarities and differences in codon usages. [Fig.2] shows the trend of the first 9 PCs. PCs with Eigen value greater than or equal to 1 are usually considered as being of statistical significance (the Kaiser criterion) as indicated in [Supplementary material Table 4] .The first PC is associated with 36.73% of the variance among the 59 RSCU indices. The first two PCs taken together account for 53.61% of the variance whereas the first three PCs combined together account for 63.30% of the variance in codon usage.
The variances of a total of 114 PCs generated from PCA are listed in [Supplementary Material Table 4].
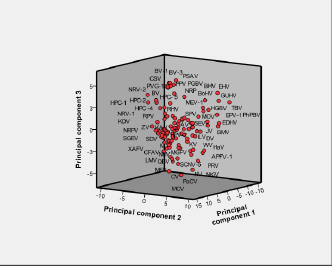
Fig. 3 is the three-dimensional PCA plot using the first three PCs of these 114 viruses as axes [the corresponding PCA coordinates are listed in Supplementary Material Table 5]. The PCA score diagram shows that the all viruses can be broadly classified into four categories. This classification is essentially based on different hosts, vectors and ecological niche. Genus Flavivirus display negative values on the second and third PC axes. Members of genus Pegivirus displayed positive values on the three PC axes. The genus Hepacivirus displays more positive values on first and third PC axes. The genus Pestivirus displays negative values on first and second PC axes whereas all positive values appear on the third axis. The unclassified members manifest a heterogeneous distribution of values and, consequently, do not represent a fifth category but get merged into the four categories.
Conclusion
Our analysis reveals that the overall codon usage bias in Flaviviridae family is slightly biased and mutation pressure is the main factor that affects codon usage variation in viruses. Other factors like Compositional constraint and natural selection also significantly influence codon usage variation. Results show RNA viruses with same vector choice share similar codon usage preferences. However, more detailed analysis is needed to understand the relationship of codon choices between viruses and hosts.
References
- Blitvich BJ, Firth AE. (2015) Insect-specific flaviviruses: a systematic review of their discovery, host range, mode of transmission, superinfection exclusion potential and genomic organization. Viruses, Vol.7, 1927-1959.
- Brand C, Bisaillon M, Geiss, BJ. (2017) Organization of the Flavivirus RNA replicase complex. Wiley Interdiscip Rev RNA, Vol.8.
- Butt AM, Nasrullah I, Tong Y. (2013) Genome-Wide Analysis of Codon Usage and Influencing Factors in Chikungunya Viruses. PLoS One 9(3): e90905, Vol.9.
- Butt AM, Nasrullah I, Qamar R, Tong Y. (2016) Evolution of codon usage in Zika virus genomes is host and vector specific. Emerging Microbes & Infections, Vol.5, 10.
- Chen Y. (2013) A Comparison of Synonymous Codon Usage Bias Patterns in DNA and RNA virus Genomes: Quantifying the Relative Importance of Mutational Pressure and Natural Selection. BioMed Research international, Vol.2013.
- Cristina J, Moreno P, Moratorio G, Musto H. (2015) Genome-wide analysis of codon usage bias in Ebola virus. Virus Research, Vol.196, 87-93.
- Dorn A, Kippenberger S. (2008) Clinical application of CpG-, non-CpG-, and antisense oligodeoxynucleotides as immunomodulators. Current opinion in molecular therapeutics, Vol. 10, 10-20.
- Gu W, Zhou T, Ma J, Sun X, Lu Z. (2003) Analysis of synonymous codon usage in SARS Coronavirus and other viruses in the Nidovirales. Virus Research, Vol. 101, 155-161.
- Huang YJ, Higgs S, Horne KM, Vanlandingham DL. (2014) Flavivirus-mosquito interactions. Viruses, Vol.6, 4703-4730.
- Jenkins GM, Holmes EC. (2003) the extent of codon usage bias in human RNA viruses and its evolutionary origin. Virus Res, Vol. 92, 1–7.
- Kanaya S, Kinouchi M, Abe T, Kudo Y, Yamada Y, Nishi T, Mori H, Ikemura T.(2001) Analysis of codon usage diversity of bacterial genes with a self-organizing map (SOM): characterization of horizontally transferred genes with emphasis on the E.coli O157 genome. Gene, Vol. 276, 89-99.
- Krieg AM. (2003) CpG DNA: trigger of sepsis, mediator of protection, or both? .Scandinavian journal of infectious diseases, Vol.35, 653-659.
- Lobo FP, Mota BE, Pena SD, Azevedo V, Macedo AM, Tauch A, Machado CR, Franco GR. (2009) Virus-host coevolution: common patterns of nucleotide motif usage in Flaviviridae and their hosts. PLoS One, Vol.4, e6282.
- Lu G, Huang J, Yang Q, Xu H, Wu P, Fu C, Li S. (2017) Identification and genetic characterization of Hepacivirus and Pegivirus in commercial equine serum products in China. PLoS One, Vol.7, 12.
- Lu H, Zhao WM, Zheng Y, Wang H, Qi M, Yu XP. (2005) Analysis of synonymous codon usage bias in Chlamydia. Acta Biochim Biophys Sin (Shanghai), Vol. 37, 1-10.
- Ma J-J, Zhao F, Zhang J ,Zhou J H, Ma L, Ding Y (2013). Analysis of Synonymous Codon Usage in Dengue Viruses. Journal of animal and veterinary advances, Vol. 12, 88-98.
- F, Mohabatkar.H, Mohsenzadeh.S. (2011) Analysis of synonymous codon usage bias and nucleotide and amino acid composition in 13 species of Flaviviridae. Journal of Cell and Molecular Research, Vol. 3, 1-11.
- Moratorio G, Iriarte A, Moreno P, Musto H, Cristina J. (2013) A detailed comparative analysis on the overall codon usage patterns in West Nile virus. Infection, genetics and evolution: journal of molecular epidemiology and evolutionary genetics in infectious diseases. Elsevier, vol. 14, 396-
- Sharp PM, Cowe E, Higgins DG, Shields DC, Wolfe KH, Wright F. (1988). Codon usage patterns in Escherichia coli, Bacillus subtilis, Saccharomyces cerevisiae, Schizosaccharomyces pombe, Drosophila melanogaster and Homo sapiens; a review of the considerable within-species diversity. Nucleic Acids Research, Vol.16, 8207-8211.
- Su MW, Lin HM, Yuan HS, Chu WC. (2009) Categorizing host-dependent RNA viruses by principal component analysis of their codon usage preferences. Journal of Computational Biology, Vol. 16, 1539-47.
- Tatarinova TV, Alexandrov NN, Bouck JB, Feldmann KA (2010) GC3 biology in corn, rice, sorghum and other grasses. BMC Genomics, Vol.11, 308.
- Tao P, Dai L, Luo M, Tang F, Tien P, Pan Z. (2009) Analysis of synonymous codon usage in classical swine fever virus. Virus Genes, Vol. 38,104-12.
- Tautz N, Tews BA, Meyers G. (2015) The Molecular Biology of Pestiviruses. Advances in Virus Research, Vol. 93, 47-
- Theze J, Lowes S, Parker J, Pybus OG. (2015) Evolutionary and Phylogenetic Analysis of the Hepaciviruses and Pegiviruses. Genome Biology and Evolution, Vol. 7, 2996-3008.
- Van Hemert F, Berkhout B. (2016) Nucleotide composition of the Zika virus RNA genome and its codon usage. Virology Journal, Vol.13, 95.
- Velazquez-Salinas L, Zarate S, Eschbaumer M, Pereira Lobo F, Gladue DP, Arzt J, Novella IS, Rodriguez LL. (2016) Selective Factors Associated with the Evolution of Codon Usage in Natural Populations of Arboviruses. PLoS One, Vol. 25,
- Wang M, Zhang J, Zhou JH, Chen HT, Ma LN, Ding YZ, Liu WQ, Liu YS. (2011) Analysis of codon usage in bovine viral diarrhoea virus. Archives of Virology, Vol. 156,153-60.
- Wang M, Liu YS, Zhou JH, Chen HT, Ma LN, Ding YZ, Liu WQ, Gu YX, Zhang J. (2011) Analysis of codon usage in Newcastle disease virus. Virus Genes, Vol.42, 245-253.
- Wang H, Liu S, Zhang B, Wei W.(2016) Analysis of Synonymous Codon Usage Bias of Zika Virus and Its Adaption to the Hosts. PLoS One, Vol.11, 11.
- Wong EH, Smith DK, Rabadan R, Peiris M, Poon LL (2010) Codon usage bias and the evolution of influenza A viruses. Codon Usage Biases of Influenza Virus. BMC Evolutionary Biology, Vol.10, 253.
- Wright F. (1990) the ‘effective number of codons’ used in a gene. Gene, Vol.87, 23-29.
- Xiang H, Zhang R, Butler RR 3rd, Liu T, Zhang L, Pombert JF, Zhou Z (2015) Comparative Analysis of Codon Usage Bias Patterns in Microsporidian Genomes. PLoS One, Vol.10, 6.
- Yadav MK, Swati D. (2012) Comparative genome analysis of six malarial parasites using codon usage bias based tools. Bioinformation, Vol. 8, 1230-1239.
- Zhang J, Wang M, Liu WQ, Zhou JH, Chen HT, Ma LN, Ding YZ, Gu YX, Liu YS. (2011) Analysis of codon usage and nucleotide composition bias in polioviruses .Virology Journal, Vol. 8, 146.
- Zhang X, Jia R, Shen H, Wang M, Yin Z, Cheng A.(2017) Structures and Functions of the Envelope Glycoprotein in Flavivirus Infections. Viruses, Vol.9, 338.
- Zhong J, Li Y, Zhao S, Liu S, Zhang Z. (2007) Mutation pressure shapes codon usage in the GC-Rich genome of foot-and-mouth disease virus. Virus Genes, Vol.35, 767-776.
- Zhou JH, Gao ZL, Zhang J, Chen HT, Pejsak Z, Ma LN, Ding YZ, Liu YS.(2012) Comparative codon usage between the three main viruses in Pestivirus genus and their natural susceptible livestock. Virus Genes, Vol.44, 475-481
- Zhou T, Gu W, Ma J, Sun X, Lu Z. (2005) Analysis of synonymous codon usage in H5N1 virus and other influenza A viruses. Biosystems, Vol.81, 77-86.

