1*PG and Research Department of Zoology, Vivekanandha College of Arts and
Sciences for Women, Tiruchengode, Namakkal -637205, Tamil Nadu, India.
2PG and Research Department of Zoology, Nirmala College for women, Coimbatore – 641018, Tamil Nadu, India.
3Marine Planktonology and Aquaculture Laboratory, Department of Marine Science,
School of Marine Sciences, Bharathidasan University, Tiruchirappalli – 620 024, Tamil Nadu, India.
Corresponding author email: neethujeni@gmail.com
Article Publishing History
Received: 15/05/2023
Accepted After Revision: 25/06/2023
Phytoplankton are the primary source of food, attributed most zooplankton communities and larval stages, and many meroplankton such as bivalves, crustaceans, and fishes. In the present study, phytoplankton samples were collected from surface water and substratum of the ship hull during the period of June 2015 to May 2016. Population density recorded from water and substratum of the ship hull ranged from 1.5e+4 to 3.4e+4 cells/L. Shannon-Wiener diversity index (H‛) of station I and station II ranged from 5.448 to 6.134 bits/ind. Simpson’s richness range was 0.973 to 0.984 at station I and station II. Pielou’s Evenness index (J’) was found to be from 0.950 to 0.979 and Chlorophyll ‘a’ range was 0.277 to 1.326 mg/m3 in the station I and station II. During this entire study period, 74 species of phytoplankton and 54 species of phytoplankton in station II have been recorded.
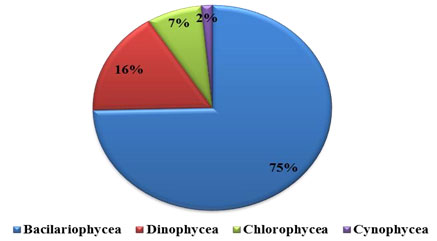
Data of the present study show that significant differences occurred in over all percentage composition of phyhtoplankton species, both in in water and substratum. In water samples, recorded data showed that 85% were of Bacillariophyceae, 8 % of Chlorophyceae and, 7% of Dinophyceae. On the other hand, 75 % Bacillariophyceae, 7 % Chlorophyceae, 16% Dinophyceae and 2% Cyanophyceae were recorded in the substratum. The marine biofouling phytoplankton density, diversity, richness, evenness and chlorophyll’a’ were recorded in their maximum levels during summer season, and minimum were obtained in the monsoon. The diatoms were the predominant groups among the phytoplankton. Among the diatoms, species like Nitzschia longissima, Coscinodiscus centralis and Fragilaria sp. were record almost in all the seasons in the present study.
Chlorophyll, Phytoplankton, Population density, substratum, water
Nithya P, Dhanalakshmi B, Santhanam P. Ecology of Biofouling Phytoplankton in Chinnamuttom Harbour Waters Southeast Coast of India. Biosc.Biotech.Res.Comm. 2023;16(2).
Nithya P, Dhanalakshmi B, Santhanam P. Ecology of Biofouling Phytoplankton in Chinnamuttom
Harbour Waters Southeast Coast of India. Biosc.Biotech.Res.Comm. 2023;16(2). Available from: <a href=”https://bit.ly/2U8EBeg“>https://bit.ly/2U8EBeg</a>
INTRODUCTION
Phytoplankton by virtue of drifting habits in illuminated waters of our planet and short turnover periods link the oceanic food web and its trophic marine structures. These are extremely diverse energy sources, distributed across major eukaryotic lineage, in food web of the aquatic ecosystems, playing a key role in planktonic communities, ecological structure, function, and the dynamic fate of the biota, (Mattei and Scardi 2021). In marine ecosystems, the phytoplankton (<1µm to ≈1mm length in diameter) represent at least five eukaryotic phyla, which are one of the world’s simplest, basic and dominant key producers of the primary marine food chain, (Sun et al. 2000).
Anthropogenic discharge of nutrient load to sea waters, increase of global carbon emission and their mix with wide oceanic surface water, multitude seasonal hydrogeochemical changes impacts on the primary producers. Hence about 45% of global net primary productivity plays a critical role in biogeochemical functions and production of climatically active gases. The earlier estimate of Geider et al. (2014) indicates that, the extensive range in size and desperate genetic diversity challenges the phytoplankton quantification and characterization, (Kim and Kim 2021).
Species composition, density, abundance, richness and primary productivity of phytoplankton vary in coastal geography, which is liable to physiological and hydro-biological fluctuation (Al-amri et al. 2020). Physicochemical values, phytoplankton and zooplankton species, and their composition, abundance, seasonal variations have been studied in various regions of Indian coastal waters (Vajravelu et al. 2018). Significantly, the phytoplankton are the major contributors in absorbing atmospheric carbon than the terrestrial plants, also, these plankton takes a major role in global carbon dioxide sequestration, oxygen production, nutrient cycle, and carbon fixation and contributes to global warming and the existence of aquatic lifeforms (Paffenhofer, 1993). Consequently, assessing the species composition and their density diversity is necessary to assess a healthy ecosystem.
Changes in phytoplankton ecology and diversity are driven by several major unresolved conceptual challenges, perhaps the foremost of which is the marine pollution of fouling. Analysis of diversity and ecology of phytoplankton has largely benefited many research fields in biology as it is entering a new era with the advent of fostering the improvement of the predictive tool of phytoplankton distribution at global scales. Hence, the present study was focused on diversity, density, species composition, richness, and evenness of phytoplankton community in the fishing harbor environment concerning the prevailing hydrographical conditions of Chinnamuttam area which harbours waters of southeast coast of India.
MATERIAL AND METHODS
Sampling program: A total of four sampling sessions were conducted during the study period i.e. June 2015 to May 2016, between the hours of 06.00 hrs and 12.00 hrs
Collection of samples :The phytoplankton sampling was done using standard Indian Ocean hand net (48μm) by towing horizontally in water surface for 30 minutes, as well the sampling from substratum of ship hull was collected by scraping using sterile spatula (Manickam et al. 2017).
Preparation of the sample: 10ml/L Lugol’s iodine was added into samples and kept standing for 24hrs to ensure complete sedimentation followed by centrifugation if necessary. The supernatant liquid was removed using pipette and the sample was further concentrated up to 10-100ml depending on the number of plankton.
Fixation and Preservation of samples: The formalin was added in the ratio of 5-10 to 90 parts(v/v) and the bottle was inverted for fine dispense. The pH of the solutions was maintained at 7.6 – 8.3.
Observation of phytoplankton: The observation of phytoplankton was done by exposing the concentrated sample to the Light microscope (COSLAB). The phytoplankton observed under microscope were taken with the support of a digital camera (MDCE-5C).
Identification of phytoplankton :The identification of phytoplankton was carried out with the help of standard books, identification manuals and classical works of Subramanyan (1946); Subramanyan (1968); Venkataraman (1939); Tomas (1997and Mitra et al. (2004).
Plankton enumeration using Sedgwick-Rafter Cell method: One ml of well mixed plankton samples was poured into the Sedgewick-Rafter cell using graduated pipette and uniformly spread as thin layers. The plankton numbers were counted by selecting squares randomly. The plankton density was estimated using the following formula. Calculation N = n x v/V Where, N = Total number of plankton cells / L, n = Average number of plankton cells in 1 ml of sample v = Volume of plankton concentrate, V = Total volume of water filtered (L).
Diversity Analysis of plankton samples: The diversity indices (DI) of phytoplankton in Chinnamuttom harbour was calculated using Shannon Weiner’s Index (H’), Simpson richness index (D’) and Evenness index (E’), which was calculated by using PAST– Palaeontological Statistics Ver. 2.00 software packages.
Chlorophyll- ‘a’ : 250 ml of collected water sample was filtered through (0.45 diameter GF/ C filter paper) Millipore filtering unit. Then filtered paper was soaked in acetone and kept in dark for 20–24 hours under refrigeration to extract the chlorophyll. The centrifuged concentration of chlorophyll extracts measured spectrometric at 665nm (APHA, 2010).
RESULTS AND DISCUSSION
Species composition: The phytoplankton samples collected from Chinnamuttom fishing harbour was analysed for the one-year period from 2015 to 2016. In the one year study period, totally 74 phytoplankton species were recorded, viz.. 57 species of Bacillariophycea, 9 species of Dinophycea and 8 species of Chlorophycea in water sample, whereas in the substratum of the ship hull 59 phytoplankton species were recorded. Among the total of 59 species, 45 Bacillariophycea species, 8 Dinophycea species, 4 Chlorophycea species, and 2 species of Cynophycea were noted. Similar, study was conducted recently in southeast coast of India and recorded five different classes (Vajravelu et al. 2017)
Among the recorded species of sampling stations (Bacillariophyceae, Dinophyceae, Cyanophyceae and Chlorophyceae) diatoms were found to be dominant contributor (75–85%) of the total phytoplankton. Especially, species such as Nitzchia spp., constituted the maximum numbers followed by Navicula spp., and Coscinodiscus spp. The domination in phytoplankton group was in the order: Diatom > Dinoflagellates > Green algae > Blue-green algae.
Percentage composition: Phytoplankton comprised of Bacillariophyceae (diatoms), Dinophyceae (Dinoflagelates), Chlorophyceae (green algae) and Cyanophycean (blue green algae). The recorded phytoplankton number from the collected samples were composed of 85% by Bacillariophyceae, 8% Dinophyceae and 7% by Chlorophyceae, were recorded in water sample (Figure 1 and 2 ). All these groups were present in all four seasons. In substratum of the ship hull, the recorded compendial count of 75% Bacillariophyceae, 16% Dinophyceae, 7% Chlorophyceae and 2% Cyanophycean (Figure 1). Therefore, totally 74 and 59 phytoplankton species were recorded in water and substratum of the ship hull in Chinnamuttom harbour respectively during the study period.
Figure 1: Percentage composition of phytoplankton in Chinnamuttom Harbour water during June 2015-May 2016.
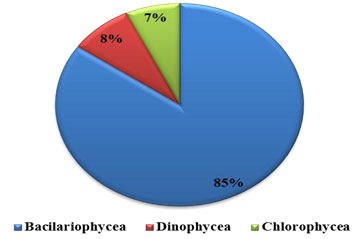
Figure 2: Percentage composition of phytoplankton in Chinnamuttom Harbour substratum during June 2015 – May 2016
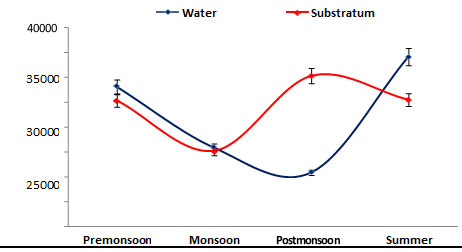
Population density: Population density of phytoplankton was recorded from water and substratum of the ship hull, in the range between 15000 – 34000 cells/L. The minimum density was recorded during monsoon (1500 cells/L) in the substratum of the ship hull, while the maximum value (34000 cells/L) was noticed during summer in the water sample (Figure 3). In the present study, the phytoplankton population density was found to be high (15000 cells/ L) during summer could be 77 attributed to stability in hydrographical conditions, and minimum density (34000 cells/ L) was obtained during monsoon due to low salinity and high turbidity due to rainfall (Senthilkumar et al. 2002). A similar increased number of phytoplankton species significant with high salinity increase in Bay of Bengal were reported (Rajasekar et al. 2005).
Figure 3: Seasonal variations in phytoplankton density during June 2015 – May 2016
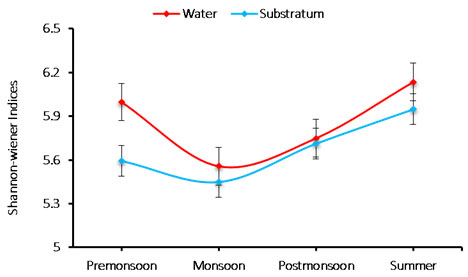
Species diversity: Species diversity of phytoplankton was recorded in the range between 5.448 and 6.134. The minimum (5.448) diversity was recorded during monsoon in substratum of the ship hull, whereas the maximum value (6.134) was noticed during summer in water sample (Figure 4). The diversity index of species varied from 5.448 to 6.134 cells/L. The species minimum diversity (5.448) was recorded during monsoon in the substratum, and maximum (6.134) observed during summer in water; hence due to unfavorable water quality and environmental conditions of monsoon, low species diversity was observed. The phytoplankton range during summer, increased species diversity was recorded may be significant to allochthonous species occurrence (Senthilkumar et al. 2002; Rajasekar et al. 2005).
Figure 4: Seasonal variations in phytoplankton species diversity during June 2015-May 2016
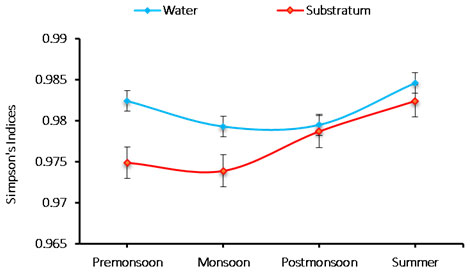
Species richness: An analysis of the phytoplankton species richness at Chinnamuttom harbour was noticed to be the range between 0.973 and 0.984. The minimum (0.973) richness during monsoon in substratum, and maximum (0.984) was during summer in the water sample (Figure 5). The richness index of species (0.973-0.984 cells/L) are between 0.973 and 0.984. In substratum, minimum species richness was 0.973 during monsoon, and the maximum was 0.984 during summer in the water. The recorded species richness variation was correlated with the recorded salinity values (Mani, 1992).
Figure 5: Seasonal variations in phytoplankton species richness during June 2015-May 2016.
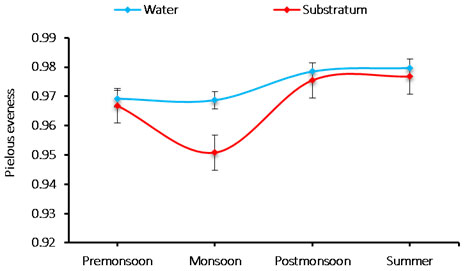
The species evenness: The evenness index was varied 0.950 to 0.979 cells/L in phytoplankton species. The minimum species evenness was recorded 0.950 cells/L during monsoon in the substratum and the maximum 0.979 cells/L was observed during summer in water (Figure 6).
Figure 6: Seasonal variations in phytoplankton species evenness during June 2015-May 2016
Chlorophyll ‘a: chlorophyll ‘a’ ranged between (0.277 to. 1.326 mg/m3), the higher concentration of 1.067mg/m3 was found in summer season. Significant high population of phytoplankton density during summer season was reported in Palk Bay coral reef region (Sridhar et al., 2010). The 0.277 mg/m3 concentration of low chlorophyll ‘a’ was obtained on monsoon season may be due to low phytoplankton production owing to high turbidity and low light availability due to high land drainage and cloudy sky (Kawabata et al. 1993, Godantaraman 2002, Rajasekar et al. 2005). The phytoplankton density, richness, composition, diversity, and evenness indices are significant to the variations in seasonal physicogeological condition variation (Figure 7).
Figure 7: Seasonal variations in chlorophyll ‘a’ concentration during June 2015-May 2016
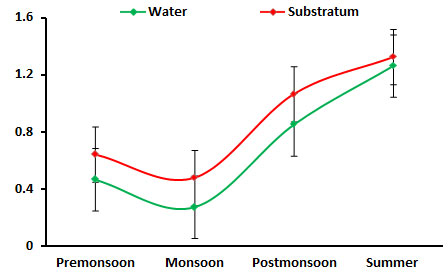
Table 1. List of phytoplankton species recorded in Chinnamuttom Harbour during June 2015 – May 2016
| S. No. | Species Name | Water | Substratum |
| BACILLARIOPHYCEAE (Diatoms) | |||
| 1 | Asterionellopsis glacialis | + | + |
| 2 | Bacteriastrum comosum | + | + |
| 3 | B. paradaxa | + | + |
| 4 | B. delicatula | + | + |
| 5 | Biddulphia aurita | + | – |
| 6 | B. sinensis | + | + |
| 7 | B. mobiliensis | + | + |
| 8 | Chaetoceros affinis | + | + |
| 9 | C. compressus | + | + |
| 10 | C. dydymus | + | – |
| 11 | C. longissimi | + | + |
| 12 | C. lorenzianus | + | + |
| 13 | C. messanensis | + | + |
| 14 | C. paruvianus | + | + |
| 15 | Coscinodiscus centralis | + | + |
| 16 | C. concinnes | + | + |
| 17 | C. gigas | + | + |
| 18 | C. jonesianus | + | + |
| 19 | C. marginatus | + | + |
| 20 | C. radiates | + | + |
| 21 | Diploneis robusta | + | + |
| 22 | Ditylum brightwelli | + | + |
| 23 | Fragilaria sp. | + | + |
| 24 | F. intermedia | + | – |
| 25 | F. oceanica | + | + |
| 26 | Gyrosigma balticum | + | + |
| 27 | Hemidiscus cuneformis | + | + |
| 28 | H.hardmannianus | + | – |
| 29 | Hyalodiscus stelliger | + | – |
| 30 | Lauderia annulate | + | – |
| 31 | Leptocylindrus danicus | + | – |
| 32 | Navicula forcipate | + | + |
| 33 | N. granulate | + | – |
| 34 | N. longa | + | + |
| 35 | Nitzschia Closterium | + | + |
| 36 | N. longissimi | + | + |
| 37 | N. paradoxa | + | + |
| 38 | N. sigma | + | + |
| 39 | N. sigmoidea | + | + |
| 40 | Odontella mobiliensis | + | + |
| 41 | O. sinensis | + | + |
| 42 | Planktoniella sol | + | + |
| 43 | Pleurosigma angulatum | + | + |
| 44 | P. elongatum | + | + |
| 45 | Rhizosolenia setigera | + | – |
| 46 | R .robusta | + | – |
| 47 | R. setigera | + | + |
| 48 | R. styliformis | + | + |
| 49 | Skeletonema costatum | + | + |
| 50 | Thalassionema nitzschiodes | + | + |
| 51 | T. mobilienis | + | + |
| 52 | T. subtilis | + | + |
| 53 | Thalassiothix frauenfeldii | + | + |
| 54 | T. longissimi | + | + |
| 55 | Triceratium favus | + | + |
| 56 | Triceratium robertsianum | + | – |
| 57 | T. reticulatum | + | – |
| DINOPHYCEAE (Dinoflagellates) | |||
| 58 | Ceratium extensum | + | + |
| 59 | C. declinatum | + | + |
| 60 | C. furca | + | + |
| 61 | C. harridum | + | + |
| 62 | C. macroceros | + | + |
| 63 | C. minutam | + | + |
| 64 | C. trichoceros | + | + |
| 65 | Dinophysis caudate | + | + |
| 66 | Dinophysis sp. | + | – |
| CYANOPHYCEAE(Blue-Greens) | |||
| 67 | Trichodesmium erythraeum | – | + |
| 68 | Spirulina meneghiniana | – | + |
| CHOLOPHYCEAE(Greens) | |||
| 69 | Chlorella vulgaris | + | – |
| 70 | C. marina | + | + |
| 71 | Clostriopsis longissimi | + | + |
| 72 | Tetraselmis gracilis | + | + |
| 73 | Oedogoniumde sikaeharyii | + | + |
| 74 | Pediastrum simplex | + | – |
| 75 | Spirogyra indica | + | – |
| 76 | Spirogyra sp | + | – |
+ Presence; – Absence
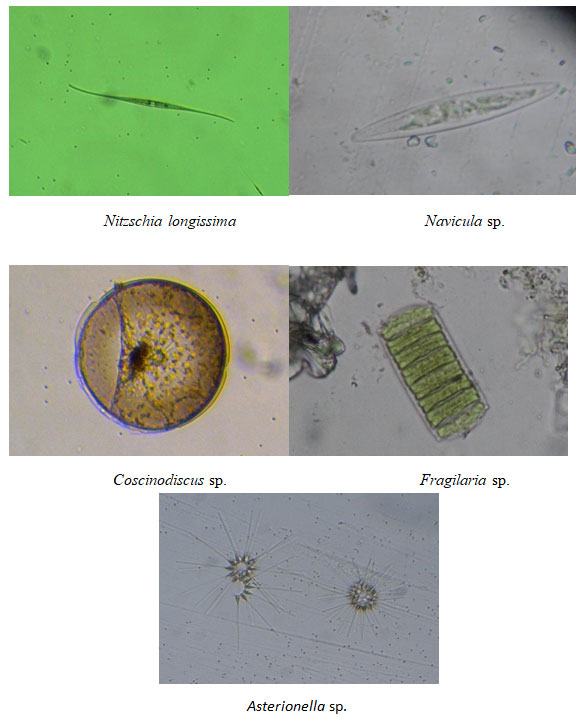
Figure 8: Dominant phytoplankton species recorded at Chinnamuttom harbour during May -June months
CONCLUSION
Data of the present study show that significant differences occurred in over all percentage composition of phyhtoplankton species, both in in water and substratum. In water samples, recorded data showed that 85% were of Bacillariophyceae, 8 % of Chlorophyceae and, 7% of Dinophyceae. On the other hand, 75 % Bacillariophyceae, 7 % Chlorophyceae, 16% Dinophyceae and 2% Cyanophyceae were recorded in the substratum. The marine biofouling phytoplankton density, diversity, richness, evenness and chlorophyll’a’ were recorded in their maximum levels during summer season, and minimum were obtained in the monsoon. The diatoms were the predominant groups among the phytoplankton. Among the diatoms, species like Nitzschia longissima, Coscinodiscus centralis and Fragilaria sp. were record almost in all the seasons in the present study.
ACKNOWLEDGEMENTS
Authors are thankful to the Head, Department of Zoology, Nirmala College for Women (Autonomous), Coimbatore-18 and authorities of Bharathidasan University, Tiruchirappalli-24 for the facilities provided.
REFERENCES
Coast of India. In Basic and Applied Zooplankton Biology (pp. 45-86). Springer, Singapore.
Geider, R.J., Moore, C.M. and Suggett, D.J., 2014. Ecology of Marine Phytoplankton 17. Ecology and the Environment, p.483.
Godhantaraman, N., 2002. Seasonal variations in species composition, abundance, biomass and estimated production rates of tintinnids at tropical estuarine and mangrove waters, Parangipettai, southeast coast of India. Journal of Marine Systems, 36(3-4), pp.161-171.
Kawabata, Z., Magendran, A., Palanichamy, S., Venugopalan, V.K. and Tatsukawa, R., 1993. Phytoplankton biomass and productivity of different size fractions in the Vellar estuarine system, southeast coast of India.
Mani, P., 1992. Natural phytoplankton communities in Pichavaram mangroves.
Mitra, A., Banerjee, K. and Gangopadhyay, A., 2004. Introduction to marine plankton. Daya Publishing House.
Paffenhofer, G.A., 1998. On the relation of structure, perception and activity in marine planktonic copepods. Journal of Marine Systems, 15(1-4), pp.457-473.
Rajasekar, K.T., Peramal, P. and Santhanam, P., 2005. Phytoplankton diversity in the Coleroon estuary, Southeast coast of India. Journal of Marine biological association of India, 47, pp.127-132.
Reynolds, C.S., 1993. Scales of disturbance and their role in plankton ecology. In Intermediate Disturbance Hypothesis in Phytoplankton Ecology (pp. 157-171). Springer, Dordrecht.
Saravanakumar, A., Serebiah, J.S., Thivakaran, G.A. and Rajkumar, M., 2007. Benthic macrofaunal assemblage in the arid zone mangroves of gulf of Kachchh-Gujarat. Journal of Ocean University of China, 6(3), pp.303-309.
Senthilkumar, S., Santhanam, P. and Perumal, P., 2002, January. Diversity of phytoplankton in Vellar estuary, southeast coast of India. In Proc. 5th Indian Fisheries Forum (Eds.: S. Ayyappan, JK Jena and M. Mohan Joseph). Published by AFSIB, Mangalore and AeA, Bhubanewar, India (pp. 245-248).
Subrahmanyan, R., 1946, October. A systematic account of the marine plankton diatoms of the Madras coast. In Proceedings of the Indian Academy of Sciences-Section B (Vol. 24, No. 4, pp. 85-197). Springer India.
Subramanyan, R., 1968. The dinophyceae of the Indian Sea. Marine Biological Association of India. Mar Biol Assoc India, 3, pp.118-133.
Sun, J., Liu, D.Y. and Qian, S.B., 2000. Study on phytoplankton biomass, III. Estimated bulk measurement biomass of phytoplankton in the Jiaozhou Bay. Acta Oceanol. Sin, 22, pp.293-299.
Tomas, C.R. ed., 1997. Identifying marine phytoplankton. Elsevier.
Venkataraman, G., 1939, December. A systematic account of some south Indian diatoms. In Proceedings of the Indian Academy of Sciences-Section B (Vol. 10, No. 6, pp. 293-368). Springer India.

