1V ClinBio Labs, Central Research Facility, Sri Ramachandra University, Porur, Chennai-600116 India
2Department of Chemistry Sri Chandrasekharendra Saraswathi Viswa MahaVidyalaya University Enathur, Kanchipuram – 631 561, Tamilnadu, India.
Corresponding author email: rajakarthis14@gmail.com
Article Publishing History
Received: 11/04/2020
Accepted After Revision: 29/05/2020
We present an in silico learning method to discriminate the pathologically important vascular endothelial growth factor (VEGF) protein through proteomic tools. Primary structure analysis showed most of the VEGF human proteins are rich in hydrophilic residues. The average molecular weight of VEGF human proteins calculated as 76244 Dalton. Grand Average hydropathy (GRAVY) index of all the VEGF human proteins are ranging from -0.2 to 0.1 except the protein O14495 which has comparatively high GRAVY value. Antigenic sites for all the proteins are recognized as C, Y, L, V, P, and K residues-EMBOSS antigenic program. The computed pI value indicates that most of the proteins are basic (pI>7) in nature. SOPM and SOPMA program shows that all the VEGF human proteins are different in secondary structural content. The presence of disulfide bridges are identified by CYS_REC tool, also visualized through 3D structure. The SOSUI server classifies the proteins P15692, P49765 and O43915 as soluble proteins and other proteins as transmembrane proteins. The projected technique provides more accurate information about 3D structure, geometry, cystines involved in the disulfide bond. It would provide biological insights about protein hubs and their roles in interaction networks.
VEGF Proteins, Proteomic Tools, Homology Modeling, Transmembrane Proteins, Disulfide Bridges.
Rajamani K, Sivakumar K. Computational Characterization of Human Vascular Endothelial Growth Factor Proteins. Biosc.Biotech.Res.Comm. 2020;13(2).
Rajamani K, Sivakumar K. Computational Characterization of Human Vascular Endothelial Growth Factor Proteins. Biosc.Biotech.Res.Comm. 2020;13(2). Available from: https://bit.ly/2yosSNj
Copyright © Rajamani and Sivakumar This is an open access article distributed under the terms of the Creative Commons Attribution License (CC-BY) https://creativecommns.org/licenses/by/4.0/, which permits unrestricted use distribution and reproduction in any medium, provide the original author and source are credited.
INTRODUCTION
Over the past few decade the occurrence of chronic diseases was increased due to change in life style, exposed to carcinogens that results in endothelial damage and failure to repair these injuries are the main cause of vascular injuries. Endothelial damage led to development of pulmonary disease, cancer and cardiovascular diseases. In all such chronic diseases, angiogenesis growth factor plays a predominant role. It is a physiologic process it involves formation of new blood vessels from pre-existing microvasculature (Goldmann, 1907, Okada, 2014; Yang, et al; 2017; Hulse, 2017).
The importance of this process widely known to be essential for growth of developing organs, wound healing, ovulation and pregnancy (Alitalo & Carmeliet, 2002). Ocular conditions related to angiogenesis also the leading cause of irreversible vision loss (Penna et al., 2008). Vascular endothelial growth factor (VEGF) – a dimeric glycoprotein and platelet derived growth factor (PDGF) have critical role in tumor-associated angiogenesis (Rivera & Bergers, 2015), cardiovascular diseases (Anthony Ware & Michael Simons, 1997) and principal causes of blindness (Penna et al., 2008). Where, the increase in vascular permeability to plasma proteins, induction of endothelial cell division and migration are widely reported in tumor angiogenesis (Dvorak, 2002; Hicklin & Ellis, 2005). About five glycoproteins are considered as the family of VEGF (VEGF-A, VEGF-B, VEGF-C, VEGF-D/F14F) and placental growth factor (PlGF) (Lee, Ellis & Daniel, 208; Dvorak, 2002; Hicklin & Ellis, 2005).
VEGF-A isoform known to play a dominant role in solid tumors. The activation of VEGF ligands happens through binding to type III receptor tyrosine kinases, designated VEGFR1 (FLT1), VEGFR2 (KDR) and VEGFR3 (FLT4) (Waltenberger et al., 1994; Hiratsuka et al., 1998). The functional diversity of each tyrosine kinases depends on binding to specific receptors. Where, the expression of VEGFR1 is on vasculature and the exact role in vascular endothelium remain to be elucidated. Both VEGFR1 and VEGFR2 selectively expressed on vascular endothelial cells. In case of VEGFR3 has fundamental character in lymphatic system and embryogenesis (Laakkonen et al., 2007). In addition to these receptor tyrosine kinases (RTKs), VEGF interacts with a family of co-receptors, the neuropilins. The neuropilin receptor (NRP-1) expressed on vascular endothelium and neurons.
VEGF-B (also called VEGF-related factor/VRF) is expressed more abundant in the heart and in the skeletal muscle cells (Olofsson et al., 1998). VEGF-C, it produced as a single propeptide, the N-terminal and C-terminal ends are proteolytically processed to generate a protein with high affinity for VEGFR-2 and VEGFR-3. VEGF-C induces mitogenesis and migration of EC (Kukk et al., 1996). In this regard, identifying specific regions is fundamental for scientific disciplines that require detailed characterization of proteins to explain essential biological systems. However, biochemical and physicochemical characterization of VEGF proteins have not been done so far. By characterizing the VEGF proteins, we can impact our understanding of the relationship between protein flexibility and function. From this investigation we report the computational analysis and characterization of 11 VEGF proteins from Homosapiens using proteomic tools and online prediction servers.
Proteomic tools and methods: Protein sequence retrieval and selection
Vascular Endothelial Growth Factor (VEGF) human proteins were retrieved from the UniProtKB/Swiss-Prot release 57.0 (http://www.expasy.org/sprot) protein sequence database. The Swiss-Prot database was scanned for the keyword “vascular endothelial growth factor, Homo sapiens (Human) [9606]” through the search interface available in the Swiss-Prot database. The search yielded 65 proteins; all these protein sequences were downloaded in FASTA format (Lipman & Pearson, 1985). These 65 protein sequences were matched with each other using the online server “Blast 2 sequences” (http://www.ncbi.nlm.nih.gov/blast/bl2seq/wblast2.cgi) and finally 11 dissimilar protein sequences were selected for analysis. The details of vascular endothelial growth factor human proteins selected for analysis are tabulated in Table 1.
Table 1. Human VEGF protein sequences retrieved from Swiss-Prot Knowledgebase
| Accession Number | Entry name | Protein Names | Gene names | Length |
| O14495 | LPP3_HUMAN | Vascular endothelial growth factor and type I collagen-inducible protein (VCIP) | PPAP2B (LPP3) | 311 |
| O14786 | NRP1_HUMAN | Vascular endothelial cell growth factor 165 receptor | NRP1 (NRP) (VEGF165R) | 923 |
| O60462 | NRP2_HUMAN | Vascular endothelial cell growth factor 165 receptor 2 | NRP2 (VEGF165R2) | 931 |
| P58294 | PROK1_HUMAN | Endocrine-gland-derived vascular endothelial growth factor (EG-VEGF) | PROK1 (UNQ600/PRO1186) | 105 |
| P15692 | VEGFA_HUMAN | Vascular endothelial growth factor A (VEGF-A) (Vascular permeability factor) (VPF) | VEGFA (VEGF) | 232 |
| P49765 | VEGFB_HUMAN | Vascular endothelial growth factor B (VEGF-B) (VEGF-related factor) (VRF) | VEGFB (VRF) | 207 |
| P49767 | VEGFC_HUMAN | Vascular endothelial growth factor C (VEGF-C) (Vascular endothelial growth factor-related protein) (VRP) | VEGFC | 419 |
| O43915 | VEGFD_HUMAN | Vascular endothelial growth factor D (VEGF-D) | FIGF (VEGFD) | 354 |
| P17948 | VGFR1_HUMAN | Vascular endothelial growth factor receptor 1 (VEGFR-1) (Vascular permeability factor receptor) | FLT1 (FLT) (FRT) | 1338 |
| P35968 | VGFR2_HUMAN | Vascular endothelial growth factor receptor 2 (VEGFR-2) | KDR (FLK1) | 1356 |
| P35916 | VGFR3_HUMAN | Vascular endothelial growth factor receptor 3 (VEGFR-3) | FLT4 | 1298 |
Proteomic tools and servers:The amino acid composition of human vascular endothelial growth factor proteins were computed using the tool BioEdit 5.0.9 (Hall, 1999). Percentages of hydrophobic and hydrophilic residues were computed using the primary structural data. The physico-chemical parameters such as theoretical isoelectric point (pI), molecular weight, extinction coefficient (Gill & Von Hippel, 1989), half-life (Bachmair et al., 1986; Gonda et al., 1989; Tobias et al., 1991; Ciechanover & Schwartz, 1989; Varshavsky, 1997), instability index (Guruprasad et al., 1990), aliphatic index (Ikai, 1980), antigenic site and grand average of hydropathy (GRAVY) (Kyte & Doolittle, 1982) values were computed using the Expasy’s ProtParam prediction server (Gasteiger et al., 2005).
The correlation between the number of acidic and basic residues is calculated on this server. The SOPM and SOPMA tools were used for the secondary structure prediction (Geourjon, Deleage, 1994 & Geourjon, Deleage, 1995). Secondary Structural Content Prediction (http://coot.embl.de/SSCP/) server is used for the computation of percentages of a-helical, b-strand and coiled regions and secondary structure class identification (Eisenhaber et al., 1996). The SOSUI server (Takatsugu Hirokawa et al., 1998) allowed the identification of transmembrane regions in VEGF human proteins. The tool BioEdit was used to compute the Kyte and Dolittle mean hydrophobicity profile of the transmembrane regions (Hall, 1999). Multiple sequence alignment of transmembrane regions computed using the MSA tool was used to generate the sequence logo of transmembrane regions (Lipman et al., 1989; Schneider & Stephens 1990). The ScanProsite tool was used to identify the profiles with a high probability of occurrence in the PROSITE database (Edouard de Castro et al., 2006; Falquet et al., 2002).
Prediction of disulfide bridges-SS bound cysteines : A disulfide bridge in VEGF proteins is predicted by two different methods. The first method defines the presence of disulfide bonds (SS) and total number of cysteines using the protein sequences (FASTA format) submitted to the CYS_REC tool. In a second method SS bonds are identified through visualization of three-dimensional (3D) structure of proteins; the 3D structure of five proteins was predicted by homology modeling using the Esypred server and visualized in the RasMol tool.
Structure analysis and validation: For comparative modeling, the five protein sequences are selected based on disulfide bridges predicted in CYS_REC tool. The similar 3D structures were predicted in Protein Data Bank (www.rscb.org) through BLASTP analysis with the expectation value of 0.01 for the O60462, P15692, P49765 & P58294 proteins. For, the other protein (O14495) a similar 3D structure was predicted with expectation value of 10. The modeled 3D structures were validated using servers Rampage (Ramachandran plot), ProQ (Protein Quality server), and ProSA (Protein Structure Analysis) (Lovell et al., 2002; Cristobal et al., 2001; Wiederstein & Sippl, 2007).
RESULTS AND DISCUSSION
Primary structure analysis suggest that most of the studied human VEGF proteins are hydrophilic in nature (Table 2 and Table 3) except O14495 (VEGF type I collagen-inducible) and P58294 (Endocrine-gland-derived VEGF) protein. The amino acids asparagines, lysine, aspartic acid, glutamine, histidine, arginine and glutamic acid are responsible for hydrophilic property. The average molecular weight of VEGF human proteins calculated is 76244 Dalton. Hydrophilic molecules are polar charged residues and capable of hydrogen bonding, dissolve more readily in water than oil. As reported earlier, the beneficial effect of hydrophilic drugs (Statin & Provastatin) in decreasing hemodynamically compromising rejection, attenuation of rise in lipid profiles; also in favor of a reduction in allograft coronary artery disease (Mandeep R. Mehra et al., 2004) [34]. Followed by, the antigenic sites (Asite) for all the VEGF proteins are identified through EMBOSS antigenic program (table 2). It attempts to understand the role of protein structure and thermodynamics of protein interactions during pathological conditions through binding at specific epitopes.
Table 2.Amino acid composition (in %) of VEGF proteins
| Amino Acids | Accession Numbers | ||||||||||
| O14495 | O14786 | O60462 | P58294 | P15692 | P49765 | P49767 | O43915 | P17948 | P35968 | P35916 | |
| Ala | 7 | 4 | 5 | 5 | 3 | 14 | 7 | 4 | 5 | 5 | 7 |
| Cys | 4 | 2 | 3 | 10 | 8 | 4 | 9 | 8 | 2 | 2 | 3 |
| Asp | 4 | 6 | 6 | 4 | 3 | 4 | 4 | 4 | 5 | 5 | 5 |
| Glu | 3 | 7 | 7 | 4 | 7 | 3 | 7 | 8 | 6 | 8 | 7 |
| Phe | 6 | 4 | 4 | 4 | 3 | 0 | 4 | 4 | 4 | 3 | 3 |
| Gly | 6 | 9 | 8 | 9 | 6 | 6 | 5 | 3 | 5 | 6 | 6 |
| His | 3 | 3 | 2 | 4 | 5 | 3 | 2 | 4 | 2 | 2 | 3 |
| Ile | 8 | 7 | 6 | 4 | 3 | 2 | 2 | 4 | 6 | 6 | 4 |
| Lys | 5 | 6 | 4 | 4 | 9 | 3 | 6 | 7 | 8 | 6 | 4 |
| Leu | 10 | 7 | 8 | 10 | 7 | 8 | 7 | 7 | 9 | 9 | 11 |
| Met | 3 | 2 | 2 | 4 | 3 | 2 | 2 | 2 | 2 | 2 | 2 |
| Asn | 5 | 5 | 4 | 3 | 3 | 0 | 5 | 3 | 4 | 4 | 3 |
| Pro | 5 | 6 | 6 | 6 | 6 | 13 | 6 | 7 | 5 | 5 | 5 |
| Gln | 3 | 3 | 4 | 1 | 6 | 6 | 5 | 4 | 3 | 4 | 4 |
| Arg | 6 | 4 | 5 | 10 | 8 | 6 | 6 | 7 | 5 | 5 | 6 |
| Ser | 8 | 8 | 9 | 6 | 6 | 8 | 8 | 10 | 10 | 8 | 8 |
| Thr | 5 | 6 | 6 | 6 | 3 | 6 | 6 | 6 | 7 | 7 | 5 |
| Val | 5 | 6 | 5 | 6 | 5 | 8 | 4 | 5 | 6 | 8 | 7 |
| Trp | 0 | 2 | 2 | 1 | 2 | 1 | 1 | 1 | 1 | 1 | 2 |
| Tyr | 5 | 4 | 4 | 1 | 3 | 1 | 3 | 1 | 4 | 4 | 3 |
Expasy’s ProtParam computes the extinction coefficient (EC) for a range of (276, 278, 280 and 282nm) wavelength. The EC value at 280nm is favoured because proteins absorb strongly while, the other substances commonly in protein solutions do not. Extinction Coefficient (EC) of VEGF human proteins at 280nm is ranging from 7615 to 214235 M-1 cm-1 with respect to the concentration of Cys, Trp and Tyr (Table 4). Expasy’s ProtParam classifies most of the VEGF human proteins as unstable on the basis of Instability index (II>40) and the two proteins (O14495, O14786) as stable (II<40) proteins in the room temperature. The aliphatic index (AI) that is defined as the relative volume of a protein occupied by aliphatic side chains (Ala, Val, Ile and Leu) is regarded as a positive factor for increase of thermal stability of globular proteins is low (57-94) for all of the VEGF human proteins and it infers that the VEGF proteins may become unstable at high temperature. Grand Average hydropathy (GRAVY) index of all the VEGF human proteins are ranging from -0.2 to 0.1 and this indicates that all these proteins may interact equally and easily with water except the protein O14495 which has comparatively high GRAVY value. Isoelectric point (pI) is the pH at which the surface of protein is covered with charge but net charge of the protein is zero. At pI proteins are stable and compact. The computed pI value indicates that most of the proteins are basic (pI>7) in nature (Table 5). The number of basic and acidic amino acids in each VEGF human proteins correlates well with the pI computed. The computed isoelectric point (pI) will be useful for developing buffer systems for purification by Isoelectric focusing method. The computed protein concentration and extinction coefficients help in the quantitative study of protein-protein and protein-ligand interactions in solution.
Table 3.Hydrophobic and hydrophilic residues content
| Accession Number | Percentage of hydrophobic residues | Percentage of hydrophilic residues | Net hydrophilic residues content |
| O14495 | 54.7 | 45.3 | Low |
| O14786 | 47.5 | 52.5 | High |
| O60462 | 46.2 | 53.8 | High |
| P58294 | 53.3 | 46.7 | Low |
| P15692 | 43.5 | 56.5 | High |
| P49765 | 46.4 | 53.6 | High |
| P49767 | 45.3 | 54.7 | High |
| O43915 | 40.4 | 59.6 | High |
| P17948 | 45.2 | 54.8 | High |
| P35968 | 46.8 | 53.2 | High |
| P35916 | 48.5 | 51.5 | High |
Table 4: Physiochemical parameters computed using BioEdit, EMBOSS, and Expasy’s ProtParam tool
| Accession No. | Length | M.Wt. | pI | -R | +R | EC | HL (hours) | II | AI | GRAVY | A Site |
| O14495 | 311 | 35116 | 9.31 | 21 | 35 | 29965 | 30 | 39.49 | 94.41 | 0.104 | 268C |
| O14786 | 923 | 103134 | 5.58 | 117 | 94 | 156995 | 30 | 35.56 | 72.54 | -0.441 | 880Y |
| O60462 | 931 | 104858 | 5.04 | 126 | 87 | 175110 | 30 | 47.57 | 72.59 | -0.47 | 889Y |
| P58294 | 105 | 11714 | 9.01 | 8 | 15 | 7615 | 30 | 40.64 | 77.05 | -0.038 | 14V |
| P15692 | 232 | 27042 | 9.21 | 24 | 40 | 39055 | 30 | 52.3 | 57.54 | -0.783 | 15L |
| P49765 | 207 | 21601 | 8.46 | 16 | 19 | 14480 | 30 | 59.27 | 75.51 | -0.232 | 55P |
| P49767 | 419 | 46883 | 7.77 | 46 | 49 | 47755 | 30 | 58.1 | 57.09 | -0.496 | 159V |
| O43915 | 354 | 40444 | 8.16 | 43 | 48 | 36825 | 30 | 56.81 | 61.67 | -0.556 | 274K |
| P17948 | 1338 | 150768 | 8.66 | 151 | 169 | 164500 | 30 | 46.14 | 82.19 | -0.35 | 12C |
| P35968 | 1356 | 151526 | 5.6 | 172 | 145 | 178020 | 30 | 45.34 | 87.21 | -0.273 | 415L |
| P35916 | 1298 | 145598 | 5.89 | 163 | 139 | 214235 | 30 | 49.19 | 85.79 | -0.282 | 159L |
M.Wt. – Molecular weight; pI – Isoelectric point; R – residues; EC – Extinction coefficient at 280nm; II – Instability Index; AI – Aliphatic Index; GRAVY – Grand Average Hydropathy; A Site – Antigenic Site.
Table 5. Computed theoretical isoelectric point (pI) and number of acidic and basic amino acids
| Accession Number | pI | No. of Basic Amino acids | No. of Acidic Amino acids | Property |
| O14495 | 9.31 | 35 | 21 | Basic |
| O14786 | 5.58 | 94 | 117 | Acidic |
| O60462 | 5.04 | 87 | 126 | Acidic |
| P58294 | 9.01 | 15 | 8 | Basic |
| P15692 | 9.21 | 40 | 24 | Basic |
| P49765 | 8.46 | 19 | 16 | Basic |
| P49767 | 7.77 | 49 | 46 | Basic |
| O43915 | 8.16 | 48 | 43 | Basic |
| P17948 | 8.66 | 169 | 151 | Basic |
| P35968 | 5.6 | 145 | 172 | Acidic |
| P35916 | 5.89 | 139 | 163 | Acidic |
3.3. Secondary structure analysis
The secondary structure was predicted for all the proteins using SOPM and SOPMA tools; it shows that all the VEGF human proteins have different secondary structural content. The computed percentage of residues forming α-helices, β-strands and coils are shown in Table 6.
Table 6.Percentage of residues forming alpha, beta, and coil structures
| Accession Number | Alpha Helix | Extended Strand | Beta Turn | Random Coil | Class |
| O14495 | 46.6 | 12.5 | 3.2 | 37.6 | Mixed |
| O14786 | 16.1 | 24.9 | 7.4 | 51.6 | Beta |
| O60462 | 14.5 | 24.0 | 7.3 | 54.2 | Mixed |
| P58294 | 9.5 | 17.1 | 5.7 | 67.6 | Beta |
| P15692 | 29.3 | 15.1 | 3.9 | 51.7 | Alpha |
| P49765 | 28.0 | 10.1 | 5.8 | 56.0 | Alpha |
| P49767 | 33.9 | 7.2 | 4.3 | 54.7 | Alpha |
| O43915 | 30.5 | 9.0 | 3.7 | 56.8 | Mixed |
| P17948 | 21.5 | 23.1 | 4.9 | 50.5 | Mixed |
| P35968 | 22.6 | 23.8 | 6.1 | 47.6 | Mixed |
| P35916 | 22.4 | 23.0 | 5.9 | 48.6 | Mixed |
The SOSUI server classifies the proteins P15692, P49765 and O43915 as soluble proteins and other proteins as transmembrane proteins. The various primary and secondary transmembrane regions identified by SOSUI server were shown in Table 7. The identified transmembrane regions were found to have more hydrophobic residues and it is well documented by the Kyte and Doolittle mean hydrophobicity profile (Fig.1) in which all the peaks are above the zero line. The sequence logo of transmembrane regions (generated from the multiple sequence alignment of transmembrane regions) is shown in Figure 2. The height of each letter in the sequence logo is proportional to the frequency of the amino acid at that position. The presence of more leucine amino acid in the transmembrane region is identified from sequence logo. Generally, the amino acid Leucine has the capacity to stimulate protein synthesis in muscles (Etzel, 2004).
Table 7. Transmembrane regions identified using SOSUI server
| Accession Number | Transmembrane region | Type | Length |
| O14495 | VLLICLDLFCLFMAGLPFLIIET | Primary | 23 |
| NDAVLCAVGIVIAILAIITGEFY | Primary | 23 | |
| IQNPYVAALYKQVGCFLFGCAIS | Secondary | 23 | |
| O14786 | ERGLPLLCAVLALVLAPAGAFRN | Primary | 23 |
| ILITIIAMSALGVLLGAVCGVVL | Primary | 23 | |
| O60462 | ITIIAMSSLGVLLGATCAGLLLY | Primary | 23 |
| MDMFPLTWVFLALYFSRHQ | Secondary | 19 | |
| P58294 | GATRVSIMLLLVTVSDCAVITGA | Primary | 23 |
| RDVQCGAGTCCAISLWLRGLRMC | Secondary | 23 | |
| P15692 | Soluble | ||
| P49765 | Soluble | ||
| P49767 | MHLLGFFSVACSLLAAALLPGP | Primary | 23 |
| O43915 | Soluble | ||
| P17948 | SYWDTGVLLCALLSCLLLTGSSS | Primary | 23 |
| ELITLTCTCVAATLFWLLLTLFI | Primary | 23 | |
| P35968 | IIILVGTAVIAMFFWLLLVIILR | Primary | 23 |
| P35916 | IVILVGTGVIAVFFWVLLLLIFC | Primary | 23 |
| GAALCLRLWLCLGLLDGLVSGYS | Secondary | 23 | |
Figure 1: Kyte and Doolittle mean hydrophobicity profile of all the transmembrane regions.
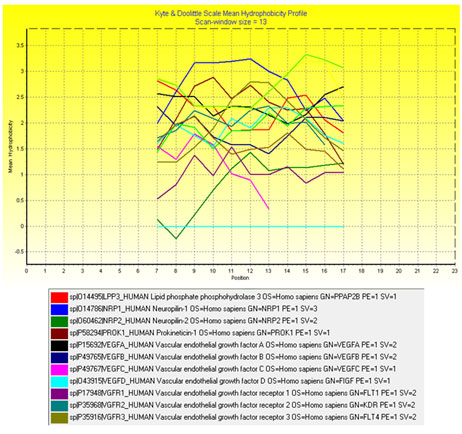
Figure 2: Sequence logo representation of the (generated using the multiple sequence alignment) transmembrane regions.

The Scanprosite server identified different profiles in VEGF proteins except the protein O14495 (Vascular endothelial growth factor and type I collagen-inducible protein [VCIP]), and P58294 (Endocrine-gland-derived VEGF protein). The organization of all the identified profiles is given in table 8.
Table 8.Organization of profiles identified in the VEGF protein sequences

The location of disulfide bridges in all the proteins are screened using CYS_REC tool. VEGF proteins showed cysteine residues (~1-35) and the positions of most probable SS bond patterns are predicted. Disulfide bridges identified only in few proteins, the selection of pairs are skipped due to too large in SS-bound cysteines as shown in table 9. In another method, the cysteines and the SS bond positions are identified in 3D structure of proteins. In case of few proteins no probable SS bond patterns visualized in 3D structure. Though, there are few unpaired cysteines are identified but are not shown (Fig. 3A, B ,C & D). The 3D structures of proteins are validated through Ramachandran plot, ProQ and ProSA, the score were within the acceptable limits (Table 10; Fig. 4 & 5) (Lovell et al., 2002; Cristobal et al., 2001; Wiederstein & Sippl, 2007). The profile of 3D VEGF protein structures match its own sequences with Z scores, it expresses backbone identical to that of the template. This means not only the positions of alpha carbons, but also phi and psi angles with secondary structure are identical to the template.
Table 9. Presence of cysteine residues and disulphide bond patterns predicted by CYS_REC tool and visualized by RasMol in 3D protein structures.
| Accession Number | PDB template | No. of Cysteines | Disulfide bridges CYS REC | RasMol |
| O14495 | 2AKC | 11 | Cys68-Cys162, Cys171-Cys181 | Cys38-Cys43,Cys132-Cys181Cys268-Cys269 |
| O14786 | Too large | 22 | Too large | — |
| O60462 | 2QQJ | 24 | Cys28-Cys277, Cys55-Cys927, Cys149-Cys646,Cys230-Cys883,Cys626-Cys892,Cys655-Cys902, | Cys277-Cys427,Cys434-Cys592 |
| P58294 | 1IMT | 11 | Cys26-Cys38,Cys32-Cys96,Cys37-Cys78,Cys50-Cys86,Cys60-Cys80 | Cys26-Cys38,Cys32-Cys50,Cys37-Cys78,Cys60-Cys86,Cys96-Cys80 |
| P15692 | 3V2A | 18 | Cys52-Cys94,Cys77-Cys172,Cys83-Cys128,Cys86-Cys171,Cys87-Cys130,Cys184-Cys202,Cys187-Cys204,Cys206-Cys225,Cys213-Cys227 | Cys52-Cys94Cys83-Cys128Cys87-Cys130 |
| P49765 | 2VWE | 8 | Cys72-Cys81,Cys78-Cys122,Cys82-Cys124 | Cys47-Cys89Cys82-Cys124Cys78-Cys122 |
| P49767 | Too large | 38 | Too large | — |
| O43915 | Too large | 30 | Too large | — |
| P17948 | Too large | 33 | Too large | — |
| P35968 | Too large | 33 | Too large | — |
| P35916 | Too large | 35 | Too large | — |
Figure 3: Homology modeling-3D structure of VEGF proteins (Ribbon) and Cysteines (SS) bonds (ball and stick) viewed by RasMol tool. A) O60462; B) P58294; C) P15692; D) P49765.
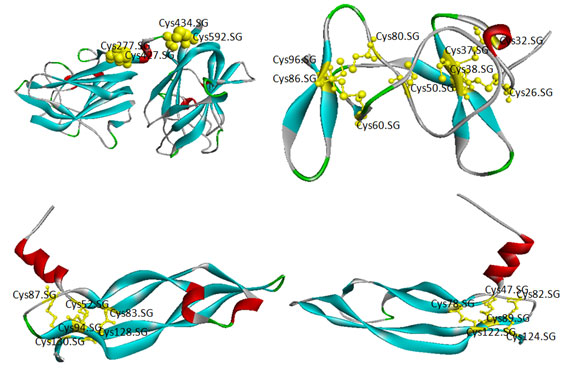
Figure 4: Validation of 3D structure of VEGF proteins- Ramachandran plot. A) O60462; B) P58294; C) P15692; D) P49765.
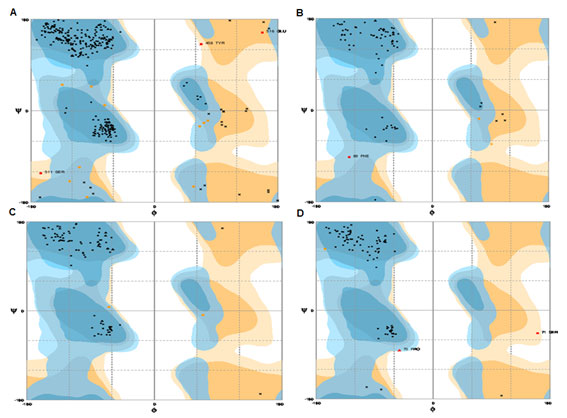
Figure 5: Validation of 3D structure of VEGF proteins-ProQ. A) O60462; B) P58294; C) P15692; D) P49765.
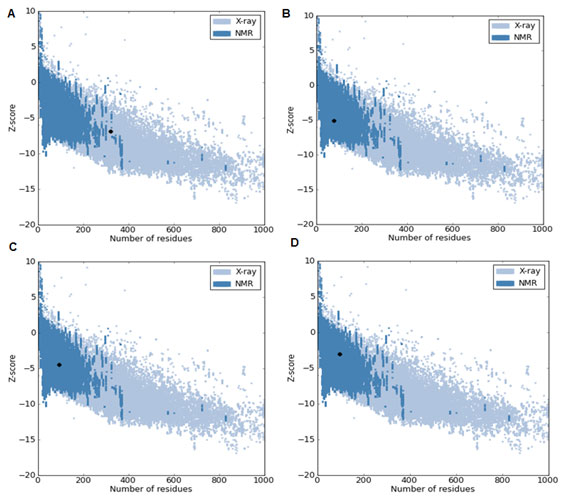
Table 10.Validation of modeled VEGF proteins- Ramachandran Plot, ProQ and ProSA
| Accession Number | Rampage
Residues in Favored region (%) |
ProQ | ProSA
Z Score |
Protein quality | |
| LGscore | Max Sub | ||||
| O14495 | 88 | 0.96 | 0.059 | -1.35 | Fairly good model |
| O60462 | 95.9 | 4.740 | 0.292 | -6.91 | Extremely good model |
| P58294 | 96.1 | 0.968 | 0.119 | -5.08 | Fairly good model |
| P15692 | 97.8 | 1.210 | 0.133 | -4.44 | |
| P49765 | 96.8 | 2.083 | 0.239 | -3 | Very good model |
Prediction of disulfide bonds in these proteins able to show the stability and structure of proteins. It’s a covalent bond between sulfur atoms that binds two peptide chains or different parts of individual peptide chain oxidized to create a stable R-S-S-R bond and is a structural determinant in many of the protein molecules. These are essential to antibodies in creating the cell-surface receptors for target cells, as well as being part of the surface receptors of cells.
CONCLUSION
Sequence-based approaches have proven to be very useful for functional prediction, entire map of protein complexes, architecture of network and their cell signaling factors for known active sites or binding regions. This information would be integrated in various experimental conditions so that overall signaling networks are characterized which gives unique characteristics on targeted protein-drug interactions. Hence, the data and concepts discussed here offer a sense of direction for harnessing the proteomic tools towards protein characterization. Such knowledge may then be channeled to the development of improved targets for biomedicine in the near future. The present work paves the way towards meaningful new areas in which technologies may be further exploited, especially using proteomic tools in order to advance innovate therapies and diagnostics.
REFERENCES
Alitalo, K., & Carmeliet, P., (2002). Molecular mechanisms of lymphangiogenesis in health and disease. Cancer Cell, 1, 219–227.
Anthony Ware, J., & Michael Simons, (1997). Angiogenesis in ischemic heart disease. Nature Medicine, 3(2), 159-164.
Bachmair, A., Finley, D., & Varshavsky, A. (1986). In vivo half-life of a protein is a function of its amino-terminal residue. Science, 234, 179-86.
Ciechanover, A., & Schwartz, A.L. (1989). How are substrates recognized by the ubiquitin-mediated proteolytic system. Trends in Biochemical Sciences, 14, 483-488.
Cristobal, S., Zemla, A., Fischer, D., Rychlewski, L., Elofsson, A. (2001). A study of quality measures for protein threading models. BMC Bioinformatics, 2, 5.
Dvorak, H. F. (2002). Vascular permeability factor/vascular endothelial growth factor: a critical cytokine in tumor angiogenesis and a potential target for diagnosis and therapy. Journal Clinical Oncology, 20, 4368–4380.
Edouard de Castro, Christian J. A. Sigrist, Alexandre Gattiker, Virginie Bulliard, Petra S. Langendijk-Genevaux, Elisabeth Gasteiger, Amos Bairoch, and Nicolas Hulo (2006). ScanProsite: detection of PROSITE signature matches and ProRule-associated functional and structural residues in proteins. Nucleic Acids Research, 34, W362-365.
Eisenhaber, F., Frömmel, C., Argos, P. (1996). Prediction of secondary structural content of proteins from their amino acid composition alone, II The paradox with secondary structural class. Proteins,25,169–179
Falquet, L., Pagni, M., Bucher, P., Hulo, N., Sigrist, C.J., Hofmann, K., Bairoch, A. (2002). The PROSITE database, its status in 2002. Nucleic Acids Research, 30, 235-8.
Futoshi Okada, (2014). Inflammation-Related Carcinogenesis: Current Findings in Epidemiological Trends, Causes and Mechanisms. Yonago Acta Medica, 57(2): 65–72.
Gasteiger, E., Hoogland, C., Gattiker, A., Duvaud, S., Wilkins, M.R., Appel, R.D., Bairoch A. (2005). (In) John M. Walker (ed): The Proteomics Protocols Handbook, Humana Press. 571-607.
Geourjon, C. and Deleage, G. (1994) SOPM: A self-optimised method for protein secondary structure prediction. Protein Engineering, 7, 157-164.
Geourjon, C., & Deleage, G. (1995). SOPMA: significant improvements in protein secondary structure prediction by consensus prediction from multiple alignments. Computer Applications in the Biosciences,11, 6884.
Gill, S.C., & Von Hippel, P.H. (1989). Calculation of protein extinction coefficients from amino acid sequence data. Analytical Biochemistry, 182, 319-26.
Goldmann E. (1907). The growth of malignant disease in man and the lower animals. Lancet, 170, 1236-1240.
Gonda, D.K., Bachmair, A., Wünning, I., Tobias, J.W., Lane, W.S., Varshavsky, A. (1989). Universality and structure of the N-end rule. Journal of Biological Chemistry,264, 16700-12.
Guruprasad, K., Reddy, B.V., Pandit, M.W. (1990). Correlation between stability of a protein and its dipeptide composition: a novel approach for predicting in vivo stability of a protein from its primary sequence. Protein Engineering, 4, 155-61.
Gwang-Mo Yang, Ahmed Abdal Dayem, & Ssang-goo Cho. (2017). Correlation between Oxidative Stress, Nutrition, and Cancer Initiation. International Journal of Molecular Sciences, 18, 1544.
Hall, T.A. (1999). BioEdit: A User-Friendly Biological Sequence Alignment Editor and Analysis Program for Windows 95/98/NT. Nucleic Acids Symposium Series ,41, 95-98.
Hicklin, D. J., & Ellis, L. M. (2005). Role of the vascular endothelial growth factor pathway in tumor growth and angiogenesis. Journal of Clinical Oncology, 23, 1011–1027 .
Hiratsuka, S., Minowa, O., Kuno, J., Noda, T. & Shibuya, M. (1998). Flt-1 lacking the tyrosine kinase domain is sufficient for normal development and angiogenesis in mice. Proceedings of National Academy of Science, 95, 9349–9354.
Ikai, A. (1980). Thermostability and aliphatic index of globular proteins. Journal of Biochemistry, 88, 1895-8.
Kukk, E. et al. (1996). VEGF-C receptor binding and pattern of expression with VEGFR-3 suggests a role in lymphatic vascular development. Development, 122, 3829–3837.
Kyte, J., & Doolittle, R.F. (1982). A simple method for displaying the hydropathic character of a protein. Journal of Molecular Biology, 157, 105-32.
Laakkonen, P. et al. (2007). Vascular endothelial growth factor receptor 3 is involved in tumor angiogenesis and growth. Cancer Research, 67, 593–599.
Lee M. Ellis & Daniel J. Hicklin. (2008). VEGF-targeted therapy: mechanisms of anti-tumour activity. Nature Reviews Cancer, 8, 579-591.
Lipman, D.J., & Pearson, W.R. (1985). Rapid and sensitive protein similarity searches. Science, 227, 1435-41.
Lipman, D.J., Altschul, S.F., & Kececioglu, J.D.(1989). A tool for multiple sequence alignment. Proceedings National Academy of Science USA, 86, 4412-15.
Lovell, S.C., Davis, I.W., Arendall, W.B. 3rd, de Bakker, P.I., Word, J.M., Prisant, M.G., Richardson, J.S., Richardson, D.C. (2002). Structure validation by Calpha geometry: phi,psi and Cbeta deviation. Proteins: Structure, Function & Genetics,50, 437-50.
Penna, J.S., Madanb, A., Caldwellc, R.B., Bartolic, M., Caldwellc, R.W., & Hartnettd, M.E. (2008). Vascular Endothelial Growth Factor in Eye Disease. Prog Retin Eye Research, 27(4), 331–371. doi:10.1016/j.preteyeres.2008.05.001.
Richard P. Hulse. (2017). Role of VEGF-A in chronic pain. Oncotarget, 8(7), 10775-10776.
Rivera, L.B., & Bergers, G. Cancer. (2015). Tumor angiogenesis, from foe to friend. Science, 349,694-695.
Schneider, T.D., & Stephens, R.M. (1990). Sequence logos: a new way to display consensus sequences. Nucleic Acids Research, 18, 6097-100.
Subbroto Kumar Saha, Soo Bin Lee, Jihye Won, Hye Yeon Choi, Kyeongseok Kim,
Takatsugu Hirokawa, Seah Boon-Chieng, Shigeki Mitaku, (1998). SOSUI: classification and secondary structure prediction system for membrane proteins. Bioinformatics Applications Note, 14 (4), 378-379.
Tobias, J.W., Shrader, T.E., Rocap, G., Varshavsky, A. (1991). The N-end rule in bacteria. Science, 254, 1374-7.
Varshavsky, A. (1997). The N-end rule pathway of protein degradation. Genes Cells, 2, 13-28.
Waltenberger, J., Claesson-Welsh, L., Siegbahn, A., Shibuya, M. & Heldin, C. H. (1994). Different signal transduction properties of KDR and Flt1, two receptors for vascular endothelial growth factor. Journal of Biological Chemistry, 269, 26988–26995.
Wiederstein, M., & Sippl, M.J. (2007). ProSA-web: interactive web service for the recognition of errors in three-dimensional structures of proteins. Nucleic Acids Research, 35, W407-10.

