1Indian Council of Agricultural Research-National Bureau of
Agriculturally Important Microorganisms, Mau, India.
2Sunbeam College for Women, Bhagwanpur, Varanasi, India.
Corresponding author email: madhu.pact@gmail.com
Article Publishing History
Received: 10/06/2021
Accepted After Revision: 25/09/2021
The disease causing organisms of aquatic ecosystems negatively affects the aquaculture. The diseases caused by Flavobacterium is a common problem in commercially cultivated/ cultured fish species worldwide. The flavobacteira are common inhabitant of soil, plants and aquatic habitats belongs to phylum bacteroidetes. Comparative genomics studies help in generating valuable information about their diversity, and special adaptations. The present study gives a comparison of the genome of six pathogenic Flavobacterium spp. from different geo-locations using publically available genome data. The possible genomic similarities and distances were predicted using EDGAR. Further, the genome of F. indicum GPTSA100-9 was compared with five other genomes on the basis of genome genome distance (GGD), prediction of dDDH and MCI between the sequenced genomes. Among these six genome, the genome size varied from 2.71 Mb to 3.98 Mb. F. psychrophilum FPG3 has the smallest genome (2.71 Mb) followed by F. indicum (2.99 Mb). The functional annotation and phylogenetic studies based on orthology revealed that 51-60% genes are orthologous whereas, the paralogs ranged between 5 to 15% of the total genes. The DDH, AAI, ANI and POCP results indicate that these species are distinct and different, further on the basis of Pan and Core Genome analysis, 41% genes were recorded to contribute to core genome of Flavobacterium. Analysis of the core genome showed that the number of shared genes decreased with the addition of each new genome. The average gene content in six genomes are 2934 whereas, the core genome was estimated to contain 1210 genes, which is corresponding to the 41 % of the genome and might remain relatively constant. In conclusion, the comparative analysis exhibited that F. indicum GPTSA100-9 is closely related to F. branchiophilum FL-15 and strains from South Korea and China shares same clade and are phylogenetically similar.
Comparative Genomics, Core Genome, GGD, DDH, Flavobacterium
Srivastava R, Srivastava M. Comparative Genomics of Aquatic and Fish Pathogenic Flavobacterium spp. Biosc.Biotech.Res.Comm. 2021;14(3).
Srivastava R, Srivastava M. Comparative Genomics of Aquatic and Fish Pathogenic Flavobacterium spp. Biosc.Biotech.Res.Comm. 2021;14(3). Available from: <a href=”https://bit.ly/3E2d1Bl“>https://bit.ly/3E2d1Bl</a>
Copyright © Srivastava and Srivastava This is an open access article distributed under the terms of the Creative Commons Attribution License (CC-BY) https://creativecommns.org/licenses/by/4.0/, which permits unrestricted use distribution and reproduction in any medium, provide the original author and source are credited.
INTRODUCTION
The genus Flavobacterium is a pigmented, Gram -ve bacteria consisting about 130 species reported from aquatic and terrestrial habitats.Many of the species are reported as fish pathogen including F. psychrophilum, F. columnare, and F. branchiophilum, which can cause severe fish diseases called “cold water disease” (CWD) in freshwater aquaculture with a global distribution. Disease are the main cause of economic losses in aquaculture and constitutes a major constrain for rapid growth and intensification of aquaculture, the new virulent strains/pathogens of cultivated fishes are steadily increasing due to pollution, globalization, and transboundary movement of aquatic fauna it also poses challenge to the workers, vendors and associated researchers (Wahli and Madsen 2018; Silva 2019).
The CWD leads to increased predisposition of other infections and increased mortality. Antibiotics are normally used to control the disease which causes a bi economic burden and also contribute to anti-microbial resistance in bacteria, (Jia et al. 2017; Silva 2019). The major molecular methods used to distinguish between specific bacterial taxa include serotyping, multilocus sequence typing (MLST), pulsed field gel electro- phoresis (PFGE) plasmid profiling, genome restriction enzyme analysis (GREA) etc. (Madsen et al. 2000; Arai et al. 2007; Fujiwara et al. 2013; Castillo et al. 2014; Nilsen et al. 2014; Kumru et al. 2020). However, the unique adaptation towards pathogenic lifestyle, virulence and its evolutionary relationships among different species studied by genome sequencing approaches provides exciting information. Comparative genomic analyses gives insight into variations in the genomic rearrangements, presence of phage sequences, horizontal gene transfer (HGT) and changes in the gene repertory, structural features thus unravels on the evolution in the organisms (Land et al. 2015).
The results of comparative study leads to division of genome in, conserved “core” shared among nearly all members and “accessory” genomic elements which might be present in one or few and absent in other strains (Tettelin et al. 2008). The flexible part of genome might be the results of the acquisition of genetic information specific to the strain and represented by mobile genetic elements, such as plasmids, phage sequences, genomic islands, pathogenicity islands, transposons, IS elements etc (Srivastava et al. 2020). The flexible and mobile genes scattered in the genome (mobilome) provide an additional repertoire of arsenal to the microbes viz: antimicrobial resistance, virulence factors, heavy metal/stress related modifications and toxic compounds. The comparative study among different species of same genera offers the possibility of defining their phylogenetic closeness (Srivastava et al. 2020). However, very little information is available about comparative genomics of Flavobacterium from different geographical regions. Therefore, the present study is focused on comparing the genome of six pathogenic Flavobacterium spp. using publically available genome data, to derive the insights about their similarity, conserved core genomic and pan-genomic elements. The analysis was executed with the genomic datasets available on NCBI and tools like EDGAR, TYGS and GGDC were used in study.
MATERIAL AND METHODS
The whole genome sequence of six species of Flavobacerium viz: F. album HYN0059, F. branchiophilum FL-15, F. columnare Pf1, F. crassostreae LPB0076, F. indicum GPTSA100-9, and F. psychrophilum FPG3 downloaded from microbial genome and microbiome datasets sequenced at Joint Genome Institute (JGI; IMG) (Chen et al.2017). The genome statistics and annotation values were obtained through genome field search for selected genomes with the metadata and Data statistics following the instructions given on the IMG/M server (https://img.jgi.doe.gov/cgi-bin/m/main.cgi).
The possible genomic similarities and distances were predicted using EDGAR was used to predict pan genome of all 6isolates and calculate the accessory (specific genes, present in one) and core genome (common genes, conserved across). The iterative pairwise comparison of a set of genomes was calculated for Pan-genome development (Dieckmann et al. 2021). The genome of F. indicum GPTSA100-9 was compared with five other genomes of Flavobacterium (F. album HYN0059, F. branchiophilum FL-15, F. columnare Pf1, F. crassostreae LPB0076, and F. psychrophilum FPG3) on the basis of genome genome distance (GGD), prediction of dDDH and MCI between the sequenced genomes using the tool GGDC on web server http://ggdc.gbdp.org (Meier-Kolthoff et al. 2014).
The phylogenetic relationship among Flavobacterium isolates based on genomic data was determined using Average Amino acid Identity (AAI), Average Nucleotide Identity (ANI) and Pairwise Percentage of Conserved Proteins (POCP) analysis. The Flavobacterium spp. genome sequence data were retrieved from IMG/M and uploaded to the Type (Strain) Genome Server (TYGS), available under https://tygs.dsmz.de, for a whole genome-based taxonomic analysis (Meier-Kolthoff and Göker 2019). The determination of closely related type strains genome was performed by using two different complementary means.
RESULTS AND DISCUSSION
The assembled genomes of Flavobacterium album HYN0059, F. branchiophilum FL-15, F. columnare Pf1, F. crassostreae LPB0076, F. indicum GPTSA100-9, and F. psychrophilum FPG3 was obtained from the database and used for comparative study. These organisms were originally isolated from; fresh water (F. album), Pelteobagrus fulvidraco (F. columnare), Silurus glanis (F. branchiophilum), Crassostrea gigas (F. crassostreae), hot water spring (F. indicum) from different continents Asia, Europe and North America (Table 1). Among these six genomes, the genome size varied from 2.71 Mb to 3.98Mb. F. psychrophilum FPG3 had the smallest genome (2.71 Mb) followed by F. indicum (2.99 Mb). The assembly statistics revealed that the all the genomes are nearly complete and possess the genes in a range of 2548 to 3715 genes. 92-98% of the sequences represent the coding sequences (CDs). High variability was observed in number and percentage of total RNA count with a variation in tRNA and other RNA (Table 1). This variation in tRNA gene loss and/or gain could be explained by repeat-driven expansion of pseudo-tRNAs and genome assembly artifacts (Rogers et al. 2010). The vast numbers of differences between the selected species were observed. The results are corroboratory to the findings of Kumru et al. (2020).
Table 1. Comparison of genome assembly of different species of Flavobacterium
| Genome Name / Sample Name | Flavobacterium columnare Pf1 | Flavobacterium album HYN0059 | Flavobacterium branchiophilum FL-15 | Flavobacterium crassostreae LPB0076 | Flavobacterium indicum GPTSA100-9 | Flavobacterium psychrophilum FPG3 |
| Host Name/Habitat | Pelteobagrus fulvidraco | Fresh water | Silurus glanis | Crassostrea gigas | Aquatic (hot water string) | Oncorhynchus kisutch |
| Isolation Country | China | South Korea | Hungary | South Korea | India | USA |
| Genome Size | 3171081 | 3983546 | 3563292 | 3027315 | 2993089 | 2715909 |
| Gene Count | 2816 | 3715 | 2925 | 2863 | 2738 | 2548 |
| Scaffold Count | 1 | 1 | 2 | 1 | 1 | 1 |
| GC % | 31.58 | 44.54 | 32.86 | 35.98 | 31.38 | 32.67 |
| CDS Count | 2710 | 3633 | 2872 | 2656 | 2671 | 2349 |
| RNA Count | 106 | 77 | 53 | 207 | 67 | 199 |
| RNA % | 3.76 | 2.07 | 1.81 | 7.23 | 2.45 | 7.81 |
| rRNA Count | 19 | 9 | 9 | 21 | 12 | 18 |
| tRNA Count | 81 | 47 | 44 | 61 | 55 | 49 |
| Other RNA Count | 6 | 21 | 0 | 125 | 0 | 132 |
The functional annotation and phylogenetic studies based on orthology revealed that 51-60% genes were orthologous whereas, the paralogs ranged between 5 to 15% of the total genes. The Pfam database was used to decipher protein families at different domains. Not much variation in number and percentage of proteins were recorded, however, minimum 1874 P fam count was recorded in F. psychrophilum and maximum in 2549 P fam families in F. album. Corresponding to the number of genes 73.55% of the genes in F. psychrophilum represents for protein, whereas, it was only 68.61% in F. psychrophilum, other falls in between (Table 2). The data presented for each entry was based on the UniProt Reference Proteomes related by similarity of sequence, structure or profile following hidden Markov models (HMMs). The KEGG resource for understanding high-level functions and utilities of the biological system gave more or less similar range of function orthologs (KO values). The signal peptides and transmembrane count was much higher in F. album (904 and 655 respectively).
Table 2. Comparative genome analysis of different Flavobacterium species
| Genome Name / Sample Name | Flavobacterium columnare Pf1 | Flavobacterium album HYN0059 | Flavobacterium branchiophilum FL-15 | Flavobacterium crassostreae LPB0076 | Flavobacterium indicum GPTSA100-9 | Flavobacterium psychrophilum FPG3 |
| Paralogs Count | 416 | 559 | 206 | 349 | 143 | 248 |
| Paralogs % | 14.77 | 15.05 | 7.04 | 12.19 | 5.22 | 9.73 |
| COG Count | 1452 | 2284 | 1512 | 1486 | 1460 | 1354 |
| COG % | 51.56 | 61.48 | 51.69 | 51.9 | 53.32 | 53.14 |
| KOG Count | 483 | 0 | 511 | 505 | 465 | 470 |
| KOG % | 17.15 | 0 | 17.47 | 17.64 | 16.98 | 18.45 |
| Enzyme Count | 671 | 702 | 730 | 671 | 651 | 643 |
| Enzyme % | 23.83 | 18.9 | 24.96 | 23.44 | 23.78 | 25.24 |
| Pfam Count | 2043 | 2549 | 2130 | 2029 | 2023 | 1874 |
| Pfam % | 72.55 | 68.61 | 72.82 | 70.87 | 73.89 | 73.55 |
| KEGG Count | 675 | 691 | 722 | 681 | 652 | 639 |
| KEGG % | 23.97 | 18.6 | 24.68 | 23.79 | 23.81 | 25.08 |
| KO Count | 1150 | 1250 | 1190 | 1143 | 1137 | 1065 |
| KO % | 40.84 | 33.65 | 40.68 | 39.92 | 41.53 | 41.8 |
| Signal Peptide Count | 192 | 665 | 297 | 223 | 314 | 235 |
| Signal Peptide % | 6.82 | 17.9 | 10.15 | 7.79 | 11.47 | 9.22 |
| Transmembrane Count | 525 | 804 | 632 | 587 | 594 | 520 |
| Transmembrane % | 18.64 | 21.64 | 21.61 | 20.5 | 21.69 | 20.41 |
The genomes undergo both large-scale and local mutational processes during the course of evolution. Large scale mutations were occurring mainly due to duplication of large segments, gain and loss or generated by unequal recombination events. Whereas, the local mutations include insertion or deletion of nucleotides, nucleotide substitution and affected only a small number of nucleotides. Local evolutionary factors influence individual genes while a large-scale evolutionary process poses direct influence on genomes. Genome wise comparison reveals the similarity and differences among the different organisms (Bernardet et al. 1989; ).
During genome comparison Analysis of cluster of orthologous groups revealed that F. album has significantly higher gene abundance than average level found in other genome sequences under study. A very small fraction of genes (1-09 to 4.75%) contributes to Biosynthetic Gene clusters. BGCs are very important in the process of identifying novel biosynthetic pathways; tens of thousands of biosynthetic gene clusters (BGCs) have been identified in other microbial genomes, most of which encode unknown compounds (Tracanna et al. 2017; Lebedeva et al. 2021). Horizontal gene transfer events to 0.04, 0.1, 2.03, 4.2 and 4.9% were predicted in F. psychrophilum, F. branchiophilum, F. crassostreae, F. album and F. indicum, respectively (Table 3).
Table 3. Comparison of different Flavobacterium species for Horizontal Gene Transfer and Biosynthetic Gene Cluster
| Genome Name / Sample Name | Flavobacterium columnare Pf1 | Flavobacterium album HYN0059 | Flavobacterium branchiophilum FL-15 | Flavobacterium crassostreae LPB0076 | Flavobacterium indicum GPTSA100-9 | Flavobacterium psychrophilum FPG3 |
| Horizontally Transferred Count | 0 | 156 | 3 | 58 | 123 | 1 |
| Horizontally Transferred % | 0 | 4.2 | 0.1 | 2.03 | 4.49 | 0.04 |
| Biosynthetic Cluster Gene Count | 124 | 0 | 32 | 136 | 105 | 79 |
| Biosynthetic Cluster Gene % | 4.4 | 0 | 1.09 | 4.75 | 3.83 | 3.1 |
| Biosynthetic Cluster Count | 4 | 0 | 2 | 5 | 4 | 2 |
Figure 1: Core genome based AAI, POCP and ANI matrix of six Flavobactrium genomes generated with EDGAR 3.0, Pan-genome comparison
using correlation of DDH and GGD values for 5 different Flavobacterium spp. in reference to the F. indicum GPTSA100-9
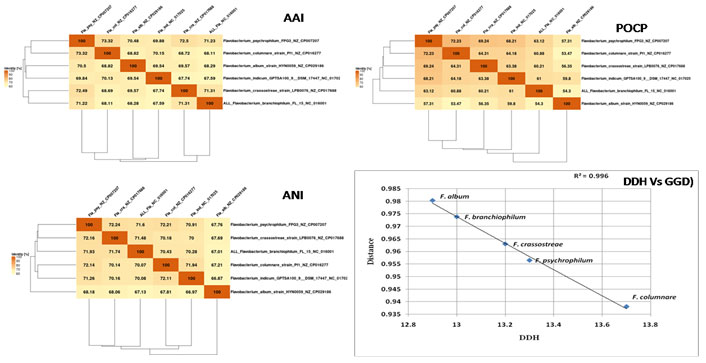
Figure 2: Principal component analysis (PCA) by PAST 2.0, Considering the DDH, GGD and C+G difference
parameters a PCA plot was generated by putting all the values of the compared Flavobacterium spp. into three different components.
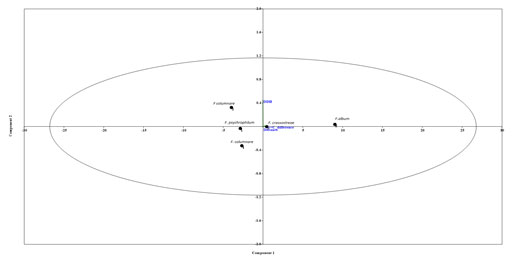
Figure 3: Comparative genome mapping using EDGAR 3.0, the inner circle represents the size of the F. indicum GPTSA100 genome.
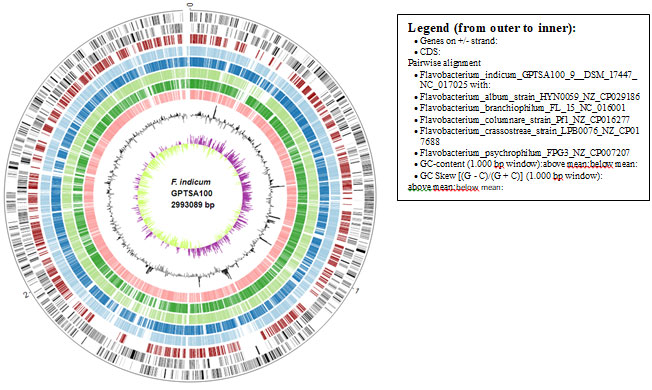
Figure 4: Whole genome sequence based phylogenetic tree analysis using Type (Strain) Genome Server (TYGS). The species clusters represented in different colours
Current innovations in species delineation (ANIb, ANIm, and dDDH, etc.) based on computational algorithms have made dDDH as one of the highly correlative approach to overcome the pitfalls of traditional DDH based bacterial taxonomy (Auch et al. 2010; Meier-Kolthoff et al. 2013; Meier-Kolthoff et al. 2014; Meier-Kolthoff and Göker 2019).
In order to measure the differences between the genome of six Flavobacterium species the Genome-to-Genome distance (GGD) was calculated using GGCD server. Similarly, the DDH estimate (GLM-based), Model confidence interval (Model CI) was also calculated on the basis of HSPs length/total length using formula 1 The comparison on the basis of GGD, DDH (Fig.1) showed the clear distinctness between the species. The DDH for species are less than 14 % DDH, because of this the probability of >= 70 is very low and insignificant. Similarly, the GGD is also more than 0.9. The graph between the GGD and DDH shows the clear difference of these strains (Fig. 4A). In order to further validation of the finding the ANI, AAI and POCP values were also calculated with reference to the F. indicum GPTSA100-9. The matrix for ANI, AAI and POCP is given in Fig. which again confirms the distinctness of the selected species (Fig. 5).
This much high distinctness and the orthology information among these species were also represented in the ring analysis (Fig.3). The outer rings of the circular plot represent the genes of one selected reference genome (F. indicum). The further rings of the circular plot show the core genome as well as the orthologs of each individual genome in comparison to the reference. The phylogenetic tree on the basis of the genomic similarity indicates shows that there are two distinct clades separating Flavobacterium album HYN0059, F. columnare Pf1, F. crassostreae LPB0076, from F. psychrophilum FPG3 F. indicum GPTSA100-9, and F. branchiophilum FL-15. (Fig.4) (Meier-Kolthoff and Göker 2019).
Figure 5: The UpSet plot (A) showing intersection between the sets of genes from various comparisons. The dot plot reports the set participation in the intersection, vertical bar plot reports the intersection size, and the horizontal bar plot reports the set sizes. (B) Venn diagram based on the prediction of orthologous proteins annotated from the pan-genome of the Flavobacterium. Each structure shows in sum the total number of coding sequences of one strain. Intersections indicate predicted shared content
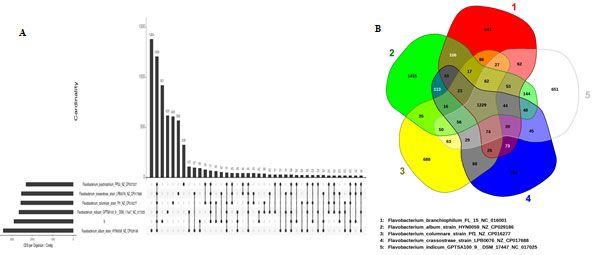
The intersections of five genome datasets are given in Venn diagram (Fig 5B) to represent the genes intersecting within the genome for various sets. Further the new visualization features of the UpSet plots of platform EDGAR 3.0 were used for visual inspection of shared and differential gene content of genome sets (Fig 5A). The matrix layout in Fig5B shows the dark grey circles represent the genomes included in a set, while missing genomes are visualized as light grey circles. The UpSet visualization makes it easy to quickly get insights into the distribution of genes among the set of genomes (Meier-Kolthoff and Göker 2019).
Figure 6: Synteny analysis using EDGAR 3.0, Dot-plot representing whole genome comparison between six Flavobacteriaum sp., the
Dots closest to the diagonal line represent co-linearity between the genomes.
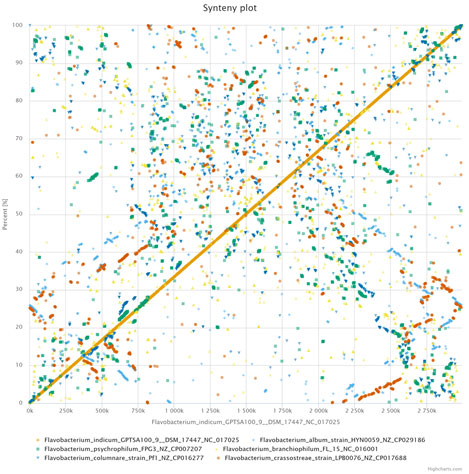
Genome rearrangement and synteny provide evolutionary relationships between genomes. We used EDGAR 3.0 to determine the synteny among six genomes (Fig. 6). Majority of the genome regions were not in the form of syntenic blocks. These findings suggest extreme low level of synteny and divergence, might be because of selective aggregation of genes under evolutionary pressures or incomplete dislocation of gene.
Figure 7: Flavobacterium core and accessory genome evolution analysis (A) Number of shared genes (core genome) as a function of the number of genomes sequentially added. B). Total number of genes (pan-genome) for a given number of genomes sequentially added c. Plot showing Pan verses Core genome, D) Number of unique genes (accessory genome) for a given number of genomes sequentially added.The lower (blue) lines indicate third (75th percentile), upper (green) lines indicate first (25th percentile) of the data and central (red) line refers the sample median (50th percentile) of random input order of the Flavobacterium genomes.
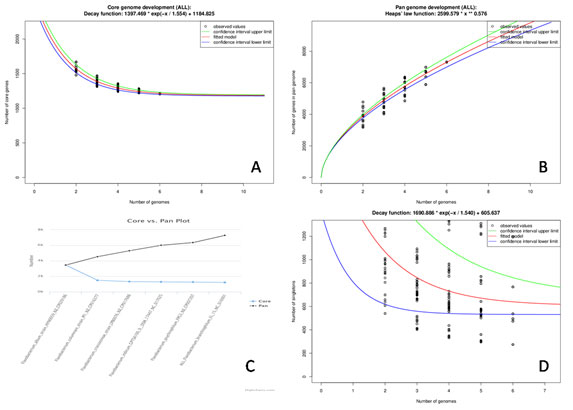
EDGAR platform is one of the most established web servers providing databases of precomputed orthology data for phylogenomics and comparative genomics used for quick identification of the differential gene content, viz: the core and pan genome, or singleton. Examination of the pan-genome indicated that with the addition of new genome the gene repertoire is increased (Castillo et al. 2016). Further as expected, analysis of the core genome showed that the number of shared genes decreased with the addition of each new genome(Fig 7A).
The average gene content is 2934 whereas, the core genome was estimated to contain 1210 genes, which is corresponding to the 41 % of the genome and might remain relatively constant. (Fig 7C) shows the plot Pan verses Core genome, where the number of genes in core is almost stable but increasing in the pan genome with addition of the genomes, the model also predicts 535 singeltons out of which 314 represents for hypothetical proteins. The graphic based on the median value for the accessory genes shows the exponential decay model.
CONCLUSION
The findings of the present study exhibited that Flavobacterium indicum GPTSA100-9is closely related to F. branchiophilum FL-15 on the basis of genome genome distance (GGD) and DDH and also the genome wise phylogeny also confirms that they both are quite closer to each other. Further, the strains from South Korea and China shares same clade and are phylogenetically similar and overall, all the strains having 44% common genepool as core genome.
Conflict of Interest: Authors declare no conflict of interest to disclose.
REFERENCES
Arai, H., Morita, Y., Izumi, S., et al. (2007). Molecular typing by pulsed‐field gel electrophoresis of Flavobacterium psychrophilum isolates derived from Japanese fish. Jourl of fish diseases, 30(6), 345-355.
Auch, A.F., Klenk, H.P., and Göker, M. (2010) Standard operating procedure for calculating genome-to-genome distances based on high-scoring segment pairs. Stand Genomic Sci 2:142-148.
Aziz, R.K., Bartels, D., Best, A., et al. (2008) The RAST Server: Rapid annotations using subsystems technology. BMC Genomics 9:1-15.
Bernardet, J. F., and Kerouault, B. (1989). Phenotypic and genomic studies of Cytophaga psychrophila isolated from diseased rainbow trout (Oncorhynchus mykiss) in France. Applied and Environmental Microbiology, 55(7), 1796-1800.
Castillo, D., Christiansen, R. H., Dalsgaard, I., et al. (2016). Comparative genome analysis provides insights into the pathogenicity of Flavobacterium psychrophilum. PloS one, 11(4), e0152515.
Castillo, D., Christiansen, R. H., Espejo, R., et al. (2014). Diversity and geographical distribution of Flavobacterium psychrophilum isolates and their phages: patterns of susceptibility to phage infection and phage host range. Microbial Ecology, 67(4), 748-757.
Chen, I. A., Markowitz, V. M., Chu, K., et al. (2017). IMG/M: integrated genome and metagenome comparative data analysis system. Nucleic acids research, 45(D1), D507–D516. https://doi.org/10.1093/nar/gkw929
Dieckmann, M. A., Beyvers, S., Nkouamedjo-Fankep, R. C., et al. (2021). EDGAR3. 0: comparative genomics and phylogenomics on a scalable infrastructure. Nucleic Acids Research 2;49(W1):W185-W192
Frazer, K.A., Elnitski, L., Church, D.M., et al. (2003) Cross-species sequence comparisons: a review of methods and available resources. Genome Res 13: 1-12.
Fujiwara-Nagata, E., Chantry-Darmon, C., Bernardet, J. F., et al. (2013). Population structure of the fish pathogen Flavobacterium psychrophilum at whole-country and model river levels in Japan. Veterinary research, 44(1), 1-9.
Guérin, C., Lee, B.H., Fradet, B. et al. (2021). Transcriptome architecture and regulation at environmental transitions in flavobacteria: the case of an important fish pathogen. ISME Commun. 1: 33. https://doi.org/10.1038/s43705-021-00029-9.
Jia, S. , Zhang X.X., Miao, Y. et. al (2017) Fate of antibiotic resistance genes and their associations with bacterial community in livestock breeding wastewater and its receiving river water, Water Res. 124 :259–268.
Kasana, R.C. and Pandey, C.B. (2018) Exiguobacterium: an overview of a versatile genus with potential in industry and agriculture. Crit Rev Biotechnol 38: 141-156.
Kumru, S., Tekedar, H. C., Blom, J., et al. (2020). Genomic diversity in flavobacterial pathogens of aquatic origin. Microbial Pathogenesis,42: 104053.
Land, M., Hauser, L., Jun, S. R., et al. (2015). Insights from 20 years of bacterial genome sequencing. Functional & integrative genomics, 15(2), 141-161.
Lebedeva, J., Jukneviciute, G., Čepaitė, R, et al. (2021) Genome Mining and Characterization of Biosynthetic Gene Clusters in Two Cave Strains of Paenibacillus sp. Front. Microbiol. 11:612483.
Madsen L, and Dalsgaard I. (2000) Comparative studies of Danish Flavobacterium psychrophilum isolates: ribo- types, plasmid profiles, serotypes and virulence. J Fish Dis. 23:211–218.
Meier-Kolthoff, J.P. and Göker, M. (2019) TYGS is an automated high-throughput platform for state-of-the-art genome-based taxonomy. Nat Commun 10: 1-10.
Meier-Kolthoff, J.P., Auch, A.F., Klenk, H.P., et al. (2013) Genome sequence-based species delimitation with confidence intervals and improved distance functions. BMC Bioinformatics 14: 60.
Meier-Kolthoff, J.P., Klenk, H.P., and Göker, M. (2014) Taxonomic use of DNA G+C content and DNA-DNA hybridization in the genomic age. Int J Syst Evol Microbiol 9: 2.
Nilsen, H., Sundell, K., Duchaud, E., et al. (2014). Multilocus sequence typing identifies epidemic clones of Flavobacterium psychrophilum in Nordic countries. Applied and environmental microbiology, 80(9), 2728-2736.
Rogers, H.H., Bergman, C.M., and Griffiths-Jones, S. (2010) The evolution of tRNA genes in Drosophila. Genome Biol Evol 2:467-477.
Silva, R.M.O., Evenhuis, J.P., Vallejo, R.L., et al. (2019). Variance and covariance estimates for resistance to bacterial cold-water disease and columnaris disease in two rainbow trout breeding populations. J Anim Sci 97:1124–1132.
Srivastava, A. K., Srivastava, R., Sharma, A., et al. (2020). Pan-genome analysis of Exiguobacterium reveals species delineation and genomic similarity with Exiguobacterium profundum PHM 11. Environmental Microbiology Reports, 12(6), 639-650.
Tettelin, H., Riley, D., Cattuto, C., et al. (2008). Comparative genomics: the bacterial pan-genome. Current opinion in microbiology, 11(5), 472-477.
Tracanna, V., De Jong, A., Medema, M. H et al. (2017). Mining prokaryotes for antimicrobial compounds: from diversity to function. FEMS Microbiol. Rev. 41, 417–429
Wahli, T, and Madsen L. (2018) Flavobacteria, a never-ending threat for fish: a review. Curr.Clin. Microbiol. Rep. 5: 26–37.
Wang, Y., Coleman-Derr, D., Chen, G., et al. (2015) OrthoVenn: A web server for genome wide comparison and annotation of orthologous clusters across multiple species. Nucleic Acids Res 43: 78-84.

