Department of Computer Applications, Maulana Azad National Institute of Technology Bhopal, India-462003
Article Publishing History
Received: 11/08/2016
Accepted After Revision: 15/09/2016
Cancer can be cured if detected early and it can be detected by the expression level analyzed in the suspected tissues. Serial Analysis of Gene Expression (SAGE) is a gene expression technique used to analyze the genes on the basis of expression level of the genes. The Libraries of SAGE data contained very large number of genes, considering all genes for classifying is very tedious task and is not wise thing to do. The preprocessing of the SAGE data is performed to remove the irrelevant genes by comparing the expression level of genes in normal and cancerous libraries, and the further analysis of the dataset is done considering the reduced genes. This paper compares classification techniques for classifying the cancerous and non-cancerous tissues of human brain. The Naive Bayes (NB), Linear Discriminant Analyzer (LDA), Decision Table (DT), Support Vectors Machine (SVM) and K Nearest Neighbor (KNN) classifiers have been implemented for the analysis of SAGE data. WEKA (The Waikato Environment for Knowledge Analysis) open source software which consists of a collection of machine learning algorithms for data mining used for analysis. The results obtained reveal that the K-Nearest Neighbor (KNN) and Linear Discriminant Analyzer (LDA) have given better performance over other classifies in most of the performance measures except few. Different errors measures have also been studied in this paper for SAGE data of human brain tissues. The KNN and LDA both have given significant improvement over other classifiers.
Classification, Sage, Dimensional, Error, Performance
Lalotra G. S, Thakur R. S. Classification of Cancerous and Non-Cancerous Tissues of Serial Analysis of Gene Expression Data Through Various Classifiers. Biosc.Biotech.Res.Comm. 2016;9(3).
Lalotra G. S, Thakur R. S. Classification of Cancerous and Non-Cancerous Tissues of Serial Analysis of Gene Expression Data Through Various Classifiers. Biosc.Biotech.Res.Comm. 2016;9(3). Available from: https://bit.ly/2oZstNa
Introduction
Machine learning is the process of learning structure from data, there are various machine learning techniques being implemented to learn from the data. Classification is a data mining technique used to predict group membership for data instances from instances described by a set of attributes and a class label data mining remains the hope for revealing patterns that underlie it (Witten et al., 2011; Li et al., 2016 and Kumar et al., 2016).
There are some basic techniques for data mining like classification, clustering, association rule mining (Pizzuti et al., 2003; Marr, 1981; Wong et al., 2008). Various state of the art classification techniques like Naïve Bayes (Becker et al., 2001), LDA (Quinlan, 1993), SVM (Cortes et al., 1995; Burges et al., 1998; Han et al. 2012; Cunningham et al. 2007), KNN (Han et al. 2012) and Decision Table (DT) has been used for analysis of data.
 |
Figure 1 |
 |
Figure 2 |
 |
Figure 3 |
 |
Figure 4 |
 |
Figure 5 |
 |
Figure 6 |
 |
Figure 7 |
 |
Figure 8 |
 |
Figure 9 |
 |
Figure 10 |
This paper focuses on the study of the SAGE data of human brain tissues, which is based on the gene expression techniques for analysis of genes. SAGE data sets were collected from SAGE libraries from http://www.ncbi.nlm.nih.gov/projects/SAGEThe classification data were classified into one of the predefined classes and hence from the machine learning perspective it is a supervised learning technique. The Gene expression data is an example of presenting a large number of features (genes), most of the features are irrelevant to the definition of the problem which consequently could degrade the classification process significantly while performing analysis (Banka et al. 2015). This paper primarily focuses on experimentally evaluating different methods for classifying cancerous and non- cancerous tissues.
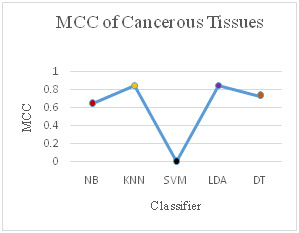 |
Figure 11 |
 |
Figure 12 |
 |
Figure 13 |
 |
Figure 14 |
 |
Figure 15 |
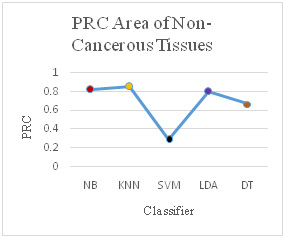 |
Figure 16 |
Dataset Preparation
Dataset contains 10 Cancerous and 4 normal libraries, these datasets are represented in the form of Table 1 containing tag and frequency. These libraries in the form Tag, frequency1, frequency2, frequency3, frequency14 were combined.
| Table 1: Sample SAGE data output | |||||
| Tag | CCAAAACCCA | ACAAGATTCC | ACCAATTCTA | GCCCTCTGAA | ACCCTAGGAG |
| Frequency | 27 | 8 | 56 | 90 | 389 |
Algorithm For Preprocessing
Step 1: The maximum frequency (maxf) and minimum frequency (minf) of each gene in the normal libraries was calculated.
Step 2: The frequency of each gene was compared in the cancerous libraries with the maximum and the minimum frequency of normal libraries.
Step 3: Let aij is the frequency of gene j in library i.
- If (aij > maxf) or (aij < minf)
- Change frequency value to 1
- And 0 otherwise
Step 4: 1 shows the differently expressed genes in the tumor tissue and 0 means no change in the expression level.
Step 5: Records corresponds to ambiguous tags (genes which show over expression in some cancer tissues and under expression in some other cancer tissues) are removed.
The above steps were used for preprocessing on dataset matrix (14×65454) and have been reduced into matrix size (14×1898).
Results And Discussion
The comparison was conducted using the WEKA (The Waikato Environment for Knowledge Analysis) open source software which consists of a collection of machine learning algorithms for data mining. Different classifiers used for evaluation of the cancerous and non- cancerous tissues are discussed below in Table 2. The Performance of the Classifier is discussed in Table 3.
| Table 2: Classifiers and their principle | |||
| S. No | Name of Classifier | Year | Principle of Classifier |
| 1 | Naive Bayes | Classifiers are in use since 1950 | Bayesian theorem, it is used when the data is high dimensional. |
| 2 | KNN | M. Cover and P. E. Hart in 1967 | Closest neighbor whose class is already known. |
| 3 | SVM | SVM was introduced by Vapnik in 1995 (Wong et al., 2008). | SVM is based on statistical learning theory and structural risk minimization principal with the aim of determining location of decision boundaries also known as hyperplane. |
| 4 | LDA | LDA was introduced by Fishers in 1936. | Compute the d-dimensional mean vectors for the different classes from the dataset, calculate the scatter matrices. Calculate the eigenvectors (e1, e2,…,ed) and corresponding eigenvalues (ë1,ë2,…,ëd) for the scatter matrices. Sort the eigenvectors by decreasing eigenvalues and choose k eigenvectors with the largest eigenvalues to form a d×k dimensional matrix W (where every column represents an eigenvector). Use this d×k eigenvector matrix to transform the samples onto the new subspace. This can be summarized by the matrix multiplication: Y=X×W. |
| 5 | DT | Decision tables were introduced during 1960-70. | one of the earliest classification models to be represented graphically because of their easy to understand structure (Quinlan, 1993). It is rule based classifier, where Table represents complete set of conditional expressions, expressions are mutually exclusive in in a predefined area. |
It has been observed that the different classification measures have been calculated and compared for cancerous and non-cancerous tissues of human brain. The measures like True Positive (TP) rate, False Positive (FP) rate, Precision, Recall, F-Measure, Mathews Correlation Coefficient (MCC), Receiver Operating Characteristic (ROC) Area and Precision Recall Curve (PRC) Area have been used. The all classifiers have performed well after reducing the number of genes from 65454 to 1898 and the analysis is performed on the 1898 genes which is a significant improvement in reducing the number of features but, it can be revealed from the results that the K-Nearest Neighbor (KNN) and Linear Discriminant Analyzer (LDA) have outperformed the other classifies in most of the performance measures.
Discriminant analyzer technique by (Li et al. 2016) has been proposed to enhance the classification accuracy. Nearest neighbor classifier requires large memory and time (Kumar et al. 2016) but, with our algorithm for preprocessing the dataset has significantly reduced for analysis purpose. A variant of LDA is introduced by (Bacchus et al. 2013) where LDA has performed better than SVM and KNN.
With the help of preprocessing algorithm, we have achieved very good results for SAGE dataset as show in Table 3. The error measures in Figure 17, Figure 18, Figure 19 and Figure 20 Show the different error measure Mean Absolute Error (MAE), Root Means Square Error (RMSE), Relative Absolute Error (RAE) and Root Relative Square Error (RRSE). These measures also show that LDA and KNN have performed very well and the error are less in comparison to other classifiers used.
| Table 3: Classifiers and their performances | ||
| S. No | Name of Classifier | Performance of Classifier |
| 1. | Naive Bayes | For our dataset it has Correctly Classified 12 instances that is the 85.7143 % and 2 instance are incorrectly classified which is 14.2857 % |
| 2. | KNN | For our dataset it has correctly classified instances are 13 which is 92.8571 % and the incorrectly classified instances 1 that is 7.1429 % |
| 3. | SVM | SVM classified correctly 10 instance which is 71.4286 % of the total and the remaining 28.5714 % are incorrectly Classified Instances. |
| 4. | LDA | Correctly classified instances are13 which is 92.8571 % and incorrectly classified instance is 1 that is 7.1429 %. By LDA. |
| 5 | DT | In our experiment 12 instances are correctly classified which is 85.7143 % and 2 instances are incorrectly classified which accounts for 14.2857 % by DT. |
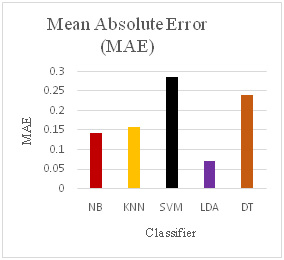 |
Figure 17 |
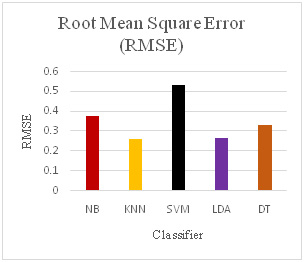 |
Figure 18 |
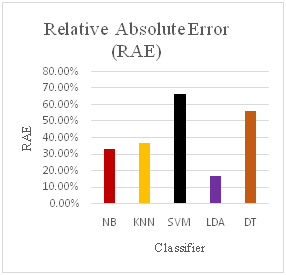 |
Figure 19 |
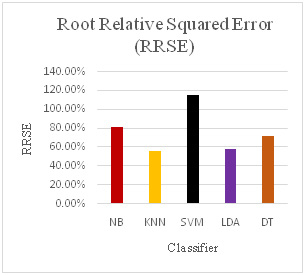 |
Figure 20 |
Comparison of Different Performance measures for Tumorous Tissues and Non-Tumorous Brain Tissues
Error Measures for various Classifiers
Conclusion
SAGE data has been preprocessed and thereby reducing the number of features to 1898, samples are classified and their performance is compared. The classifiers employed here have used statistical approaches and focused on individual features. Future work can be enhanced to the study of features in the groups. Implementing the association rule mining techniques along with soft fuzzy techniques can be of great significance for the reduction in the number of features and performance enhancement can be achieved.
Acknowledgement
This work was supported by research grant from MANIT, Bhopal, India under Grants in Aid Scheme 2010-11, No. Dean (R&C)/2010/63 dated 31/08/2010.
References
Bacchus A, Biet M, Macaire L, Menach Y L and Tounzi A (2013). Comparison of Supervised Classification Algorithms Combined with Feature Extraction and Selection: Application to a Turbo-generator Rotor Fault Detection, 9th IEEE International Symposium on Diagnostics for Electric Machines, Power Electronics and Drives (SDEMPED). 558-565.
Banka H, Dara S (2015). A Hamming distance based binary particle swarm optimization (HDBPSO) algorithm for high dimensional feature selection, classification and validation. Pattern Recognition Letters. Vol 52, 94–100.
Becker B, Kohavi R, Sommerfield D (2001). Visualizing the simple Baysian classifier, in: Information Visualization in Data Mining and Knowledge Discovery. Inc. San Francisco, CA, USA, Morgan Kaufmann Publishers. 237-249.
Burges C. J.C. (1998). A Tutorial on Support Vector Machines for Pattern Recognition. Data Mining and Knowledge Discovery 2, 121-167.
Cortes C, Vapnik V (1995). Support vector networks. Machine Learning, Boston, Kluwer Academic Publishers. Vol 20, 273–297.
Cunningham P, Delany S. J (2007) k-Nearest Neighbour Classifiers Technical Report UCD-CSI.
Han J, Kamber M (2012). Data Mining Concepts and Techniques. Elsevier.
Kumar R.R, Viswanath P, Bindu C.S (2016). Nearest Neighbor Classifiers: Reducing the Computational Demands, 6th IEEE International Conference on Advanced Computing. 45-50.
Li L, Du L, Zhang W, Hen H, Wang P (2016). Enhancing information discriminant analysis: Feature extraction with linear statistical model and information-theoretic criteria, Pattern Recognition Vol. 60,554–570.
Marr J.D (1981). Comparison of several clustering algorithms for data rate compression of LPC parameters. IEEE International Conference on Acoustics, Speech, and Signal Processing ICASSP’81. Vol 6, 964-966.
Pizzuti C, Talia D (2003). P-AutoClass: scalable parallel clustering for mining large data sets IEEE Transactions on Knowledge and Data Engineering. Vol 15, Issue 03, 629-641.
Quinlan J.R (1993). C4.5: Programs For Machine Learning, Morgan Kaufmann Publishers, Inc.
Witten I.H, Frank E, Hall M.A (2011). Data mining practical machine learning tools and techniques, Morgan Kaufmann publisher, Burlington.
Wong A.K.C, Li G.C.L (2008). Simultaneous pattern and data clustering for pattern cluster analysis. IEEE Transactions on Knowledge and Data Engineering. Vol 20, Issue 07, 911-923.

