1Department of Biology, Faculty of Science, Taif University, Taif, Saudi Arabia.
2Biological Science Department, Faculty of Sciences, King Abdulaziz University, KSA.
3Department of Cell Biology, National Research Centre, Dokki, Giza, Egypt.
4Department of Animal Reproduction and AI, National Research Centre, Dokki, Giza, Egypt.
5Department of Genetics, Faculty of Agriculture, Menoufia University, Sheben El-Kom, Egypt.
6Najla Bint Saud Al Saud Center for excellent Research in Biotechnology, Jeddah, Saudi Arabi.
Corresponding author email: saboaba@kau.edu.sa
Article Publishing History
Received: 24/09/2021
Accepted After Revision: 28/12/2021
The current study is the first comprehensive investigation to address the native chicken ecotypes of the Taif region to unravel the genetic diversity using a dense panel of 40 microsatellites (SSR). Blood samples were collected from 25 hens randomly sampled from a village farm at Taif governorate. A total of 147 alleles were detected, with an average of 3.7 alleles per locus. The overall mean of polymorphic information content (PIC) was 0.43. The average observed heterozygosity (Hobs) of 0.28 was lower than the expected heterozygosity (Hexp) of 0.48. Out of 40l ocionly11 loci showed insignificant deviation from Hardy Weinberg expectation.
The ecotypes showed low genetic diversity (HS = 0.65) and a high level of inbreeding (FIS= 0.75). The high FIS is indicative of the endangerment potentiality of this ecotype. Nine SSR showed an inbreeding coefficient of one. The significant estimate of the inbreeding coefficient of the present study calls for an immediate breeding plan to preserve such endangered ecotypes. Results of the present study will provide an initial guide to design further investigations for the development of sustainable genetic improvement and conservation programs for the Taif ecotype genetic resources.
Ecotype, Chicken, Microsatellites, Diversity, Heterozygosity
Sabry A, Mohamed A. A, Hassen M. M, Ismail M, Aba S. E. M. A. Characterization and Genetic Diversity of Taif Cken Ecotype Using Dense Microsatellites Panel. Biosc.Biotech.Res.Comm. 2021;14(4).
Sabry A, Mohamed A.A, Hassen M.M, Ismail M, Aba S.E.M.A. Characterization and Genetic Diversity of Taif Cken Ecotype Using
Dense Microsatellites Panel. Biosc.Biotech.Res.Comm. 2021;14(4). Available from: <a href=”https://bit.ly/3IWG2Rg“>https://bit.ly/3IWG2Rg</a>
Copyright © Sabry et al., This is an open access article distributed under the terms of the Creative Commons Attribution License (CC-BY) https://creativecommns.org/licenses/by/4.0/, which permits unrestricted use distribution and reproduction in any medium, provide the original author and source are credited.
INTRODUCTION
The importance of chicken ecotypes is not only limited to the rural economy and smallholder livelihood but also important in the maintenance and conservation of genetic sources. These ecotypes have been locally adapted for decades. Raising local ecotype/breed, in other words indigenous, is preferred because of their small cost of production and their adaptability to harsh environmental conditions. Also, it has special significance particularly in remote areas where they consider as a source of revenue for underprivileged families. The adaptive privilege they gained over time allowed them to survive harsh local conditions including scarcity of water and food, and disease epidemics (Muchadeyi et al., 2007, Nxumalo, 2020, Habimana et al., 2020).
Ecotypes represent a valuable genetic resource as they have been used as a framework in diversity studies. Although many definitions are proposed for ecotypes, however, the most common description of ecotypes is the exclusive population that adapted to their local environment and represents a reservoir for genes affecting productive adaptability. For instance, native chicken in Saudi Arabia carries different heat tolerance genes which are crucial in hot climate zones and has the potential in breeding programs. Almost a quarter of local chicken breed populations are globally classified as endangered, hence their genotypes could be lost (Morrison, 2012, Strillacci et al., 2017, Radwan, 2020).
Preservation of these genetic resources comprises a comprehensive knowledge of activities related to the identification, and documentation of native breeds. The importance of ecotypes as evolutionary conservation objectives emerges from their ability to exhibit phenotypic differences in relation to environmental heterogeneity. Many studies have investigated ecotypes in village chicken populations. Indigenous chicken at Taif governorate (1700 m above sea level) are well adapted to the harsh environmental conditions of high altitudes (Muchadeyi et al., 2007, Rudresh et al., 2015, Abdel-Hameed and Bazaid, 2017).
Elevation above sea level is generally known for extreme environmental conditions, including low oxygen content, reduced partial pressure of oxygen, and temperature fluctuations. The genetic makeup of Taif ecotypes is understudied with very limited information available on its adaptability. Advances in molecular markers applications have given a reliable opportunity to evaluate genetic variation at the DNA level. One of the most widely used genetic markers for genetic diversity investigations is microsatellites (SSR). Microsatellites are commonly utilized in genetic diversity assessment since they are codominant, highly polymorphic, abundant, and highly reproducible (Groen et al.1994, Hillel et al., 2003, Huang et al., 2016; Nxumalo et al., 2020).
Such efficiency has made SSR markers the most common genetic markers for the assessment and characterization of genetic diversity in many commercial and indigenous chicken populations. Numerous SSR markers are accessible in chickens and have been used to construct linkage maps in many populations. The current study is the first to use a dense panel of microsatellites to assess Taif chicken ecotypes genetic diversity in an attempt to highlight the possible effects of inbreeding (Groen et al., 1994, Nones et al., 2005, Seo et al. 2013, Abebe et al., 2015, Nxumalo et al. 2020).
MATERIAL AND METHODS
A total of 25 hens were randomly sampled for DNA extraction during January 2021 from a village chicken farm in Taif (21.28 °N, 40.42 °E), Saudi Arabia, representing the Taif chicken ecotype. Blood samples were collected from hens and prepared for DNA extraction using the procedure described in Hoelzel (1992). Genomic DNA was extracted from the whole blood using a DNA extraction kit (QIAGEN, USA). DNA quality was checked using electrophoresis and further determined using NanoDrop 2000C spectrophotometer (Spectronic Genesys, Thermo Electron Corporation). DNA samples were stored at -20°C until microsatellites genotyping.
Microsatellite selection and genotyping: A total of 40 microsatellite markers were used for sample genotyping (Table 1). These markers were chosen according to the recommendation by Choi et al. (2015), details of SSR markers are provided in Table1. Polymerase chain reaction (PCR) was carried out according to Seo et al. (2013) and Ibrahim et al. (2015) in a final volume of 25 μL containing 1μL (20 ng) of genomic DNA, 12.5μL of Go Taq® Green Master Mix, Promega, USA, 1μLof each primer (20 pM), deionized distilled water (to a total volume of 25 μL). The PCR reactions were performed in C1000TM Thermo Cycler Bio-Rad, Germany, using the following conditions; initial denaturation at 94°C for 5 min; 40 cycles of denaturation at 94°C for 30 sec., primer annealing at 52°C for 45sec and primer extension at 72°C for 1 min; final extension at 72°C for 7 min.
To confirm successful amplification, PCR products were separated on 2% agarose/TBE gel and visualized on UV Transilluminator. To determine allele sizes, the genotyping mixture was carried out as follows; 1µL of diluted PCR products, 10 µL of Hi-DiTM Formamide (Applied Biosystems, USA), and 0.1 µL of GeneScanTM-500 LIZ TM size standard marker (Applied Biosystems, USA). Genotyping reaction mixture was denatured for 2min at 95 °C and fragment analysis was performed using capillary array using Genetic analyzer 3130xl (Applied Biosystems, USA). GeneMapper ver.3.7 (Applied Biosystems, USA) was used for allele size estimation.
Table 1. Marker name, chromosome number (Chrom.), and allele size (bp) of 40 SSR markers used in Taif ecotypes genotyping.
| Marker | Chrom. | Allele size | Marker | Chrom. | Allele size |
| MCW0248 | 1 | 205-225 | MCW0029 | 5 | 139-189 |
| LEI0141 | 2 | 220-242 | MCW0014 | 6 | 164-182 |
| MCW0087 | 2 | 267-283 | MCW0183 | 7 | 296-326 |
| MCW0063 | 2 | 132-150 | ROS0019 | 7 | 119-143 |
| LEI0234 | 2 | 217-315 | ADL0278 | 8 | 114-126 |
| MCW0206 | 2 | 226-240 | GCT0016 | 9 | 108-154 |
| MCW0288 | 2 | 108-122 | ADL0259 | 9 | 106-146 |
| MCW0264 | 2 | 224-240 | MCW0067 | 10 | 175-184 |
| MCW0127 | 3 | 227-241 | MCW0228 | 10 | 221-239 |
| MCW0016 | 3 | 134-146 | MCW0216 | 13 | 139-149 |
| MCW0037 | 3 | 152-156 | MCW0104 | 13 | 189-225 |
| MCW222 | 3 | 221-225 | MCW0213 | 13 | 288-316 |
| LEI0166 | 3 | 354-370 | MCW0123 | 14 | 79-89 |
| MCW098 | 4 | 261-265 | ADL0293 | 17 | 105-119 |
| LEI0094 | 4 | 254-280 | MCW0330 | 17 | 254-286 |
| ADL0317 | 4 | 178-204 | ADL0304 | 18 | 137-159 |
| MCW0295 | 4 | 88 -106 | MCW0165 | 23 | 114-118 |
| ROS0013 | 5 | 220-242 | LEIOO74 | 26 | 224-240 |
| MCW0078 | 5 | 135-147 | MCW0069 | 26 | 158-176 |
| ADL0292 | 5 | 110-138 | LEI0135 | 28 | 131-142 |
Genetic diversity analysis: Microsatellite diversity for Taif ecotype was estimated using observed (Hobs) and expected (Hexp) heterozygosity (Nei, 1987), the fixation index FIS was also calculated. The informativeness of each marker was assessed based on polymorphic information content (PIC), (Botstein et al. 1980). All loci were tested for deviations from the Hardy-Weinberg equilibrium (HWE). Exploratory data analysis and graphical representations of the results were carried out under R statistical environment, R Core Team (2019). Genetic diversity and population genetics parameters were estimated using the adegenet package (Jombart 2008).
RESULTS AND DISCUSSION
To assess the genetic diversity of the studied ecotype, different genetic diversity estimates were obtained including the number of alleles per locus, polymorphic information content (PIC), and observed (Hobs) and expected (Hexp) heterozygosity (Table 2). A total of 147 alleles were identified across 40 loci. The number of alleles per locus varied among loci between one and eight with an average of 3.7 allele/locus. The lowest number of alleles per locus was attributed to MCW098 with one allele, while ADL259 had the maximum number of alleles/locus of eight. The monomorphic pattern observed for MCW098 might be associated with the low sample size and/or the presence of null alleles (Choi et al., 2015).
The average number of allele/locus in the current study was lower than its native chicken counterpart reported in South Africa, Zimbabwe, Egypt, and Sweden. The polymorphic information content (PIC) is a common index to infer the allelic polymorphism. PIC ranged between 0.0 and 0.8 with an average of 0.43 (Table 2). Most of the studied loci (45 %) were highly informative (PIC> 0.50), while 32.5 % were reasonably informative (0.5 >PIC > 0.25), and only 22.5 % were slightly informative (PIC< 0.50). The relatively low PIC of the studied markers might be associated with the lower number of alleles per locus where 58% of the studied markers, 23 out of 40 markers, had a maximum of three alleles (Van-Marle-Koster and Nel, 2000, Muchadeyi et al., 2007, Ramadan et al. 2012, Abebe et al., 2015).
Table 2. Number of alleles (N) polymorphic information content (PIC), observed heterozygosity (Hobs),
and expected heterozygosity (Hexp) for 40 microsatellite markers used in Taif ecotypes genotyping.
| Marker | N | PIC | Hobs | Hexp | Marker | N | PIC | Hobs | Hexp |
| MCW248 | 2 | 0.14 | 0.00 | 0.15 | MCW029 | 7 | 0.67 | 0.52 | 0.71 |
| LEI141 | 3 | 0.57 | 0.44 | 0.65 | MCW014 | 5 | 0.25 | 0.12 | 0.26 |
| MCW087 | 3 | 0.56 | 0.24 | 0.64 | MCW183 | 2 | 0.19 | 0.16 | 0.21 |
| MCW063 | 3 | 0.50 | 0.44 | 0.57 | R0S019 | 7 | 0.69 | 0.56 | 0.74 |
| LEI234 | 4 | 0.52 | 0.20 | 0.56 | ADL278 | 2 | 0.33 | 0.20 | 0.42 |
| MCW206 | 3 | 0.40 | 0.60 | 0.46 | GCT016 | 5 | 0.58 | 0.00 | 0.63 |
| MCW288 | 2 | 0.19 | 0.00 | 0.21 | ADL259 | 8 | 0.80 | 0.36 | 0.82 |
| MCW264 | 3 | 0.59 | 0.60 | 0.66 | MCW067 | 2 | 0.32 | 0.00 | 0.40 |
| MCW127 | 2 | 0.19 | 0.16 | 0.21 | MCW228 | 5 | 0.61 | 0.36 | 0.67 |
| MCW016 | 4 | 0.55 | 0.64 | 0.62 | MCW216 | 2 | 0.07 | 0.08 | 0.08 |
| MCW037 | 7 | 0.71 | 0.60 | 0.75 | MCW104 | 4 | 0.45 | 0.36 | 0.48 |
| MCW222 | 2 | 0.36 | 0.00 | 0.48 | MCW213 | 5 | 0.58 | 0.20 | 0.61 |
| LE1166 | 3 | 0.34 | 0.52 | 0.41 | MCW123 | 5 | 0.22 | 0.12 | 0.22 |
| MCW098 | 1 | 0.00 | 0.00 | 0.00 | ADL293 | 3 | 0.54 | 0.52 | 0.60 |
| LEI094 | 6 | 0.49 | 0.36 | 0.52 | MCW330 | 5 | 0.62 | 0.40 | 0.68 |
| ADL317 | 5 | 0.70 | 0.16 | 0.75 | ADL304 | 4 | 0.52 | 0.44 | 0.58 |
| MCW295 | 3 | 0.49 | 0.00 | 0.56 | MCW165 | 3 | 0.14 | 0.00 | 0.15 |
| ROS013 | 4 | 0.27 | 0.04 | 0.28 | LEI074 | 3 | 0.53 | 0.64 | 0.60 |
| MCW078 | 2 | 0.37 | 0.12 | 0.50 | MCW069 | 3 | 0.39 | 0.20 | 0.44 |
| ADL292 | 3 | 0.47 | 0.64 | 0.54 | LEI135 | 2 | 0.19 | 0.00 | 0.21 |
However, the majority of the SSR markers were adequate for the appropriate estimation of the genetic diversity of Taif ecotype populations. The average PIC for SSR in Taif ecotype is lower than that of PIC obtained in different chicken breeds. For instance, Ramadan et al. (2012) reported an average PIC of 0.65 in Egyptian native breeds, while Seo et al. (2013) estimated the PIC of 0.77 in native Korean lines. Choi et al., (2015) reported a PIC of 0.68 in the commercial Korean breeds. One of the highest PICs reported in recent studies was obtained in Sinai and Norfa Egyptian native chicken breeds (PIC= 0.84) as reported by Soltan et al. (2018).
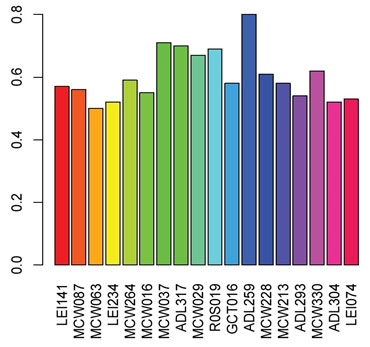
In the present study, about 18 markers had PIC exceeded 0.50 (Figure1) which is indicative of relative informativeness in studying genetic diversity. The observed proportion of heterozygosity (Hobs) ranged between 0.0 and 0.64 with an average of 0.28, Table 2. Hexp ranged between 0.68 and 0.24 with an average of 0.48. The elevated level of genetic diversity is a crucial factor for species’ constant survival and adaptability to a different environment. In the current study, Taif ecotype showed low genetic diversity Hobs compared to Hexp. The lower Hobs as compared to Hexp is indicative of the probable effect of random genetic drift and inbreeding that shaped Taif ecotype heterozygosity (Botstein et al., 1980, Ibrahim et al., 2015).
Figure 1: Polymorphic information content (PIC) for 18 microsatellite
loci with PIC> 0.50 of Taif ecotype.
Different evolutionary forces may act differently on various parts of the genome, hence changing the magnitude of heterozygosity. Most of the studied loci showed significant deviation from Hardy Weinberg expectation (Table 3) which might be associated with one or more factors including inbreeding, presence of null alleles, and/or small sample size (Nei, 1978, De La Rua et al., 2001).
Table 3. Deviation from Hardy Weinberg equilibrium for 40 loci of native Saudi ecotype
(loci in HWE are typed in italics and P-values marked withNS).
| Marker | HWE | P-value | Marker | HWE | P-value |
| MCW248 | 0.001 | 0.00 | MCW029 | 0.041 | 0.03 |
| LEI141 | 0.062 | 0.06NS | MCW014 | 0.002 | 0.00 |
| MCW087 | 0.000 | 0.00 | MCW183 | 0.267 | 0.32NS |
| MCW063 | 0.009 | 0.01 | R0S019 | 0.000 | 0.00 |
| LEI234 | 0.000 | 0.00 | ADL278 | 0.014 | 0.02 |
| MCW206 | 0.282 | 0.28NS | GCT016 | 0.000 | 0.00 |
| MCW288 | 0.000 | 0.00 | ADL259 | 0.000 | 0.00 |
| MCW264 | 0.000 | 0.00 | MCW067 | 0.000 | 0.00 |
| MCW127 | 0.281 | 0.28NS | MCW228 | 0.000 | 0.00 |
| MCW016 | 0.085 | 0.07NS | MCW216 | 1.000 | 1.00NS |
| MCW037 | 0.000 | 0.00 | MCW104 | 0.001 | 0.00 |
| MCW222 | 0.000 | 0.00 | MCW213 | 0.000 | 0.00 |
| LE1166 | 0.096 | 0.10NS | MCW123 | 0.001 | 0.00 |
| MCW098 | 1.000 | 1.00NS | ADL293 | 0.000 | 0.00 |
| LEI094 | 0.013 | 0.00 | MCW330 | 0.001 | 0.00 |
| ADL317 | 0.000 | 0.00 | ADL304 | 0.124 | 0.11NS |
| MCW295 | 0.000 | 0.00 | MCW165 | 0.000 | 0.00 |
| ROS013 | 0.000 | 0.00 | LEI074 | 0.239 | 0.25NS |
| MCW078 | 0.000 | 0.00 | MCW069 | 0.000 | 0.00 |
| ADL292 | 0.338 | 0.30NS | LEI135 | 0.000 | 0.00 |
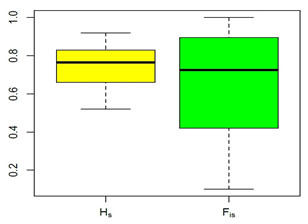
Genetic diversity (HS) and coefficient of inbreeding (FIS) across 40 microsatellite loci of Taif ecotype are presented in Table 4. Genetic diversity represents the magnitude of genetic variability within the population. In the present study, HS ranged between 0.52 and 0.92 with an average of 0.75. Also, the coefficient of inbreeding (FIS) ranged between 0.10 and 1.00 with an average of 0.65. The FIS in the present study is higher than that reported in other local chicken breeds (e.g.,0.02 in Egyptian local breeds), 0.01in Korean local breeds, 0.19 in Swedish breeds, and 0.41 in Sinai and Norfa Egyptian chicken breeds (Ramadan et al., 2012, Seo et al., 2013, Abebe et al., 2015, Soltan et al., 2018).
Table 4. Gene diversity within population (Hs) and coefficient of inbreeding FIS
across 40 microsatellite loci of native Taif ecotype.
| Marker | Hs | FIS | Marker | Hs | FIS |
| MCW248 | 0.60 | 1.00 | MCW029 | 0.86 | 0.40 |
| LEI141 | 0.83 | 0.47 | MCW014 | 0.65 | 0.82 |
| MCW087 | 0.84 | 0.71 | MCW183 | 0.62 | 0.74 |
| MCW063 | 0.77 | 0.44 | R0S019 | 0.86 | 0.35 |
| LEI234 | 0.80 | 0.75 | ADL278 | 0.73 | 0.72 |
| MCW206 | 0.67 | 0.10 | GCT016 | 0.85 | 1.00 |
| MCW288 | 0.63 | 1.00 | ADL259 | 0.92 | 0.61 |
| MCW264 | 0.83 | 0.28 | MCW067 | 0.73 | 1.00 |
| MCW127 | 0.62 | 0.74 | MCW228 | 0.84 | 0.57 |
| MCW016 | 0.76 | 0.16 | MCW216 | 0.56 | 0.84 |
| MCW037 | 0.85 | 0.29 | MCW104 | 0.74 | 0.51 |
| MCW222 | 0.77 | 1.00 | MCW213 | 0.83 | 0.76 |
| LE1166 | 0.67 | 0.22 | MCW123 | 0.63 | 0.81 |
| MCW098 | 0.52 | 1.00 | ADL293 | 0.76 | 0.32 |
| LEI094 | 0.77 | 0.53 | MCW330 | 0.86 | 0.53 |
| ADL317 | 0.90 | 0.82 | ADL304 | 0.78 | 0.44 |
| MCW295 | 0.81 | 1.00 | MCW165 | 0.60 | 1.00 |
| ROS013 | 0.67 | 0.94 | LEI074 | 0.78 | 0.18 |
| MCW078 | 0.77 | 0.85 | MCW069 | 0.74 | 0.73 |
| ADL292 | 0.75 | 0.15 | LEI135 | 0.63 | 1.00 |
The coefficient inbreeding (FIS) is indicative of the risk for a particular breed and urge for proper conservation plans (Simon and Buchenauer, 1993). Different thresholds have been set to determine the endangerment status of a specific breed (Ramadan et al., 2012, Soltan et al., 2018). For instance, the breed is considered not at risk when FIS is below 0.05; when FIS falls between0.05 and 0.15, the breed is potentially endangered; when FIS is between 0.15 and 0.25, the breed is slightly endangered, and when FIS is between 0.25 and 0.40, the breed is endangered and more than 0.40, the breed is severely endangered. In the current study, a total of 31 (77.5%) of SSR loci had FIS greater than one, indicative of a significantly endangered breed. The significant magnitude of inbreeding of the Taif ecotype provides evidence of a severely endangered breed that requires immediate breeding and conservative actions to be considered in order to preserve such an endangered ecotype.
Figure 2: Boxplot of gene diversity within a population (Hs) and coefficient of inbreeding
(FIS) across 40 microsatellite loci of nativeTaif ecotype, (lines above and beneath each
box refer to max and min values, line within each box refer to median value).
CONCLUSION
In the current study, a panel of 40 microsatellites markers were used to assess the genetic diversity of Taif ecotype chickens. All genetic diversity parameters showed average polymorphism level, yet high level of inbreeding. The current study highlights the significant magnitude of inbreeding in Taif ecotype that could severely impact trait fixation in the populations. The results of the current study may be used as an initial guideline to design further conservation programs for the development of sustainable genetic improvement plans for Taif ecotype conservation.
REFERENCES
Abdel-Hameed ESS and Bazaid SA. (2017). Chemical composition of essential oil from leaves of Schinus molle L. growing in Taif, KSA. J Essent Oil-Bear Plants, 20(1):45-58.
Botstein D, White RL, Skolnick M, Davis RW. (1980). Construction of a genetic linkage map in man using restriction fragment length polymorphisms. Am. J. Hum. Genet., 32(3):314-331.
Choi NR, Seo DW, Jemaa SB et al. (2015). Discrimination of the commercial Korean native chicken population using microsatellite markers. JAST., 57(1):1-8.
De La Rúa P, Galián J, Serrano J, Moritz RFA. (2001). Genetic structure and distinctness of Apis mellifera L. populations from the Canary Islands. Mol. Eco., l10 (7):1733-1742.
Habimana R, Okeno TO, Ngeno K, Mboumba S et al. (2020). Genetic diversity and population structure of indigenous chicken in Rwanda using microsatellite markers. April; PLoS ONE 15 (4): e0225084.
Hillel J, Groenen MA, Tixier-Boichard M et al. (2003). Biodiversity of 52 chicken populations assessed by microsatellite typing of DNA pools. Genet Sel Evol., 35(5):533-57.
Huang S, Zhang L, Rehman MU et al. 2017. High altitude hypoxia as a factor that promotes tibial growth plate development in broiler chickens. PLoS One, Mar;12(3): e0173698.
Ibrahim AM, Sabry AM, Hassan MM et al. (2015). Genetic Characterization of Local Chicken from Taif Region in Saudi Arabia Using RAPD Markers. Int. J. Biosci., 6(10):142-48.
Jombart T. (2008). R package for the multivariate analysis of genetic markers. Bioinformatics, 24(11):1403-1405.
Morrison ML. (2012). The Habitat Sampling and Analysis Paradigm Has Limited Value in Animal Conservation: A Prequel. J Wildl Manage, 76(3): 438-450.
Muchadeyi FC, Eding H, Wollny CB et al. (2007). Absence of population sub structuring in Zimbabwe chicken ecotypes inferred using microsatellite analysis. Anim Genet., 38 (4):332-9.
Nei M. (1978). Estimation of average heterozygosity and genetic distance from a small number of individuals. Genetics, 89(3):583-590.
Nones K, Ledur MC,Ruy CD, Baron EE et al. (2005). Genetic Linkage Map of Chicken Chromosome 1 from a Brazilian Resource Population. Sci. Agric., 62(1):12-17.
Nxumalo N, Ceccobelli S, Cardinali I et al. (2020). Genetic Diversity, Population Structure and Ancestral Origin of Kwa Zulu-Natal Native Chicken Ecotypes Using Microsatellite and Mitochondrial DNA Markers. Ital J Anim Sci., 19(1):1277-1290.
R Core Team (2015). Language and Environment for Statistical Computing. R Foundation for Statistical Computing, Vienna, Austria.
Radwan LM. (2020). Genetic improvement of egg laying traits in Fayoumi chickens bred under conditions of heat stress through selection and gene expression studies. February; JThermBiol89: 02546.
Ramadan S, Kayang B, Inoue E et al. (2012). Evaluation of genetic diversity and conservation priorities for Egyptian chickens. Open J Anim Sci., 2(3):183-190.
Rudresh BH, Murthy HN, Jayashankar MR et al. (2015). Microsatellite based genetic diversity study in indigenous chicken ecotypes of Karnataka. Vet World, 8(8):970-976.
Seo DW, Hoque MR, Choi NR et al. (2013). Discrimination of korean native chicken lines using fifteen selected microsatellite markers. Asian-Australas J Anim Sci., 26(3):316-322.
Simon D and Buchenauer D. (1993). Genetic diversity of European livestock breeds; Wageningen, Wageningen Press.
Soltan M, Farrag S, Enab A et al. (2018). Sinai and Norfa Chicken Diversity Revealed by Microsatellite Markers. S Afr j Anim Sci., 48(2):307-315.
Strillacci MG, Cozzi MC, Gorla E et al. (2017). Genomic and genetic variability of six chicken populations using single nucleotide polymorphism and copy number variants as markers. Animal, 11(5):737-745.
Van Marle-Koster E and Nel LH. (2000). Genetic Characterization of Native Southern African Chicken Populations: Evaluation and Selection of Polymorphic Microsatellite Markers. S Afr J Anim. Sci., 30 (1):1-6.

