1Botany Research Laboratory, Vidyabharati Mahavidyalya College, Camp, Amravati, M.S., India.
2Department of Botany, Government Degree College Doda, J & K, India.
3Plant Tissue Culture Laboratory, Department of Botany, University of Kashmir, J&K, India.
Corresponding author Email: nasir.wagay1989@rediffmail.com
Article Publishing History
Received: 01/04/2019
Accepted After Revision: 15/06/2019
Plants act as transducers of the solar light in the chemical energy because they contain chlorophyll molecules and are of utmost importance because of their light absorbing property. These pigment molecules are helpful in the measuring plant productivity, maintaining photostasis, protecting from excess sunlight and are also indicators of phototoxicity, pollution and environmental stress. In the present study, 40 plant species of District Amravati were evaluated for their chlorophyll content by Arnon’s method of spectrophotometry, using 80% Acetone and 95% Ethanol as solvents. In case of 80% Acetone maximum chlorophyll-a concentration was found in Psidium guajava and Polyalthia longifolia and in case of 95% Ethanol maximum level of chlorophyll-a concentrations were found in eight species; Psidium guajava, Bauhinia purpurea, Moringa oleifera, Murraya paniculata, Plumeria rubra, Terminalia catappa, Peltophorum pterocarpum and Delonix regia. 80% Acetone based samples showed more difference in concentrations of chlorophyll-b with respect tochlorophyll-a. The maximum concentration of chlorophyll-b was found in Psidium guajava, Murraya paniculata and Bauhinia purpurea and in 95% Ethanol based samples chlorophyll-b concentration was maximum in Bauhinia purpurea. On the basis of the observation of all the results it was evident that the maximum and minimum values of chlorophylls are same in both the solvents but overall the 95% Ethanol showed higher concentration of both chlorophyll-a & b.
Amravati, Chlorophyll content, Solvents, Spectrophotometer
Wagay N. A, Dar M. A, Per T. S, Rafiq S. Biochemical Evaluation of Chlorophyll Content Using Different Solvents in Various Plant Species of Amravati, Maharashtra (India). Biosc.Biotech.Res.Comm. 2019;12(2).
Wagay N. A, Dar M. A, Per T. S, Rafiq S. Biochemical Evaluation of Chlorophyll Content Using Different Solvents in Various Plant Species of Amravati, Maharashtra (India). Biosc.Biotech.Res.Comm. 2019;12(2). Available from: https://bit.ly/2MnNN9F
Copyright © Wagay et al., This is an open access article distributed under the terms of the Creative Commons Attribution License (CC-BY) https://creativecommns.org/licenses/by/4.0/, which permits unrestricted use distribution and reproduction in any medium, provide the original author and source are credited.
Introduction
The chlorophylls comprise a group of more than 50 tetrapyrrolic pigments with common structural elements and function (Scheer 2003). Pigments are functionally important molecules in photosynthetic organisms. They not only harvest the light energy necessary for carbon reduction but some serve to protect the organism from excess light. The balance of photosynthetic pigments is dynamic and contributes to the maintenance of photostasis within the cell (Huner et al. 1998). The ratio of chlorophyll-a, and chlorophyll-b in terrestrial plants has been used as an indicator of response to light or shade conditions (Porra, 1991; Vicas et al. 2010). The small proportion of chlorophyll-a/b is considered as sensitive biomarker of pollution and environmental stress (Tripathi and Gautam, 2007). The amount of extracted chlorophyll may provide information on the sensitivity of plants during cultivation and herbicide application, and even indicate the manner of phytotoxic activity of herbicides (Nikolić et al. 2007). In order to analyze and describe changes in the process of photosynthesis and detect stress in plants, various types of indicators of chlorophyll activity were used (Lichtenthaler,1996). In tumor or cancer therapy chlorophyll or chlorophyll derivatives can be utilized as a photodynamic agent (Brandis et al. 2006). It can be studied, modified and synthesized in chemistry and physics disciplines for different applications i.e., electronic, photophysics, optoelectronic, electrochemistry etc (Nurhayati and Suendo, 2011).
The absorbance properties of pigments facilitate the qualitative and quantitative analysis of these molecules. Determination of the content of photosynthetic pigments in leaves is one of the key techniques in studying the process of photosynthesis and measuring plant productivity. Chlorophyll molecules absorb and re-emit light, a characteristic which was the basis for developing two basic methods: absorption and fluorescence monitoring of the optical activity of chlorophyll molecules. The method of chlorophyll fluorescence is used for monitoring photosynthesis in situ and in vivo and for estimating the impact of various stress factors (abiotic, biotic, xenobiotic) on this crucial process. It makes possible to differentiate plant genotypes resistant to the aforementioned stressful environmental factors, and also to assess the positive impact of various agricultural measures on plant health (mineral nutrition, use of herbicides, etc.). Methods for non-destructive quantification of chlorophyll in plant leaves are particularly valuable in assessing nitrogen content in plants because chlorophyll is one of the most important points of its accumulation, (Indira et al., 2015).
The confirmation of the two forms of chlorophyll was practically confirmed by Tswett 1903 (Nešković et al. 2003). A hundred years later, we used spectrophotometry to analyze plant pigments extracted in various solvents. There is a trade-off between choosing the best solvent for efficient quantitative extraction of chlorophylls and use of a solvent best suited for spectrophotometric assay (James and Akaranta, 2011). The selection of solvent for extraction brings about a dilemma. A number of factors may affect the activity of a solvent: the time required for extraction, amount of plant material, percentage of moisture in plant material, preservation of extract in unchanged form, (Moran and Porath, 1980; Jelić et al. 1992), as well as the fact that the extraction of chlorophyll-a is a slower process than that of chlorophyll-b. Light, an important environmental factor, causes degradation of chlorophyll, so that extraction should be carried out in almost total absence of light (Jelić et al. 1992).
The absorbance of the chlorophylls is then quantitatively determined by spectrophotometry at the wavelengths of maximum chlorophyll-a and chlorophyll-b absorption i.e., λ = 647 nm and λ = 664 nm (Moran and Porath, 1980), while the actual content of photosynthetic pigments is calculated according to Wellburn’s formulas (1994). This procedure is based on the Lambert-Beer law on linear relationship between absorbance and concentration of pigments within a certain range.To understand the variation in chlorophyll-a, chlorophyll-b and total chlorophyll content using different solvents, forty native species of tropical region were selected. Conclusions were drawn based on the variation in chlorophyll content values.
Materials and Methods
Amravati is a district in the state of Maharashtra situated at 20˚55ˊ33̎ N and 77˚ 45ˊ53̎ E at 343m (1,125ft.) asl. The Amravati district has an area of 270 km2. The study area has well demarcated four seasons as a hot summer, heavily raining monsoon, a brief autumn and a mild winter. The area has sub tropical and deciduous climatic conditions with ample rainfall in the monsoon resulting in a rich diversity of vascular plants (Figures 1, 2, and 3).40 commonly grown plant species of Amravati district (viz., Aegle marmelos, Acacia nilotica, Alstonia scholaris, Annona reticulate, Annona squamosa, Artocarpus heterophyllus, Anacardium occidentale, Azadirachta indica, Butea monosperma, Bauhinia purpurea, Buchanania lazan, Cassia siamea, Callistemon lanceolatus, Cinnamonum tamala, Citrus aurantium, Citrus limon, Dalbergiasisoo, Delonix regia, Eucalyptus globules, Ficus benghalensis, Ficus religiosa, Mangnifera indica, Moringa oleifera, Murraya paniculata, Murraya koenigii, Manilkara zapota, Peltophorum pterocarpum, Plumeria rubra, Pongamia pinnata, Psidium guajara, Polyalthia longifolia, Saraca indica, Santalum album, Syzygium cummini, Tectona grandis, Terminalia catappa, Tecoma stans, Thevetia peruviana, Tamarindus indica, Zizyphus mauritiana) were used for experimental purpose. The understudy plants were morphologically identified with the help of standard floras i.e., Flora of British India (Hooker, 1876); and in Maharashtra collected and recorded by Cooke (1967); Naik (1998); and Singh and Karthekiyan (2001) and authenticated by taxonomist Professor Dr. S.P. Rothe. These species are mostly preferred to grow in tropical regions. Healthy and uninfected species were collected at their stage of maturity; and care was also taken during sampling of leaves to avoid mechanical injuries. Fresh leaf samples were washed thoroughly first in tap water followed by distilled water in the laboratory, kept to dry in room temperature (18oC) and analyzed for the determination of chlorophylls (chlorophyll-a and –b).
Table 1: Chlorophyll-a, chlorophyll-b and chlorophyll-a+b concentrations using 80% acetone
| S. No | Name of plant species | Chl-a | Chl-b | Chl-a+b |
| 1 | Annona reticulate | 0.0085 | 0.0071 | 0.0157 |
| 2 | Annona squamosa | 0.0265 | 0.0195 | 0.0461 |
| 3 | Artocarpus heterophyllus | 0.0155 | 0.0250 | 0.0405 |
| 4 | Bauhinia purpurea | 0.0195 | 0.0325 | 0.0521 |
| 5 | Butea monosperma | 0.0131 | 0.0134 | 0.0265 |
| 6 | Cassia siamea | 0.0182 | 0.0133 | 0.0315 |
| 7 | Cinnamomum tamala | 0.0194 | 0.0228 | 0.0423 |
| 8 | Citrus limon | 0.0264 | 0.0165 | 0.0429 |
| 9 | Citrus aurantium | 0.0142 | 0.0110 | 0.0253 |
| 10 | Dalbergia sisoo | 0.0053 | 0.0047 | 0.0101 |
| 11 | Delonix regia | 0.0205 | 0.0159 | 0.0365 |
| 12 | Ficus benghalensis | 0.0174 | 0.0116 | 0.0291 |
| 13 | Ficus religiosa | 0.0121 | 0.0108 | 0.0229 |
| 14 | Mangifera indica | 0.0075 | 0.0076 | 0.0152 |
| 15 | Azadirachta indica | 0.0187 | 0.0102 | 0.0290 |
| 16 | Moringa oleifera | 0.0193 | 0.0264 | 0.0457 |
| 17 | Murraya koenigii | 0.0089 | 0.0087 | 0.0177 |
| 18 | Murraya paniculata | 0.0190 | 0.0328 | 0.0518 |
| 19 | Plumeria rubra | 0.0125 | 0.0122 | 0.0248 |
| 20 | Santalum album | 0.0189 | 0.0261 | 0.0450 |
| 21 | Syzygium cumini | 0.0103 | 0.0151 | 0.0255 |
| 22 | Tectona grandis | 0.0188 | 0.0252 | 0.0440 |
| 23 | Zizyphus mauritiana | 0.0215 | 0.0142 | 0.0358 |
| 24 | Tecoma stans | 0.0185 | 0.0230 | 0.0415 |
| 25 | Buchanan lanzan | 0.0153 | 0.0144 | 0.0298 |
| 26 | Anacardium occidentale | 0.0166 | 0.0193 | 0.0360 |
| 27 | Polyalthia longifolia | 0.0309 | 0.0275 | 0.0585 |
| 28 | Acacia nilotia | 0.0186 | 0.0222 | 0.0409 |
| 29 | Aegle marmelos | 0.0158 | 0.0136 | 0.0295 |
| 30 | Tamarindus indica | 0.0161 | 0.0212 | 0.0373 |
| 31 | Pongamia pinnata | 0.0105 | 0.0127 | 0.0233 |
| 32 | Psidium guajava | 0.0313 | 0.0368 | 0.0681 |
| 33 | Saraca indica | 0.0059 | 0.0060 | 0.0120 |
| 34 | Terminalia catappa | 0.0087 | 0.0075 | 0.0163 |
| 35 | Callistemon lanceolatus | 0.0105 | 0.0110 | 0.0215 |
| 36 | Eucalyptus globules | 0.0162 | 0.0216 | 0.0378 |
| 37 | Manilkara zapota | 0.0132 | 0.0168 | 0.0300 |
| 38 | Alistonia scholaris | 0.0024 | 0.0027 | 0.0051 |
| 39 | Thevetia peruviana | 0.0094 | 0.0073 | 0.0168 |
| 40 | Peltophorum pterocarpum | 0.0124 | 0.0172 | 0.0296 |
For the estimation of chlorophyll content the procedure given by Arnon (1949) with slight modifications was used. Leaves were cut into small pieces and major veins and tough fibrous tissue was discarded. 100 mg of material was used for grinding. 10 ml of 80% acetone (acetone:water; 80 : 20 v:v) was added. For complete pulverization of tissue few grains of sand was added. The homogenate was filtered through filter paper and retentate was discarded while the extract (filtrate) was collected in the test tube.Chlorophyll concentration was determined using spectrophotometer/ colorimeter. In this study, leaves of 40 different tree species commonly available in understudy region of Maharashtra were used for the quantification of chlorophyll content. Two different solvents 80% Acetone and 95% Ethanol were used separately for the extraction of chlorophyll. Absorbance readings of chlorophyll extracts were measured at two different wavelengths 645nm and 663nm respectively.
Results and Discussion
Based on the absorbance value, calculations were made using Arnon’s (1949) equation and the amount of chlorophyll-a, chlorophyll-b and total chlorophyll were estimated and tabulated. The results of Chlorophyll-a, chlorophyll-b and chlorophyll-a+b concentrations using 80% acetone as solvent are shown in Tabulated form ( Table 1) and as well as in Graphical form ( Graph 1). The maximum chlorophyll-a concentration was found in Psidium guajava and Polyalthia longifolia i.e., 0.03g/kg and minimum concentration was found in Alstonia scholars i.e., 0.0024 g/kg. In most of the species maximum concentrations of chlorophyll-a was found in the range between 0.005-0.02 g/kg. Concentration of chlorophyll-b showed much variation in comparison to concentration of chlorophyll-a. The maximum concentration of chlorophyll-b was found in Psidium guajava, Murraya paniculata and Bauhinia purpurea which was more than 0.03g/kg and the minimum concentration was found in Alstonia scholaris about 0.002 g/kg. Most of the concentrations were found in the range between 0.1-0.3 g/kg or more specifically between 0.1-0.2 g/kg. The maximum level of chlorophyll-a+b found in Psidium guajava was about 0.06 g/kg and the minimum concentration was found in Alstonia scholaris, 0.005g/kg. In most of the species chlorophyll-a+b concentration was found in the range between 0.02-0.04 g/kg. About nine species showed concentration of 0.02 g/kg and ten species showed concentration above 0.04g/kg.
Table 2: Chlorophyll-a, chlorophyll-b and chlorophyll-a+b concentrations using 95% Ethanol
| S. No | Name of plant species | Chl-a | Chl-b | Chl-a+b |
| 1 | Annona reticulata | 0.0138 | 0.0115 | 0.0254 |
| 2 | Annona squamosa | 0.0241 | 0.0309 | 0.0550 |
| 3 | Artocarpus heterophyllus | 0.0130 | 0.0221 | 0.0352 |
| 4 | Bauhinia purpurea | 0.0312 | 0.0398 | 0.0711 |
| 5 | Butea monosperma | 0.0240 | 0.0341 | 0.0582 |
| 6 | Cassia siamea | 0.0228 | 0.0153 | 0.0381 |
| 7 | Cinnamomum tamala | 0.0187 | 0.0245 | 0.0432 |
| 8 | Citrus limon | 0.0127 | 0.0083 | 0.0210 |
| 9 | Citrus aurantium | 0.0159 | 0.0125 | 0.0284 |
| 10 | Dalbergia sisoo | 0.0137 | 0.0099 | 0.0236 |
| 11 | Delonix regia | 0.0313 | 0.0363 | 0.0676 |
| 12 | Ficus benghalensis | 0.0224 | 0.0152 | 0.0377 |
| 13 | Ficus religiosa | 0.0166 | 0.0119 | 0.0285 |
| 14 | Mangifera indica | 0.0120 | 0.0137 | 0.0253 |
| 15 | Azadirachta indica | 0.0112 | 0.0078 | 0.0191 |
| 16 | Moringa oleifera | 0.0312 | 0.0318 | 0.0630 |
| 17 | Murraya koenigii | 0.0149 | 0.0197 | 0.0347 |
| 18 | Murraya paniculata | 0.0314 | 0.0278 | 0.0592 |
| 19 | Plumeria rubra | 0.0314 | 0.0276 | 0.0590 |
| 20 | Santalum album | 0.0286 | 0.0218 | 0.0504 |
| 21 | Syzygium cumini | 0.0059 | 0.0071 | 0.0130 |
| 22 | Tectona grandis | 0.0219 | 0.0221 | 0.0441 |
| 23 | Zizyphus mauritiana | 0.0137 | 0.0138 | 0.0275 |
| 24 | Tecoma stans | 0.0237 | 0.0215 | 0.0452 |
| 25 | Buchanan lanzan | 0.0194 | 0.0153 | 0.0348 |
| 26 | Anacardium occidentale | 0.0300 | 0.0348 | 0.0649 |
| 27 | Polyalthia longifolia | 0.0253 | 0.0175 | 0.0429 |
| 28 | Acacia nilotia | 0.0270 | 0.0176 | 0.0446 |
| 29 | Aegle marmelos | 0.0132 | 0.0089 | 0.0221 |
| 30 | Tamarindus indica | 0.0234 | 0.0272 | 0.0507 |
| 31 | Pongamia pinnata | 0.0154 | 0.0160 | 0.0314 |
| 32 | Psidium guajava | 0.0313 | 0.0348 | 0.0661 |
| 33 | Saraca indica | 0.0094 | 0.0122 | 0.0216 |
| 34 | Termialia catappa | 0.0313 | 0.0318 | 0.0631 |
| 35 | Callistemon lanceolatus | 0.0104 | 0.0087 | 0.0191 |
| 36 | Eucalyptus globules | 0.0273 | 0.0204 | 0.0478 |
| 37 | Manilkara zapota | 0.0228 | 0.0259 | 0.0487 |
| 38 | Alistonia scholaris | 0.0240 | 0.0333 | 0.0573 |
| 39 | Thevetia peruviana | 0.0281 | 0.0196 | 0.0477 |
| 40 | Peltophorum pterocarpum | 0.0313 | 0.0313 | 0.0627 |
The results of Chlorophyll-a, chlorophyll-b and chlorophyll-a+b concentrations using 95% Ethanol as solvent are depicted in Graph 2 and in Table 2. The maximum level of chlorophyll-a concentrations were found in eight species such as (Psidium guajava, Bauhinia purpurea, Moringa oleifera, Murraya paniculata, Plumeria rubra, Terminalia catappa, Peltophorum pterocarpum, Delonix regia) in similar amounts 0.03 g/kg, and minimum level of chlorophyll-a was found in Syzygium cumini, 0.005 g/kg. In 12 species less than 0.015 g/kg concentrations were found. The remaining species showed the concentration more than 0.015 g/kg. The chlorophyll-b concentration was the maximum in Bauhinia purpurea, 0.039g/kg and minimum concentrations were found in about 6 species in the same amounts i.e., between 0.007-0.009 g/kg. In maximum species, concentrations were found in range of 0.03 g/kg. In ten species concentrations were found above 0.03 g/kg. The maximum level concentration of chlorophyll-a+b was found in Bauhinia purpurea i.e., 0.071g/kg and the minimum chlorophyll concentration was found in Syzygium cumini i.e., 0.013g/kg. In 7 species the concentrations were found more than 0.06 g/kg and in 12 species concentrations were found more than 0.05 g/kg. About 93% of species showed more than 0.02 g/kg chlorophyll- a+b concentration.
A graphical representation of comparison between chlorophyll a+b concentrations in these two different solvents ; 80% Acetone and 95% Ethanol showed different results (Graph 3). Samples prepared using 95% Ethanol showed more concentrations of chlorophyll- a+b in most of the species. Only 8 species of 80% Acetone prepared samples showed slightly more chlorophyll- a+b concentration than 95% Ethanol prepared samples that too with minor differences. 95% Ethanol prepared samples showed very higher concentrations than 80% Acetone prepared samples in more than 25% species. In about 10 species both the solvents showed the same amount of chlorophyll- a+b concentration. Alstonia scholaris, Terminalia catappa were the two species which showed a huge difference of chlorophyll a+b concentrations in two solvents, in which 95% Ethanol showed the higher concentration then 80% Acetone.
As chlorophyll is one of the important attributes, the observations of chlorophyll-a, b and total chlorophyll– a+b in all the 40 species have been estimated and compared. A graphical representation on the basis of results have also been plotted in order to understand the variations and differences among different concentrations observed. Different solvents such as ethanol, acetone, DMSO etc, have been used by researchers from time to time, to estimate the chlorophyll concentration in plants. In the present study two solvents have been used: 80% Acetone and 95% Ethanol. The observations were taken using UV spectrophotometery at 663nm and 645nm and a variety of results were obtained.
In 80% Acetone maximum chlorophyll-a concentration was found in Psidium guajava and Polyalthia longifolia 0.03g/kg and minimum concentration was found in Alstonia scholaris 0.0024 g/kg and in 95% Ethanol maximum level of chlorophyll-a concentrations were found in eight species such as (Psidium guajava, Bauhinia purpurea, Moringa oleifera, Murraya paniculata, Plumeria rubra, Terminalia catappa , Peltophorum pterocarpum, Delonix regia) in similar amounts 0.03 g/kg, and minimum level of chlorophyll-a was found in Syzygium cumini 0.005 g/kg. In both the solvents chlorophyll-a concentration was found to be almost same.80% Acetone based samples showed more difference in concentrations of chlorophyll-b with respect to chlorophyll-a. The maximum concentration of chlorophyll-b was found in Psidium guajava, Murraya paniculata and Bauhinia purpurea which were more than 0.03g/kg and the minimum concentration was found in Alstonia scholaris about 0.002 g/kg and in 95% Ethanol based samples chlorophyll-b concentration was maximum in Bauhinia purpurea 0.039g/kg and minimum concentrations were found in about 6 species in the same amounts in the range between 0.007-0.009 g/kg. Alstonia scholaris showed the least concentration of chlorophyll-a & b in 80% Acetone solvent.
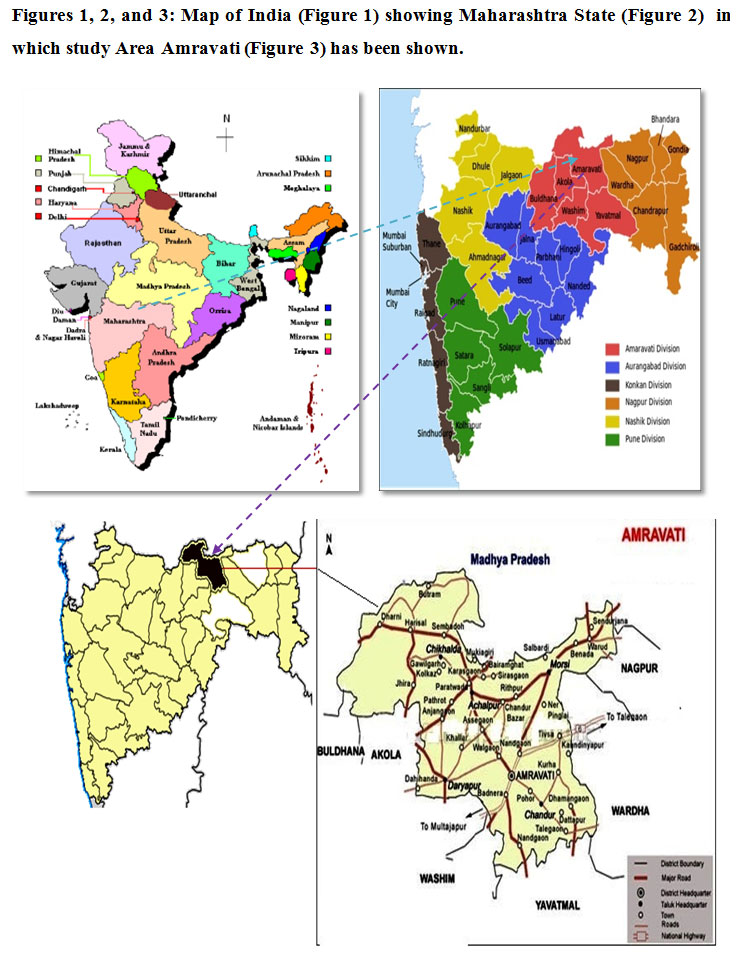 |
Figures 1, 2, and 3: Map of India (Figure 1) showing Maharashtra State (Figure 2) in which study Area Amravati (Figure 3) has been shown. |
On the basis of the observation of all the results it is evident that the maximum and minimum values of chlorophylls are same in both the solvents but overall the 95% Ethanol showed higher concentration of both chlorophyll-a and-b.Similar types of studies were also done by José Francisco et al., (2008) in which they determined chlorophyll concentrations in tropical tree species by Portable Chlorophyll Meter with appropriate adjustment equations. Faisal and Anis et al., (2006) reported higher amount of chlorophyll-a (0.91 ± 0.19 mg/g FW) and chlorophyll-b (0.61 ± 0.09 mg/g FW) in micro propagated plants of Psoralea corylifolia compared to chlorophyll-a (0.83 ± 0.31 mg/g FW) and chlorophyll-b (0.53 ± 0.14 mg/g FW) in seedlings. Dere (1998) have also investigated the level of chlorophyll-a in fresh water forms of some algal species. Indira et al., (2015) have also estimated the chlorophyll content of Tridax procumbens grown in normal and polluted region in which they reported that the chlorophyll content in normal and polluted regions is 2.99mg/g and 2.56 mg/g respectively.
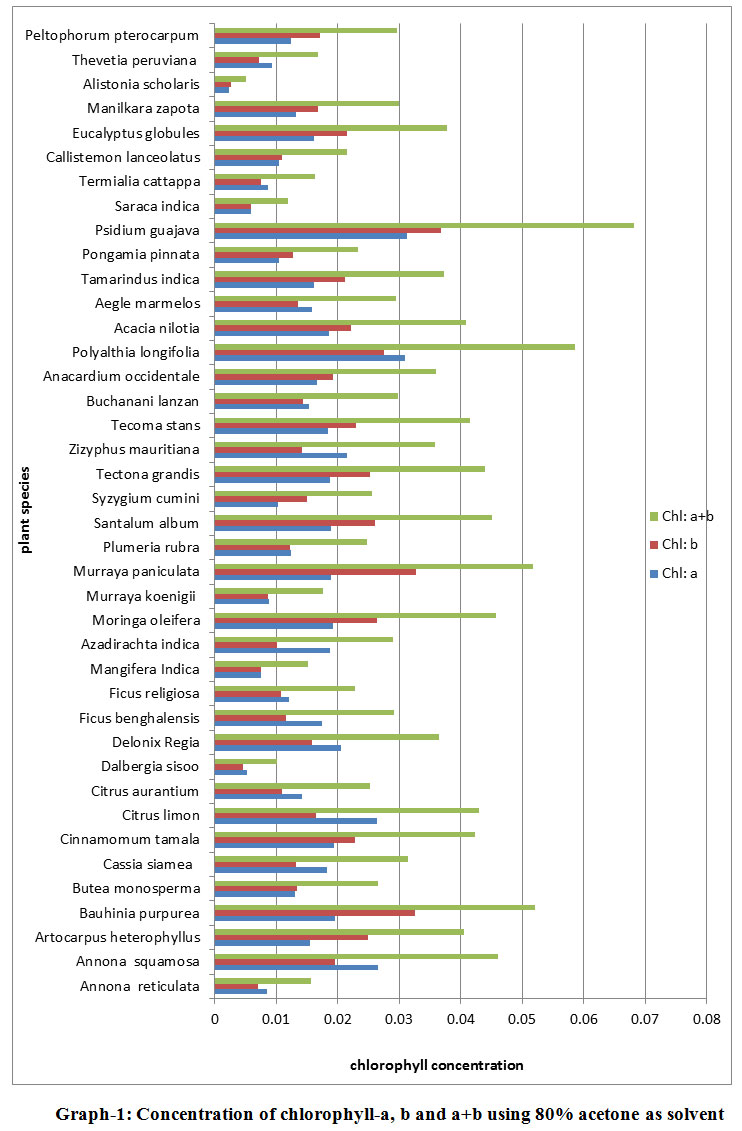 |
Graph 1: Concentration of chlorophyll-a, b and a+b using 80% acetone as solvent |
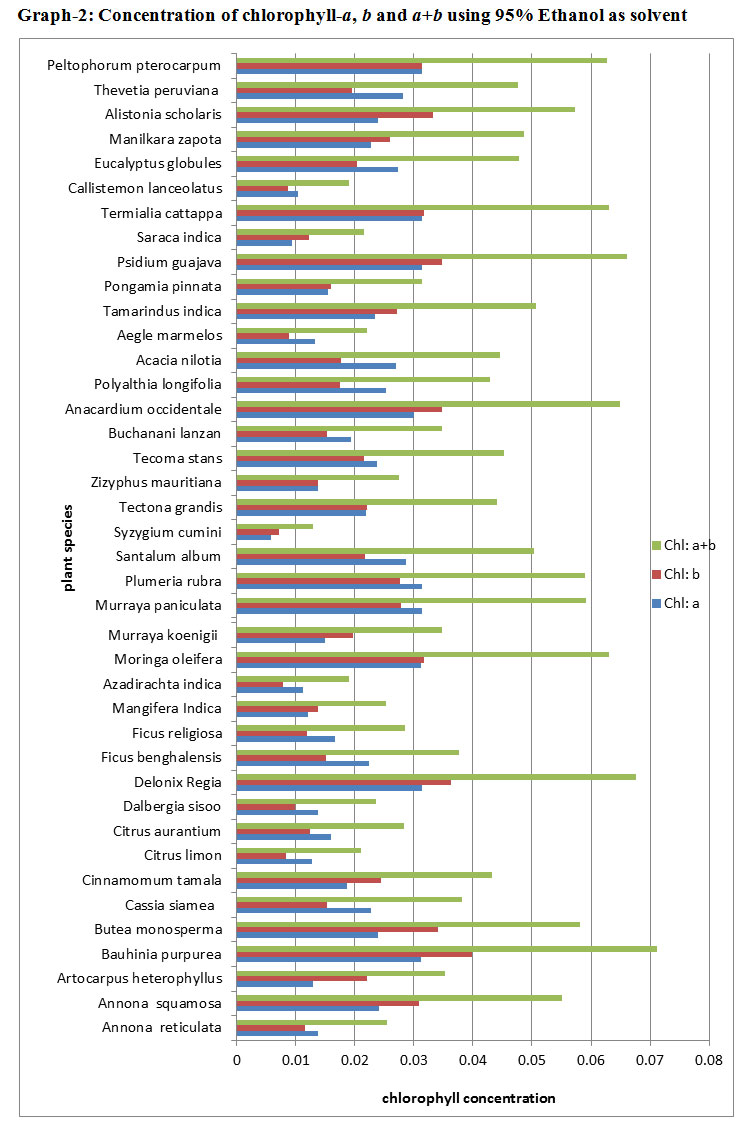 |
Graph 2: Concentration of chlorophyll-a, b and a+b using 95% Ethanol as solvent |
This method of chlorophyll quantification is reliable but time consuming and requires great precision. The main disadvantage of the method is that the process of extraction can result in erroneous qualitative and quantitative determination of the content of pigments (due to photochemical reactions, impact of ambient oxygen, chlorophyllase activity, pheophytinization caused by acids from plant tissue, etc (Jelić et al., 1992; Wellburn, 1994). Difficulties in comparing the results obtained by different extraction techniques sometimes raise the question of validity of research conclusions. A particular problem is posed by the fact that the amounts of chlorophyll measured after extraction with various solvents are hard to compare because different formulae are used for content calculation (Lichtenthaler, 1988). The defined absorption coefficients in these formulae are based on measurements made with outdated or imprecise spectrophotometers that are still in use. Therefore, the results obtained by different groups of researchers may differ, even when using the same extraction solvents, and be incomparable for several reasons: (I) differences in spectrophotometer resolutions in the range of red light wavelengths (II) the accuracy of readings of selected wavelengths, and (III) water content in analyzed tissues (Jelić et al., 1992).
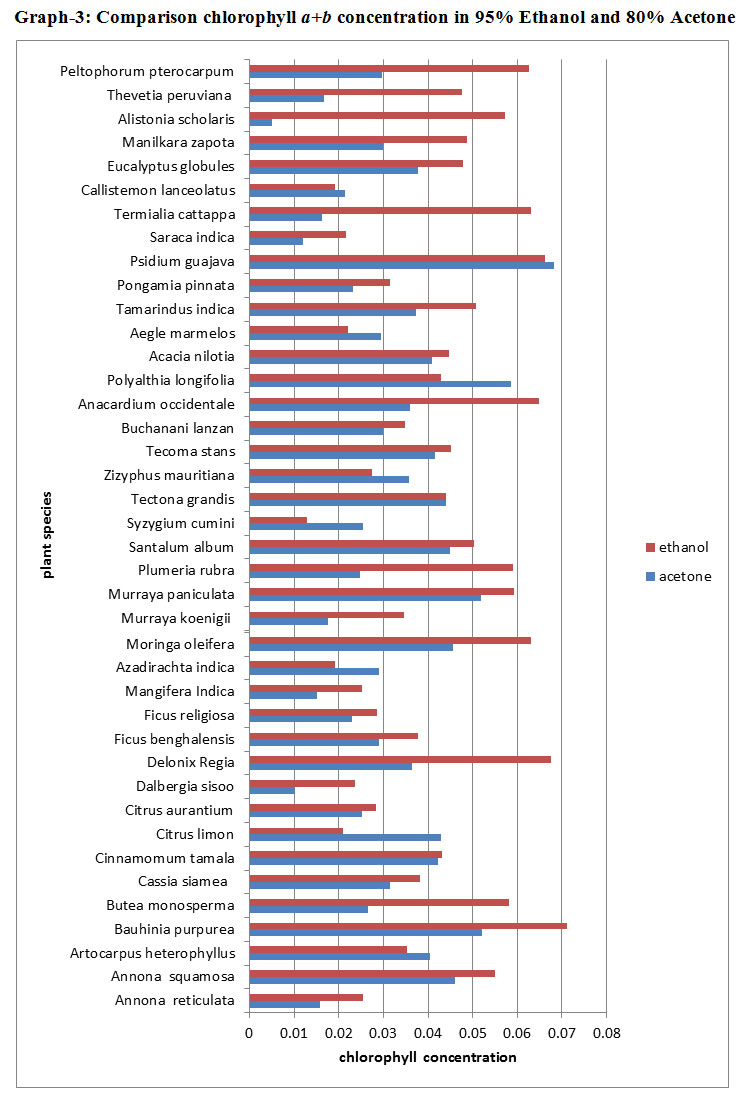 |
Graph 3: Comparison chlorophyll a+b on centration in 95% Ethanol and 80% Acetone |
Conclusion
Chlorophyll from 40 different tree species was extracted and estimated. Considering the results obtained in this work, chlorophyll content in Psidium guajava leaves was higher and almost similar in both the solvents with less variation followed by Bauhinia purpurea, Murraya paniculata, Annona squamosa, Polyalthia longifolia, Acacia nilotica, Cinnamonum tamala. Species like Delonix regia, Anacardium occidentale, Terminalia catappa, Alstonis scholaris, Thevetia peruviana, Peltophorum pterocarpum showed very high difference in their concentration in 95% Ethanol and 80% Acetone, it suggests that different plants may need different solvents for isolation; it may be because of their biochemical constituents while as some plants showed a similar concentration in both the solvents. Chlorophyll-a, chlorophyll-b and total chlorophyll amount showed different values in the present study varying from 0.01 g/kg to 0.08 g/kg in these understudy tree species. By this we can conclude that different plant species have different requirements of photosynthetic pigments which have a direct relation to the photosynthetic activity and the rate of photosynthesis.
Acknowledgements
Authors are sincerely thankful to Professor S.P. Rothe (Ex-Head, Department of Botany, Shri Shivaji Science College, Akola) for his help in identification and authentication of several plant species. Authors are also thankful to Dr. V.R. Deshmukh (Ex-Head Department of Botany, Vidyabharati Mahavidyalya College, Amravati) for providing lab facilities during this study.
Conflict of Interest
The authors declare no competing interests to any person, agency or institution.
References
Brandis, Salomon A.S.Y. and Scherz A. (2006) Chlorophyll sensitizers in photodynamic therapy. Advances in Photosynthesis and Respiration Vol. 25: Pages 461-483.
Huner N.P.A., Oquist G., Sarhan, F. (1998) Energy balance and acclimation to light and cold. Trends in Plant Science Vol. 3 Issue 6: Pages 224-2309.
James A.O. and Akaranta O. (2011) Inhibition of Corrosion of Zinc in hydrochlororic acid solution by Red Onion Skin Acetone extract. Research Journal of Chemical Sciences Vol. 1 Issue 1: Pages 31-37.
Jelić G., Bogdanović M. and Nikolić B. (1992) Metode za određivanje fotosintetskih pigmenata. Acta herbologica. Vol. 1: Pages 235-242.
José Francisco de Carvalho Gonçalves, Ulysses Moreira dos Santos Junior e Emerson Alves da Silva. (2008) Evaluation of a portable chlorophyll meter to estimate chlorophyll concentrations in leaves of tropical wood species from Amazonian forest. Hoehnea. Vol. 35: Pages 185-188.
Lichtenthaler H.K. (1988) In vivo chlorophyll fluorescence as a tool for stress detection in plants. In H.K. Lichtenthaler (Ed.), Applications of Chlorophyll Fluorescence Pages 129-142.
Lichtenthaler H.K., Lang M., Sowinska M., Heisel F., Miehe J.A. (1996) Detection of vegetation stress via a new high resolution fluorescence imaging system. Journal of Plant Physiology Vol. 148: Pages 599-612.
Scheer H. (2003) In: Beverley Green, Parson WW (2003) Light-harvesting antennas in photosynthesis. Springer Netherlands Page 29.
Vicas S.I., Laslo V., Pantea S., Bandict G.E. (2010) Chlorophyll and carotenoids pigments from Mistletoe (Viscum album) leaves using different solvents. Fascicula Vol. 2: Pages 213–218.
Wellburn A.R. (1994) The spectral determination of chlorophylls a and b, as well as total carotenoids, using various solvents with spectrophotometers of different resolution. Journal of Plant Physiology Vol. 144: Pages 307-313.

