Ali Khalaf Ahmed Albaggar![]()
Department of Biology, Faculty of Science and Arts in Baljurashi, Albaha University, Saudi Arabia
Corresponding author email: alibaggar@hotmail.com
Article Publishing History
Received: 09/07/2020
Accepted After Revision: 15/09/2020
AimThis study aimed at assessment of some physical, chemical, and bacteriological parameters of some wells in Albaha region and its surrounding area, Saudi Arabia. Methodology: Physical parameters (total dissolved solids & turbidity) were analyzed by standard conductivity turbid meter. Chemical parameters (metal ions, sulfate, nitrate, nitrite and acidity) were measured by standard spectrophotometer and pH scale. EC blue 100® screening medium was employed to test for coliform bacteria in wells water. Results: Up to 73.7% of samples exceeded the permissible limits set by Saudi standards specified for total dissolved solids, turbidity, pH, Mn, SO4 and NO3.The average pH of targeted wells is 7.98 ± 0.37 which is within the permissible range specified by national and global standards. Detected levels (mg l-1) of total dissolved solids, Fe, Mn, SO4, NO2, and NO3 were 345.04, 0.62, 0.13, 5.74, 119.90, 52.74, and 0.157 mg l-1 respectively.
Mn and NO3 levels exceeded the permissible limits of Saudi and global health standards. About 36.8% of wells had a positive reaction for coliform presence by EC blue screening medium. In terms of spatial variations, no significant difference between individual sites was observed, however, sites as groups show remarkable variations in one group (SA) which had minor increases in NO2levelscompared to other sites. Correlations between SO4& total dissolved solids, Mn & NO3, pH & total dissolved solids, SO4& NO3, and SO4& Mn levels were found. Interpretation: Elevated levels of studied parameters in groundwater may be linked to agricultural and animal rearing practices. Precautions are highly recommended to avoid any public health hazards in future.
Albaha, chemical, Coliform bacteria Chemical, Spatial, Physical, Parameters, Water Quality
Albaggar A. K. A. Assessment of Water Quality in Some Wells in Albaha Region and its Surrounding Area, Saudi Arabia. Biosc.Biotech.Res.Comm. 2020;13(3).
Albaggar A. K. A. Assessment of Water Quality in Some Wells in Albaha Region and its Surrounding Area, Saudi Arabia. Biosc.Biotech.Res.Comm. 2020;13(3). Available from: https://bit.ly/2XejC8e
Copyright © Albaggar This is an open access article distributed under the terms of the Creative Commons Attribution License (CC-BY) https://creativecommons.org/licenses/by/4.0/, which permits unrestricted use distribution and reproduction in any medium, provide the original author and source are credited.
INTRODUCTION
Water is considered to be an important element to the life on the earth (Szewzyk et al., 2000). Although, the importance of freshwater for the consumption and other different uses, many diseases can be transmitted by this important type of water (Hahn, 2006; Ozler & Aydin, 2008). In addition, freshwater represents the only 3% of the total water resources in the world, which is found in groundwater, lakes, and rivers (APHA, 2012). In rural area, groundwater is preferred for the purpose of drinking due to its quality and safety in comparison to surface water. However, increased human activates affected this groundwater quality and added lots of chemical, physical, and microbial pollutants(Okeola et al., 2010; Patil et al., 2012). In addition, the quality of groundwater can be influenced by other different factors, such as geology, weathering system, the amount of recharge water and the interaction between rock and water (Sethy et al., 2016, Behailu et al 2018, Bourke et al., (2019).
In the ground aquifers, hand-dug wells (ancient wells) can be created. These types of wells varied in both depth and the volume of water, and can be exposed to various chemical, physical and bacterial pollutants (Yakubu, 2013). One of the most important keys to assess the quality of groundwater is to measure its chemical composition. Increased concentrations of chemical elements in drinking water can result in critical health hazards,(Mora et al., 2017). For example, methemoglobinemia can be caused by consuming water containing high concentrations of nitrate(Fan & Steinberg, 1996). Also, a laxative gastrointestinal disturbance could be triggered by consuming water containing high levels of sulfate(WHO, 2017), while the risk of hypertension can be increased through the consumption of ground water with high concentrations of salts(Chao et al., 2016).Generally, water-related diseases influenced millions of people every year especially children (Kisaka & Mato, 2018).
On the other hand, bacterial contamination of wateris the underlying cause of numerous water-borne diseases. Pathogenic bacteria should not be presented in drinking water. So, bacterial evaluation of groundwater intended to be consumed by human is an important health precaution(WHO, 1993). Coliform bacteria, including Escherichia coli (E. coli), have long been used as an indicators of water contamination. Coliform bacteria consist of total coliform bacteria and fecal coliform bacteria. Fecal coliform bacteria, such as E. coliare founded in the intestine of human and animals and their presence in water may indicate deposition of fecal materials. Consequently, drinking water should be tested for the presence or absence of coliform bacteria especially E. colito guarantee its safety for human consumption (WHO, 2008).
The aims of this research are to (i) measure the concentrations of some physical, chemical parameters and also to screen for coliform bacteria and E. coliin some wells in Albaha region and surrounding area, (ii) compare these parameters with Saudi standards and WHO (World Health Organization) guidelines for drinking water quality, (iii) determine the effect of spatial variation on the concentrations of environmental parameters, and (iv) determine the relationships between environmental parameters.
MATERIALS AND METHOD
The study sites: Nineteen wells were randomly selected from different zones in Albaha region and its surrounding area(Saudi Arabia) during 2017, (Figure 1) and (Table 1). Well sites were divided into 6 groups based on geographical locations (Figure 1) and (Table 2).Albaha region consists of different villages and almost half a million of population. In this region of Saudi Arabia, groundwater wells have long been used as the main source for drinking water and irrigation(Omer et al., 2014).
Figure 1: Geographical location of targeted wells (n=19)in six sites (as groups of wells, G1-G6) in Albaha region and its surrounding area (Saudi Arabia).
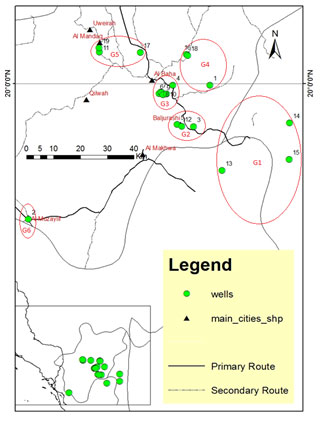
Table 1. Numbers, names and locations of targeted wells in Albaha region and its surrounding area (Saudi Arabia).
| Well no. | Names of wells (location) | Coordination | Altitude (m) | |
| Latitude | Longitude | |||
| 1 | Bani Kabir (South of Albaha) | 19.994561 | 41.660098 | 1906 |
| 2 | Almudailif (West of Albaha) | 19.534829 | 41.050467 | 47 |
| 3 | Alshatebah (Baljurashi) | 19.851837 | 41.604840 | 2026 |
| 4 | Alqohqoh(Marasiaah) | 19.995739 | 41.535219 | 2133 |
| 5 | Albahri, (Baljurashi) | 19.859957 | 41.549216 | 2037 |
| 6 | Adaros (Bani Dabian) | 19.966935 | 41.490027 | 2313 |
| 7 | Sobaiq (Bani Dabian) | 19.971517 | 41.495268 | 2275 |
| 8 | Asfal Alwadi (Bani Dabian) | 19.970397 | 41.499260 | 2304 |
| 9 | Sadd Alwadi (Bani Dabian) | 19.963037 | 41.503160 | 2410 |
| 10 | Alhanashah (Bani Dabian) | 19.965565 | 41.514047 | 2393 |
| 11 | Sadd Manshiah (Almandag) | 20.108782 | 41.288857 | 2189 |
| 12 | Alhoson (Baljurashi) | 19.854214 | 41.564965 | 2027 |
| 13 | Hawallah (South east of Albaha) | 19.702417 | 41.700848 | 612 |
| 14 | Shawas (South east of Albaha) | 19.865282 | 41.927247 | 1624 |
| 15 | Sadd Nabah (Albashayer) | 19.739621 | 41.926028 | 1785 |
| 16 | Alzayetonah Shoop Alhalah (Albaha) | 20.101866 | 41.580797 | 1857 |
| 17 | Alfaraah (Almosa) | 20.107243 | 41.426129 | 2224 |
| 18 | Alzayetonah, Shoop Alhallah (Albaha) | 20.097328 | 41.585645 | 1866 |
| 19 | Almaared (Almandag) | 20.123787 | 41.288205 | 2151 |
Table 2. Sites as groups in Albaha region and its surrounding area, Saudi Arabia
| Group number | wells no. | Group name | Symbol |
| 1 | 13, 14 and 15 | South east of Albaha | SA |
| 2 | 3, 5 and 12 | Baljurashi | BA |
| 3 | 4, 6, 7, 8, 9 and 10 | Bani Dabian | BD |
| 4 | 1, 16 and 18 | East of Albaha | EA |
| 5 | 11, 17 and 19 | Mandag | MA |
| 6 | 2 | Mudailif | MO |
Sample collection: According to previously published methods(APHA, 1998; Behailu et al., 2018), water samples were collected from 19 wells during 2017 using sterile 100 mL bottles for bacterial examination,and polyethylene bottles for physical and chemical tests. Each sample was labeled and transported, and stored at 4 °C until analysis in the laboratory of Biological departments in the faculty of science and arts in Baljurashi. Environmental parameters were analyzed in the laboratory of public administration of water services in Albaha region.
Physical, chemical, and bacterial analyses: Physical parameters (Total dissolved solids and turbidity) were measured using conductivity meter and turbid meter (HQ14D, Hach, USA). Chemical parameters (Fe, Mn, SO4, NO3 and NO2) were analyzed by spectrophotometer DR 2800 (Hach, USA), and pH meter PHS-25 (BANTE, China) was used to measure pH. EC blue 100p (HyServe, Germany)screening medium was used to examine the presence and absence of coliform bacteria.100 mL of the sample was put into coliform water test sampling container followed by addition of EC blue 100p and shaking for 10 second beforeincubation at 37 ˚C for 48 hours. Color changes of the mixture to green or blue color indicates the presence of coliform bacteria, while no color change is indicative of coliform absence in the sample(JWWA, 2001; Kodaka et al., 2008).
Statistical analysis: The statistical package of SPSS, version 20 (IBM) was used to analyze all physical, chemical and bacterial data. Kolmogorov-Smirnov tests was applied and some data that were not normally distributed were square root transformed. One-way ANOVA was applied to test the significant differences in all environmental parameters between individual sites and sites as groups. Spearman’s rank correlations (rs) was used to examine the relationships between environmental parameters (Bolter et al., 2002; Field, 2009).
RESULTS AND DISCUSSION
Water used for different purposes, such as drinking and irrigating should be tested for its quality. According to these purposes, one of the important key role to assess the quality of water is to select the required parameters to be tested(Al-Hasawi et al., 2018). In this study, all parameters selection was based on their importance for determining quality of drinking water.
Comparison with Saudi standards and WHO guidelines of drinking water quality: Two physical (Total dissolved solids and turbidity) parameters, six chemical parameters (pH, Fe, Mn, SO4, NO3, NO2), and also bacterial parameters are presented in Table 3 and Figures 2 to 18, respectively. All dissolved solids in water (manually mineral salts) are described as total dissolved solids (TDS) which are closely connected with conductivity (Iyasele et al., 2015).TDS ranged from 0.02 to 741 mg l-1 in sites 1 and 18, respectively with mean and SD values of 345.04 ± 218.58mg l-1(Table 3 and Figure 2A & B).
Approximately, 26.3% of wells (5 out of 19) exceeded the maximum concentrations of TDS recommended by Saudi standards (max. 500 mg l-1) but all TDS values did not exceed the maximum concentrations recommended by WHO guidelines (max. 1000mg l-1) for drinking water quality. The slightly increases of TDS in sites 3, 3, 5, 16 and 18 may be as a results of both dissolving rocks in wells and application of fertilizers. Similar results have been documented by Rezaei & Hassani (2018) who assessed the quality of groundwater in the north of Isfahan, Iran and found that 14% of samples exceeded the maximum concentrations of TDS given by WHO.
The presence of turbidity in water with high values can affect other chemical and microbial parameters (WHO, 2004).Values of turbidity ranged from 0.14 to 3.51mg l-1 in sites 18 and 19, respectively (0.26 ± 0.43 mg l-1) (Table 3 and Figure 2C&D). Only site 19 (5.3 % of all wells) exceeded the maximum concentrations of turbidity recommended by Saudi standards for drinking water quality (max. 1 NTU), while all concentrations of turbidity were below the maximum concentrations recommended by WHO guidelines (max. 5 NTU).This turbidity may be attributed to the presence of clay, silts, suspended solids, plankton and other microbes. Armah (2014) found turbidity is one of the most significant factors predict total coliform bacteria in mining environment in Ghana.
The pH values ranged from 7.34 to 8.67 SU in sites 14 and 11 (7.98 ± 0.37 SU) (Table 3 and figure 2E &F). Sites 11 and 8 (10.5% of the total wells) exceeded slightly the maximum concentrations of pH recommended by Saudi standards and WHO guidelines (max. 8.5 SU) for drinking water quality, while the other values of the other sites were within the recommended range (6.5 – 8.5 SU). The result of all values of pH in this study including sites 11 and 19 reflect that groundwater was slightly basic which is the same result obtained by Al-Hasawi et al.(2018) in the study of groundwater in Rabigh governorate, Saudi Arabia.
Fe is one of the most abundant element on the earth crust. The more ion in water the more inconvenient for human consumption since it produces undesirable color and taste(Zogo et al., 2010). Values of ferrous (Fe) ranged from 0.01 to 0.3 mg l-1 in sites 18 and 5 (0.13 ±0.10mg l-1) (Table 3 and figure 3A &B). No values of Fe exceeded the maximum concentrations recommended by Saudi standards and WHO guidelines for drinking water quality (max. 0.3 mg l-1). This result is in consistent with the results obtained by Kisaka & Mato (2018) who found the Fe within the permissible concentration in groundwater in Tanzania.
Manganese (Mn) can be found naturally in groundwater resulting from soluble of bedrock and also it can be leached into groundwater from human practices (Ljung & Vahter, 2007). Mn values ranged from 0 to 103 mg l-1 in sites 8 and 1 (5.74 ± 23.56 mg l-1) (Table 3 and figure3C & D). Approximately, 31.6% of the total wells (sites; 1, 2, 7, 16, 17 and 19) slightly exceeded the maximum concentrations of Mn recommended by Saudi standards for drinking water quality. Similarly, all sites mentioned above except site 16 (26.3% of total wells) slightly exceeded the maximum concentrations of WHO guidelines. The large value of Mn was recorded in site 1(103 mg l-1) in Bani Kabir (Table 1& Figure 1).Increased Mn levels in groundwater (above 0.4 mg l-1) can be risky to health (WHO, 2017). High levels have been documented in studies elsewhere and attributed to both intensive agriculture practices and Mn ions naturally found in groundwater (Phan et al., 2013; Van et al., 2016).
Sulfate (SO4) can be found in groundwater from both natural and anthropogenic sources (in the form of fertilizers). Water–related diseases, such as diarrhea, especially to young children, can be caused by high concentrations of SO4 in drinking water (Kisaka & Mato, 2018; Miao et al., 2012). Values of sulfate (SO4) ranged from 1.12 to 629 mg l-1 in sites 1 and 5 (119.90 ± 176.46mg l-1) (Table 3 and figure 3E& F). Three out of 19 wells (15.8%) (sites; 5, 6 and 7) exceeded the maximum concentrations of SO4 recommended by Saudi standards and WHO guidelines for drinking water quality. The study of the source of SO4 in groundwater in the Jinghuiqu district (China) found increases of SO4 during the period of time from 1990 to 2009 mainly due to dissolution of minerals(Liu et al.,2012).
Nitrate (NO3) can easily reaches the groundwater through agricultural activities, sewage contamination, and from the atmosphere (Ritzi et al., 1993). Nitrate (NO3) values ranged from 0.2 to 709.8 mg l-1 in sites 7 and 19 (52.74 ± 168.20mg l-1) (Table 3 and figure 4A&B). Two sites (10.5% of total wells) showed elevated values of NO3exceedingthe maximum concentrations recommended by Saudi standards and WHO guidelines for drinking water quality. The highest values were in site 19 (709.8 mg l-1) followed by site 1 (240 mg l-1).
The increased concentrations of NO3 in sites 1 and 19 may had resulted from agriculture practices through applying animal manure and inorganic nitrogenous fertilizer discharging into water wells. Recent study of the source of NO3 in groundwater conduct by Bourke and associates (2019) concluded that increased NO3 most likely attributed to mixing or denitrification and also agriculture activities.
Nitrite (NO2) values ranged from 0.001 to 0.044 mg l-1 in sites 4 and 13 (0.157 ± 0.011mg l-1) (Table 3 and figure4C&D). No wells exceeded the maximum concentrations of NO2 values recommended by Saudi standards and WHO guidelines for drinking water quality. The NO2 can be naturally found in groundwater as a result of nitrogen cycle (Nas & Berktay, 2005).
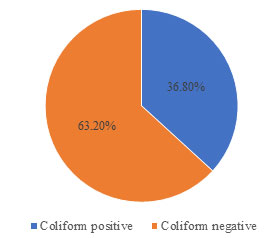
Results of EC blue analysis are presented in Table 3and Figure 5. Approximately, 36.8% of wells (sites; 2, 3, 4, 8, 11, 13 and 16) are contaminated with coliform bacteria. These pathogenic bacteria should not be founded in water used for drinking purpose and their viable count should be 0 per 100 mL (RCER, 2015; SASO, 2000; WHO, 2004, 2017). The presence of coliform bacteria and E. coli in the wells mentioned above may resulted from deposition of animal manure, sheep and goats faces around the opened wells especially after rainfall events. Sakami et al.(2003) stated that groundwater receives pathogens from animal manure after rainfall events.
A recent study revealed that all water sources including wells used for drinking purpose except tanks, in Baljurashi city, Albaha region were contaminated with coliform bacteria and E coli(Omer et al., 2014). It should be noted that positive results of coliform bacteria assay do not necessarily reflect a fecal contamination of water. All coliform genera, except E. coli, have been isolated from natural samples of non-fecal origin and all genera show a positive reaction in this assay (Doyle & Erickson, 2006).
Table 3. Details of some physical, chemical and bacterial parameters of targeted wells in Albaha region and its surrounding area.
| Well no. | Parameters | Coliform bacteria | |||||||
| pH | TDS (mg l-1) | Turbidity (NTU) | Fe (mg l-1) | Mn (mg l-1) | SO4 (mg l-1) | NO3 (mg l-1) | NO2 (mg l-1) | ||
| 1 | 8.37 | 0.02 | 0.330 | 0.03 | 103 | 1.12 | 240 | 0.020 | – |
| 2 | 7.86 | 573 | 0.750 | 0.02 | 0.6 | 81 | 1.1 | 0.040 | + |
| 3 | 7.91 | 638 | 0.500 | 0.23 | 0.1 | 75 | 3.1 | 0.020 | + |
| 4 | 8.12 | 351 | 0.160 | 0.15 | 0.3 | 64 | 0.5 | 0.001 | + |
| 5 | 8.09 | 629 | 0.260 | 0.26 | 0.01 | 629 | 2.7 | 0.020 | – |
| 6 | 7.96 | 399 | 0.770 | 0.14 | 0.1 | 399 | 1.5 | 0.012 | – |
| 7 | 7.69 | 469 | 0.450 | 0.03 | 0.7 | 469 | 0.2 | 0.018 | – |
| 8 | 8.63 | 159.4 | 0.380 | 0.22 | 0 | 123 | 0.3 | 0.014 | + |
| 9 | 7.88 | 158.5 | 0.570 | 0.1 | 0.1 | 16 | 0.7 | 0.010 | – |
| 10 | 8.37 | 99.7 | 0.300 | 0.02 | 0.3 | 9 | 3.3 | 0.020 | – |
| 11 | 8.67 | 80.7 | 0.220 | 0.23 | 0.2 | 21 | 23.9 | 0.004 | + |
| 12 | 8.36 | 104 | 0.240 | 0.16 | 1 | 7 | 3.3 | 0.010 | – |
| 13 | 7.35 | 377 | 0.520 | 0.05 | 0.2 | 32 | 2.5 | 0.044 | + |
| 14 | 7.34 | 341 | 0.490 | 0.3 | 0.1 | 34 | 0.4 | 0.022 | – |
| 15 | 7.61 | 466 | 0.890 | 0.1 | 0.1 | 75 | 1.3 | 0.010 | – |
| 16 | 7.82 | 501 | 0.530 | 0.3 | 0.5 | 38 | 1.9 | 0.005 | + |
| 17 | 7.99 | 347 | 0.780 | 0.02 | 0.7 | 59 | 3.8 | 0.002 | – |
| 18 | 7.74 | 741 | 0.140 | 0.01 | 0.1 | 113 | 1.7 | 0.017 | – |
| 19 | 7.93 | 121.4 | 3.510 | 0.05 | 0.9 | 33 | 709.8 | 0.009 | – |
| Mean ± SD | 7.98 ± 0.37 | 345.04 ± 218.58 | 0.62 ± 0.43 | 0.13 ± 0.10 | 5.74 ± 23.56 | 119.90 ± 176.46 | 52.74 ± 168.20 | 0.157 ± 0.011 | NA |
| Range | 7.34 – 8.67 | 0.02 -741 | 0.14 – 3.51 | 0.01 – 0.3 | 0 – 103 | 1.12 – 629 | 0.2 – 709.8 | 0.001 – 0.044 | NA |
| KSA PL | 6.5 – 8.5 | 500 | 1 | 0.3 | 0.4 | 250 | 50 | 0.2 | – |
| WHO PL | 6.5 – 8.5 | 500 – 1000 | 5 | 0.3 | 0.1 – 0.5 | 250 | 50 | 3 | – |
WHO: world health organization, PL: permissible limits, SD: standard deviation, NA: not applicable.
Figure 2: Variation of TDS (A & B), turbidity (C & D), and pH (E & F) between individual sites and sites as groups in some wells in Albaha region and its surrounding area, Saudi Arabia during 2017.
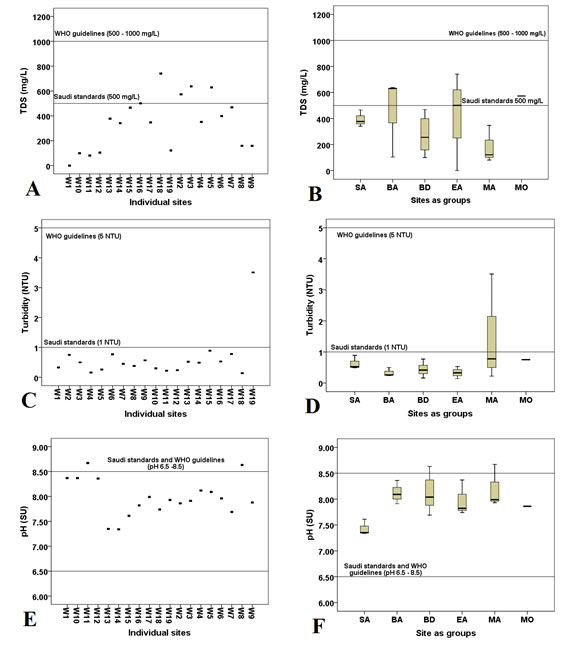
Figure 3: Variation of Fe (A & B), Mn (C & D), and SO4 (E & F) (mg l-1) between individual sites and sites as groups in some wells in Albaha region and its surrounding area, Saudi Arabia during 2017.
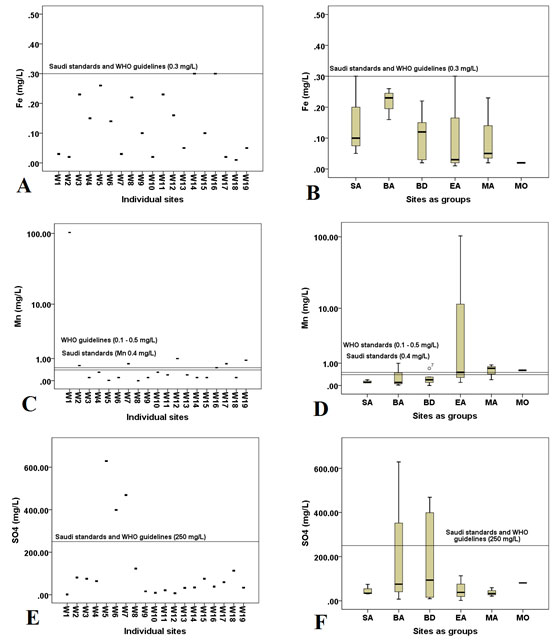
Figure 4: Variation of NO3 (A & B) and NO2 (C & D) (mg l-1) between individual sites and sites as groups in some wells in Albaha region and its surrounding area, Saudi Arabia during 2017.
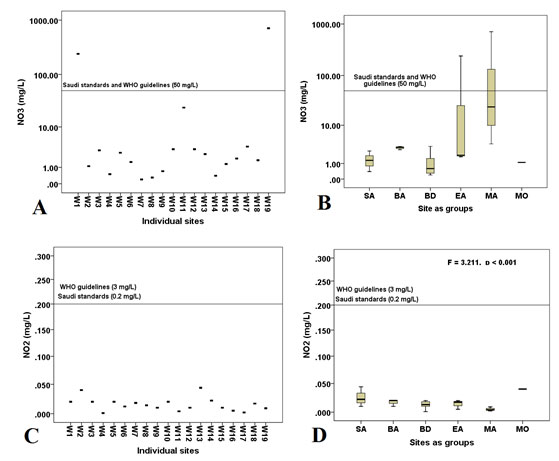
Figure 5: Percentage of coliform presencein individual sites in some wells in Albaha region and its surrounding area, Saudi Arabia during 2017.
Effects of spatial factors on the variation of environmental parameters: It is important to study of spatial effects on variations of physical, chemical, and microbial parameters. These parameters can be driven by geology, climate conditions and human activities(Ali & Ali, 2018).Effects of spatial factors on the variation of physical, chemical and bacterial parameters are presented in Table 2 and figures 1 & 17. One –Way ANOVA analysis shows no significant effects of individual sites on the variation of all environmental parameters investigated. However, sites as groups revealed significant effect on the variation of only nitrite (NO2) (F = 3.21, p < 0.001) in group 1 (SA) (see figures 1 & 17 and Table 2). Additionally, all values of NO2at all sites do not exceed the maximum concentrations recommended by WHO guideline and Saudi standards for drinking water quality. The slight increases ofNO2 concentrations in group 1(SA)compared with other groups in this research may be due tonaturaleffect as a part of nitrogen cycle(Bourke et al., 2019; Nas & Berktay, 2005).
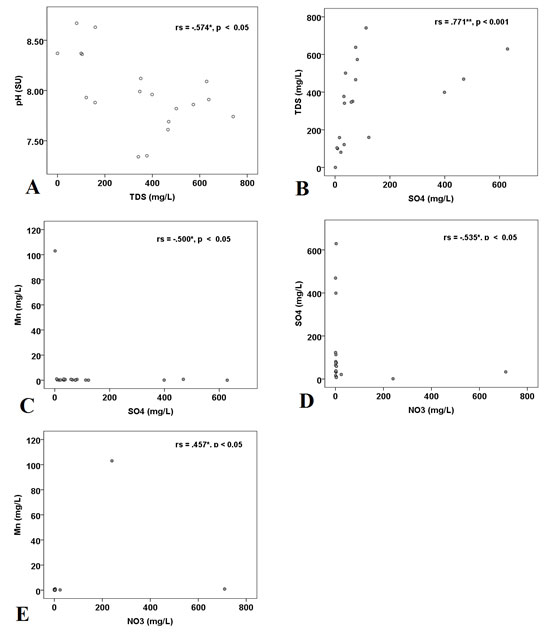
Significant relationships between environmental parameters: Previous studies of groundwater contamination had emphasized on the interplay between different environmental parameters by employing correlation coefficient statistics. This type of statistical analysis helps researchers to find out how environmental parameters effect water quality and accordingly how to manage strategies of water(Otu et al., 2014). Significant sportsman’s correlations coefficient analysis between all environmental parameters are presented in table 4 and figures 19 to 23.pH was negatively correlated with TDS (rs = – 0.574, p < 0.05) (Figure 19). This result reflects that the more basic water the less TDS concentration and vice versa. This result differs with the result obtained by Mahato et al.(2018) who found a low positive correlation between pH and TDS in groundwater in eastern Terai region of Nepal.
Results have also showed various significant correlations between SO4and different environmental parameters. These results suggest that TDS, Mn and NO3 influenced the SO4. The SO4was strongly positively correlated with TDS (rs = 0.771, p < 0.001) (Figure 20) and this observation is in good agreement with results of Salem & Alshergawi (2013) who studied51 wells used for drinking water in Alshati district of Libya. Also, SO4 was negatively correlated NO3 (rs = – 0.535, p < 0.05) (Figure 23).Similar result obtained by Konget al. (2013) but in different environment (atmospheric particles). In contrast, Kim et al.(2005) observed a positive correlation between SO4 and NO3 in groundwater in Namwon, Korea.
The SO4 was also negatively correlated with Mn (rs = – 0.500, p <0.05) (Figure 21). Similar weak negative correlation in groundwater was found by Shroff et al.(2015) in Valsad district of south Gujarat, India. Moreover, Mn was positively correlated with NO3 (rs = 0.457, p <0.05) (Figure 22). Other studies, for example, Bishnol & Malik (2008) and Salem & Alshergawi (2013)found no relationships between Mn and all the investigated environmental parameters including NO3 in groundwater.
Overall, physical chemical and bacterial parameters were studied in Albaha region and its surrounding area, Saudi Arabia. More than two thirds of wells are unsuitable for drinking and irrigation purposes due to inconsistencies with Saudi and WHO standards in terms of physical, chemical, and bacteriological parameters. Increases in TDS, turbidity, pH, SO4, NO3 and Mn, were found along with coliform bacteria. No statistically significant variations of environmental parameters were observed between individual well sites. Significant correlations were found between TDS and sulfate levels, Mn and nitrate, pH and TDS, and sulfate and nitrate. Urgent treatment for wells in Albaha region is strongly advised. Further investigations of groundwater quality in terms of temperature, heavy metals contents are highly recommended.
Table 4. Relationship between environmental parameters in some wells in Albaha region and its surrounding area
| Parameter | pH | TDS (mg l-1) | Turbidity (NTU) | Fe (mg l-1) | Mn (mg l-1) | SO4 (mg l-1) | NO3 (mg l-1) | NO2 (mg l-1) |
| pH | – | rs = -.574*,
p < 0.05 |
N.S. | N.S. | N.S. | N.S. | N.S. | N.S. |
| TDS (mg l-1) | rs = -.574*,
p < 0.05 |
– | N.S. | N.S. | N.S. | rs = .771**,
p < 0.001 |
N.S. | N.S. |
| Turbidity (NTU) | N.S. | N.S. | – | N.S. | N.S. | N.S. | N.S. | N.S. |
| Fe (mg l-1) | N.S. | N.S. | N.S. | – | N.S. | N.S. | N.S. | N.S. |
| Mn (mg l-1) | N.S. | N.S. | N.S. | N.S. | – | rs = -.500*,
p < 0.05 |
rs = .457*,
p < 0.05 |
N.S. |
| SO4 (mg l-1) | N.S. | rs = .771**,
p < 0.001 |
N.S. | N.S. | rs = -.500*,
p < 0.05 |
– | rs = -.535*,
p <0.05 |
N.S. |
| NO3 (mg l-1) | N.S. | N.S. | N.S. | N.S. | rs = .457*,
p < 0.05 |
rs = -.535*,
p <0.05 |
– | N.S. |
| NO2 (mg l-1) | N.S. | N.S. | N.S. | N.S. | N.S. | N.S. | N.S. | – |
Key symbols: SU: standard unit, N.S.: not significant, rs: Superman’s rank correlation.
Figure 6: Relationship between pH (SU) – TDS (A), TDS– SO4 (B), Mn– SO4 (C), SO4– NO3 (D) and Mn– NO3 (E) in some wells in Albaha region and its surrounding area, Saudi Arabia during 2017.
ACKNOWLEDGEMENT
The author would like to thank the public administration of water services in Albaha region (operation and maintenance) for analyzing water samples. Author would like also to thank his collages Prof. Ossama Badawyand Dr. Abdul Wali Al-Khulaidi for their support and help in collecting samples as well as preparing GIS map for well locations in the study sites.
REFERENCES
Al-Hasawi, Z. Al-Hasawi, R. and S. Al-Zahrani: (2018) The study of some physicochemical and microbiological properties in water wells at Rabigh governate, Saudi Arabia. J. Biosci. Appl. Res., 4, 169-183 (2018).
APHA: (1998) Standard methods for the examination of water and wastewater. 20th Edn., APHA, AWWA, WPCF, Washington DC, USA (1998).
APHA: (2012) Standard Methods for Examination of Water and Wastewater. 22nd Edn., APHA, AWWA, WPCF, Washington DC, USA (2012).
Armah, F.A (2014) Relationship between coliform bacteria and water chemistry in groundwater within gold mining environments in Ghana. Water Qual. Expo. Health, 5, 183-195
Behailu, T.W., T.S. Dadessa, and B.A Tewodros: (2018) Analysis of physical and chemical parameters in ground water consumed within Konso area, Southwestern Ethiopi. Afr. J. Environ. Sci. Technol., 12, 106-114
Bishnol, M. and R. Malik: Ground water quality in environmentally degraded localities of Panipat city, India. J. Environ. Biol., 29, 881-886 (2008).
Bolter, M., J. Bloem, K. Meiners, and R. Moller (2002) Enumeration and biovolume determination of microbial cells – a methodological review and recommendations for applications in ecological research. Biol. Fertil. Soils., 36(4), 249-259
Bourke, S.A., M. Iwanyshyn, J. Kohn, and M.J. Hendry (2019): Sources and fate of nitrate in groundwater at agricultural operations overlying glacial sediments. J. Hydrol. Earth Syst. Sci., 23, 1355-1373 .
Chao, S., J. Fan, and L. Wang: (2016) Association between the levels of calcium in drinking water and coronary heart disease mortality risk: evidence from a meta-analysis. J. Clin. Exp. Med., 9, 17912-17918
Doyle, M.P. and M.C. Erickson (2006) Closing the door on the fecal coliform assay. Microbe, 1, 162-163
Fan, A.M. and V.E Steinberg: (1996) Health implications of nitrate and nitrite in drinking water: an update on methemoglobinemia occurrence and reproductive and developmental toxicity. Regul. Toxicol. Pharmacol., 23, 35-43
Field, A.P: (2009) Discovering statistics using SPSS: and sex and drugs and rock ‘n’ roll. 3rd Edn., SAGE publications Ltd, London, UK
Hahn, M.W: (2006)The microbial diversity of inland waters. Curr. Opin. Biotechnol., 17, 256-261
Iyasele, J.U., J. David, and D.J. Idiata (2015) Investigation of the Relationship between Electrical Conductivity and Total Dissolved Solids for Mono-Valent, Di-Valent and Tri- Valent Metal Compounds. Int. J. Eng. Res. Rev., 3, 40-48
JWWAL2001) Standard methods for examination of water. Japan Water Works Association, Tokyo, Japan
Kim, K., N. Rajmohan, K.J. Kim, S.H. Kim, G.S. Hawang, S.T. Yun, B. Gu, M.J. Cho, and S.H. Lee: (2005) Evaluation of geochemical processes affecting groundwater chemistry based on mass balance approach: A case study in Namwon, Korea. Geochem. J., 39, 357-369
Kisaka, M. and R. Mato: (2018) Spatial variation of ground water quality parameters and its suitability for drinking at Makutopora aquifer, Dodoma Municipality, Tanzania. Int. J. Environ. Geoinform., 5, 337-352
Kodaka, H., S. Mizuochi, M. Saito, and H. Matsuoka: (2008) Evaluation of a new medium for the enumeration of total coliforms and Escherichia coli in Japanese surface waters. J. Appl. Microbiol., 104, 1112-1118
Kong, L., Y. Yang, S. Zhang, X. Zhao, H. Du, H. Fu, S. Zhang, T. Cheng, X. Yang, J. Shen, S. Hong, and L. Jiao: (2013) Observations of linear dependence between sulfate and nitrate in atmospheric particles. J. Geophys. Res. Atmos., 119, 341–361
Liu, X., J. Simunek, L. Li, and H. Junqi (2012) Identification of sulfate sources in groundwater using isotope analysis and modeling of flood irrigation with waters of different quality in the Jinghuiqu district of Chin. J. Environ. Earth Sci., 59, 1589-1600
Ljung, K. and M. Vahter (2007) Time to Re-evaluate the Guideline Value for Manganese in Drinking Water? Environ. Health Perspect., 115, 1533-1538
Mahato, S., A. Mahato, P.K. Karna, and N. Balmiki: ( 2018) Investigating aquifer contamination and groundwater quality in eastern Terai region of Nepal. BMC Res. Notes, 11, 321 . doi: 10.1186/s13104-018-3445-z
Miao, Z., M.L. Brusseau, K.C. Carroll, C.C. Diazconti, and B. Johanson: ( 2012 ) Sulfate reduction in groundwater: characterization and applications for remediation. Environ. Geochem. Health., 34, 539-550
Mora, A., J. Mahlknechet, L. Rosales-Lagarde, and A. Hernández-Antonio (2017) Assessment of major ions and trace elements in groundwater supplied to the Monterrey metropolitan area, Nuevo León, Mexico. Environ. Monit. Assess., 189, 394 https://doi.org/10.1007/s10661-017-6096-y
Nas, B. and A. Berktay (2005) Groundwater contamination by nitrates in the city of Konya, (Turkey): a GIS perspective. J. Environ. Manage., 79(1), 30-37
Okeola, F.O., O.D. Kolawole, O.M. Ameen: ( 2010) Comparative study of physico-chemical parameters of water from a river and its surrounding wells for possible interactive effect. Adv. Environ. Biol., 4, 336-340 .
Omer, E.O.M., A.A. Algamidi, I.M. Algamidi, A. Fedlelmula, and A.S.R. Alsubaie: ( 2014) The hygienic-related microbiological quality of drinking water sources Al-Baha Province, Kingdom of Saudi Arabia. J. Health Spec., 2 68 https://doi.org/10.4103/1658-600X.131753
Otu, R.A., J.B. Agyenim, and G.B.N Bumah:( 2014) Correlation analysis of groundwater colouration from mountainous areas, Ghana. Environ. Res. Eng. Manage., 1, 16-24 (2014).
Ozler, H.M. and A. Aydin: ( 2008) Hydrochemical and microbiological quality of groundwater in West Thrace Region of Turkey. Environ. Geol., 54, 355-363
Patil, P.N., D.V. Sawant, and R.N.( 2012) Deshmukh: Physico-chemical parameters for testing of water – A review. Int. J. Environ. Sci., 3, 1194-1207
Phan, K., S. Phan, L. Huoy, B.Suy, M.H. Wang, J.H. Hashim, M.S.M. Yasin, S.M. Aljunid, S. Sthiannopkao, and K.W. Kim ( 2013) Assessing mixed trace elements in groundwater and their health risk of residents living in the Mekong River basin of Cambodia. Environ. Pollut., 182, 111-119
RCER (2019) Drinking water quality standards. Environmental Control Department, Saudi Arabia. Available from: https://www.mwa.co.th/download/prd01/iDW_standard/Saudi_Arabia_Water_Standard_2015.pdf. Accessed on 14.10.2019.
Rezaei, A. and H. Hassani: ( 2018 ) Hydrogeochemistry study and groundwater quality assessment in the north of Isfahan, Iran. Environ. Geochem. Health., 40, 583-608
Ritzi, R.W., S.L. Wright, B. Mann, and M. Chen (1993) Analysis of temporal variability in hydro geochemical data used for multivariate analysis. Groundwater., 31, 221-229
Sakami, T., K. Abo, K. Takayanagi, and S. Toda: ( 2003) Effects of water mass exchange on bacterial communities in an aquaculture area during summer. Estuarine Coastal and Shelf Science, 56, 111-118
Salem, M.A. and M.I. Alshergawi: ( 2013) Physico-chemical evaluation of drinking water quality in Alshati district of Libya. J. Enviro. Sci. Toxicol. Food Technol., 4, 46-51
SASO: (2000) Standards of unbottled drinking water. Saudi Arabian Standards Organization, Riyadh, Saudi Arabia
Sethy, S.N., T.H. Syed, A. Kumar, and D. Sinha: ( 2016) Hydrogeochemical characterization and quality assessment of groundwater in parts of Southern Gangetic Plain. Environ. Earth Sci., 75, 232 https://doi.org/10.1007/s12665-015-5049-4
Shroff, P., R.T. Vashi, V.A. Champaneri, and K.K Patel: ( 2015) Correlation study among water quality parameters of groundwater of Valsad District of south Gujarat (India). J. Fundam. Appl. Sci., 7, 340-349
Szewzyk, U., R. Szewzyk, W. Manz, and K.H. Schleifer: ( 2000) Microbiological safety of drinking water. Annu. Rev. Microbiol., 54, 81-127
Van, B., W.D. Joode, B. Barbeau, M.F. Bouchard, A.M. Mora, A. Skytt, L. Córdoba, R. Quesada, T. Lundh, C.H. Lindh, and D. Mergler: ( 2016) Manganese concentrations in drinking water from villages near banana plantations with aerial mancozeb spraying in Costa Rica: Results from the Infants’ Environmental Health Study (ISA). Environ. Pollut., 215, 247-257
WHO: (1993) Guidelines for drinking-water quality. 2nd Edn., World Health Organization, Geneva, Switzerland
WHO: ( 2004) Guidelines for drinking water quality. 3rd Edn., World Health Organization, Geneva, Switzerland
WHO: ( 2008) Guidelines for drinking-water quality. Incorporating 1st and 2nd addenda. 3rd Edn., World Health Organization, Geneva, Switzerland
WHO. (2017). Guidelines for drinking water quality. 4th Edn., incorporating the first addendum. World Health Organization, Geneva, Switzerland
Yakubu, S: (2013) Assessment of water quality of hand-dug wells in Zaria LGA of Kaduna State, Nigeria. Int. J. Eng. Sci., 2, 01-04
Zogo, D., L.M. Bawa, H.H. Soclo, G.D. Boundjou, and D. Atchekpe: ( 2010) Effect of pre-chlorination on the efficiency of iron and manganese removal from surface water by coagulation-flocculation using aluminium sulphate: case of the Okpara dam in the Republic of Benin. Int. J. Biol. Chem. Sci., 4, 2093-2101

