1,3 and 5 Water Technology Centre, PJTSAU, Rajendranagar, Hyderabad, India
2M S Swaminathan School of Agriculture, Paralakhemundi, Centurion University of
Technology and Management (CUTM), Dist: Gajapati – 761211, Odisha, India
4Programme Planning & Evaluation Group (PPEG), NRSC, Hyderabad, India
Corresponding author email: t_l_neelima@yahoo.co.in
Article Publishing History
Received: 13/07/2020
Accepted After Revision: 15/09/2020
The Priyadarshini Jurala Project (PJP) is a multipurpose project across the river Krishna, located 18 km downstream of Telangana – Karnataka border (16020’15″E and 77042’15” N) on Krishna River in Telangana state falling in the Southern Plateau and Hill Agro-climatic region of India. Despite the importance of the irrigated area of the project, meager data is available on physico chemical properties and nutrient status PJP command area soils. To assess the soil physical and nutrient status of PJP command area, an investigation on soil fertility with respect to soil texture, pH, Texture, N, P2O5, and K2O was conducted by using standard procedures. The texture of soils of Jurala command area varied from sandy loam to sandy clay loam. The mean pH values for kharif ranged from 4.81 to 8.14 and 4.96 to 8.12 with an average value of 6.45 and 6.80, respectively under PJP right and left main canal command area. The EC of the surface soil samples (0-30cm) indicated that the soils of Jurala command area are non saline. The mean value of available nitrogen was 184 kg N ha-1 in the PJP right main canal and 201 kg N ha-1 in the PJP left main canal. The available nitrogen is low (< 280 kg N ha-1) in all soil samples. Out of the total samples collected in PJP right main canal, all the samples were high in available phosphorus whereas in the PJP left main canal 28, 25 and 47 per cent were low, medium and high in available phosphorus. In case of K2O, 75, 23 and 2 per cent and 75, 19 and 6 per cent of the samples were low, medium and high in available potassium in PJP right and left main canal. For paddy crop under PJP command area, application of nitrogen and potassium is essential and the level phosphorus need to be reduced.
Texture, pH, CEC, Available Nitrogen, Available Phosphorus, Available potassium
Neelima T. L, Reddy M. D, Devi M. U, Ramana K. V, Ramulu V. Assessment of Soil Nutrient status of Priyadarshini Jurala Irrigation Project Command Area. Biosc.Biotech.Res.Comm. 2020;13(3).
Neelima T. L, Reddy M. D, Devi M. U, Ramana K. V, Ramulu V. Assessment of Soil Nutrient status of Priyadarshini Jurala Irrigation Project Command Area. Biosc.Biotech.Res.Comm. 2020;13(3). Available from: https://bit.ly/31revDX
Copyright © Neelima et al., This is an open access article distributed under the terms of the Creative Commons Attribution License (CC-BY) https://creativecommons.org/licenses/by/4.0/, which permits unrestricted use distribution and reproduction in any medium, provide the original author and source are credited.
INTRODUCTION
The varied geological, physiographic and vegetation characteristics resulted in the development of soil types (Reddy and Govardhan, 2012). Success of any production system is dependent on proper management of the physical and chemical properties of soils and the changes affect the availability of nutrients to crops by influencing the physical and chemical environment of the soil. The knowledge of the soils in respect to their characteristics and classification is important for optimizing land and input use for getting higher production from unit area. Periodical assessment of soil physical and chemical properties is an important aspect as it determines the manner in which it is being used for crop production. After provision of water from year through PJP project, the farmers are cultivating rice crop with soil manipulation and application of fertilizers which may alter the nutrient status and reaction of soil. The agricultural management impacts will vary the soil nutrients depending on climatic conditions (Ninijamerina, et al., 2017) and may also leads to changes in the properties of the soil (Qihua et al 2018).
The Priyadarshini Jurala Project is a multipurpose project across the river Krishna, located 18 km downstream of Telangana – Karnataka border (16020’15″E and 77042’15” N) on Krishna River in earst while Mahabubnagar district in Telangana state falling in the Southern Plateau and Hill Agro-climatic region of India. The Jurala irrigation project was mainly designed for growing ID crops in an area of 14262.8 ha under RMC and 32474.9 ha under LMC, (culturable command area of 41,360 ha) but farmers are growing paddy to a large extent in the command area. Periodical assessment of soil data base is limited for PJP irrigation command area. The present study deals with the assessment of soil pH, CEC, N, P2O5 and K2O and soil texture of the command area of PJP project of Telangana in peninsular India as they help in soil fertility and productivity and in recommending proper nutrient application for higher yields without soil nutrient imbalances, which is required for judicious and scientific management of soil resources.
MATERIAL AND METHODS
Study area: The Priyadarshini Jurala Project is a multipurpose project across the river Krishna, near Revulapally village in Mahabubnagar district in Telangana falling in the Southern Plateau and Hill Agro-climatic region of India. It lies roughly between 16° – 17° North Latitude and 77° – 79° East Longitude. Mahabubnagar district is bounded by Karnataka state (West), Nalgonda district (East), Ranga Reddy district (North), and Kurnool district (South). The selected canals and distributaries at different locations and their salient features are presented below (Table 1).
Table 1. Salient features of the distributaries selected for soil analysis under PJP right and Left main canal
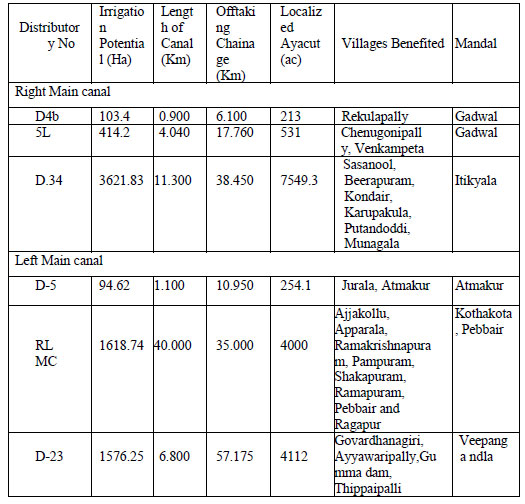
Collection of soil samples: Initially preliminary survey of the command area was conducted by moving through the right (50 km) and left (100 km) main canals. This process helped to know the number of working distributaries, their length and ayacut under cultivation under each distributary. Using the preliminary information, 64 number of representative soil samples were collected under different distributaries with GPS location point during 2009 and 2010. The samples collected from the distributary numbers are D4, 5L, D34 under Right main canal (RMC) and D5, Ramanpadu left canal, D23 under Left main canal (LMC) (Table 1).
The Physical and physico chemical properties of soil samples were analyzed for particle size analysis by Bouyoucos hydrometer method. The sand (2-0.05mm), silt (0.05-0.02mm) and clay (<0.02mm) fractions were calculated using hydrometer readings (Piper et al., 1966). The pH of soil was analyzed in 1:2.5 soil water suspension by using digital pH meter (Elico LI612 pH analyser) (Jackson, 1967) and the electrical conductivity was determined in the supernatant solution of 1: 2.5 soil water suspension as given by Jackson (1973) by using digital conductivity meter (Systronics Conductivity. – TDS meter 308μc).
The Chemical properties, available nitrogen were estimated by alkaline KMnO4 method where organic matter in the soil is oxidized with hot alkaline KMnO4 solution. The ammonia (NH3) evolved during the oxidation is distilled and trapped in boric acid mixed indicator solution. The amount of NH3 trapped is estimated by titration with standard acid (Subbaiah and Asija, 1956) using Kelplus supra Lx, Pelicon equipment. The available phosphorus was extracted by employing Olsen’s reagent (Olsen et al., 1954) and determined by Murphy and Riley method using ascorbic acid as reducing agent using spectrophotometer (Electronic corporation of India Ltd. V 5704). The available potassium was extracted with neutral normal ammonium acetate and was determined using Flame Photometer (Elico CL361) (Jackson, 1973).
RESULT AND DISCUSSION
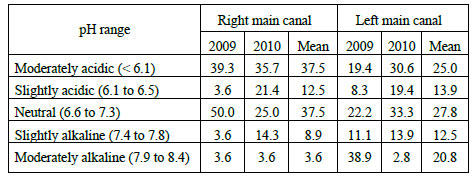
Success of any crop production is dependent on proper management of the physical and chemical properties of soils and those changes affect the availability of nutrients to crops. The texture of Jurala command area soils varied from sandy loam to sandy clay loam. The clay content ranged from 14 to 36 and 12 to 34 per cent, silt content ranged from 1 to 14 and 2 to 18 per cent and sand content ranged from 52 to 80 and 50 to 85 per cent in PJP right and left main canal respectively.The mean pH values for kharif 2009 and 2010 ranged from 4.81 to 8.14 and 4.96 to 8.12 with an average value of 6.45 and 6.80 under PJP right and left main canal command area. Out of the total samples collected, 46 and 25 per cent were moderately acidic (pH < 6.1) in nature, 50 and 65 per cent of the samples were slightly acidic to alkaline (pH = 6.1 to 7.8 ) and remaining samples were moderately alkaline (Table 2) in right and left main canal of Jurala command area (Table 2).
Table 2. Soil Physical and chemical properties of PriyadarshiniJurala Project right and left main canal.
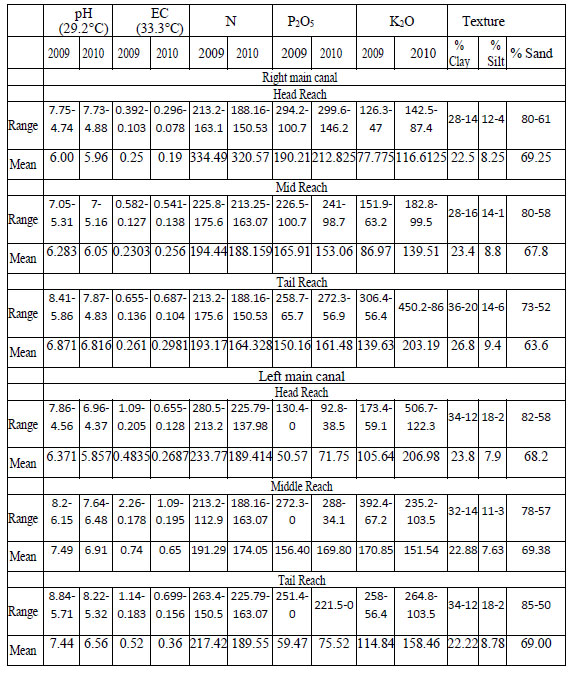
Table 3. Percent samples under particular pH range in PJP right and left main canal during kharif 2009 and 2010.
In the head reach distributaries of right (D4) and left (D5) main canal, 88 and 70 per cent of the samples were acidic in reaction (< 6.5) and the percentage of samples showing acidity decreased towards the tail reach (Fig 1). The soils of the command area changed from acidic to neutral in nature from head reach to tail reach in the command area.
Figure 1: Percent of samples in a particular pH range in selected distributaries of PJP right and left main canal
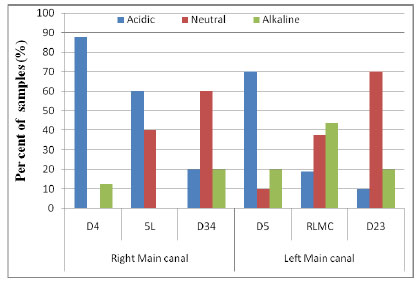
The pH value of a soil is influenced by the kinds of parent materials from which the soil was formed. Soils developed from basic rocks generally have higher pH values than those formed from acid rocks. Rainfall also affects soil pH. In the present study head reach distributaries are located in Gadwal and Atmakur mandals which received more rainfall than the other distributories. Water passing through the soil leaches basic nutrients such as calcium and magnesium from the soil. They are replaced by acidic elements such as aluminum and iron. For this reason, soils formed under high rainfall conditions are more acidic than those formed under arid (dry) conditions. Some soils are acidic by nature and in other cases low pH is the result of prolonged and intensive fertilization and irrigation (http://www.savvygardener.com).
The EC of the surface soil samples (0-30 cm) indicated that the soils of Jurala command area are non saline. The EC ranged from 0.103 to 2.26 and 0.078 to 1.090 dS m-1 with a mean of 0.423 and 0.335 dS m-1 during kharif 2009 and 2010 respectively (Table 2). This was because of heavy rainfall during kharif 2010 which led to leaching of bases from the soil surface suggesting that the accumulation of low amount of soluble salts results in low EC. Rajeswar et al., (2009) measured that EC values for Agriculture Research Station, Garikapadu, Andhra Pradesh soils varied from 0.10 to 0.32 dS m-1 due to loss of bases (Sidhu et al., 1994) attributing to heavy rain fall.
The available nitrogen during kharif 2009 and 2010 ranged from 163 to 225 and 150 to 213.3 kg N ha-1 with a mean value of 193 and 177 kg N ha-1 in the PJP right main canal and it ranged from 113 to 280 and 138 to 225 N ha-1 with a mean value of 216 and 186 kg N ha-1 in the PJP left main canal respectively. The available nitrogen is low (< 280 kg N ha-1) in all soil samples.In semi arid climatic condition, the available N status is commonly low and the soils are mostly coarse textured. Further, the organic matter addition to paddy soils is limited in the command area. The available nitrogen status of the study area low in all the samples as nitrogen being mobile in nature, the residual/ available N becomes poor in soils due to its losses through various mechanisms (Kumar, et al. 2014). Similar results were also reported by Yeledhalli et al. (2008) in sandy loam soils of Karnataka and Vasu et al. (2016) reported low available nitrogen in cotton growing soils of Mahabubnagar district, Sreeramsagar project and NSP left canal command area of Andhra Pradesh (Bhaskar Rao et al., 2002 and Rajeswar et al., 2009).
The available phosphorus during kharif 2009 and 2010 ranged from 65 to 294 and 57 to 299 kg P2O5 ha-1 with a mean value of 166 and 170 kg P2O5 ha-1 in the PJP right main canal and it ranged from 24 to 272 and 20 to 288 kg P2O5 ha-1 with a mean value of 78 and 95 kg P2O5 ha-1 in the PJP left main canal respectively.Out of the total samples collected in PJP right main canal, all the samples were high in available phosphorus whereas in the PJP left main canal 28, 25 and 47 per cent were low, medium and high in available phosphorus respectively (Table 4). High available phosphorus in most of the soil samples under the command area was mainly due to indiscriminate use of P containing complex fertilizers like DAP, 17-17-17, 28-28-0 20:20:0, 19:19:19, 17:17:17, 12:32:18 or 14:28:28 by paddy growers of this region. For top dressing also, these complex fertilizers are used.
Analysis of large number of soil samples indicated that there is buildup of soil Phosphorus, especially in the top few cm of soil (Arévalo-Gardini, et al. 2015).Because of this, the response to applied phosphorus in paddy soils of PJP was low of not observed (Neelima et al., 2013) and also the submergence of rice field increases the availability of phosphorus. It has been reported that the change in soil Olsen P was positively linearly correlated with the P budget (P < 0.01) in the 0–20 cm soil layer (Arévalo-Gardini et al. 2015). A model of P fertilizer recommendation rate that integrates values of the change in soil Olsen P in response to P budget need to be made for efficient use of P fertilizer (Qihua Wu et al. 2018).
Table 4. Percent samples showing range of available phosphorus and potassium content in PJP right and left main canal
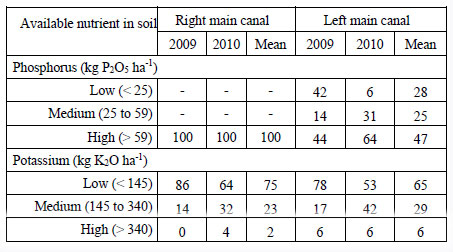
Available potassium varied from 47 to 392 and 56 to 470 kg K2O ha-1 with a mean value of 115 and 138 kg K2O ha-1 during kharif 2009 and 2010. The available potassium ranged from 47 to 306 and 56 to 367 kg K2O ha-1 with a mean value of 111 and 132 kg K2O ha-1 in the PJP right main canal and it ranged from 56 to 392 and 67 to 470 kg K2O ha-1 with a mean value of 124 and 149 kg K2O ha-1 in the PJP left main canal during kharif 2009 and 2010. Out of the total samples collected; 75, 23 and 2 per cent and 65, 29 and 6 per cent of the samples were low, medium and high in available potassium in PJP right and left main canal (Table 4).
Similar findings were observed by Kalyani et al. (2014) in Ranga Reddy district of Telangana state. Adequate (medium or high) available K in soils may be attributed to the prevalence of potassium-rich minerals like Illite and Feldspars (Sharma, et al., 2008). Potassium fixing capacity of soils is an important factor based on which K recommendations are given apart from available K status of soils. The K fixing capacity of soils depend on several factors like soil texture, type of clay minerals, potassium content in soils etc (Chaitanya et al. 2017) as these soils are sand and sandy loam in texture with low clay content. In general almost all the soils showed low potassium fixing capacity, generally the crop response to K application is expected, where the soils are low in available potassium. But, there are reports, where crop response to K fertilization is positive even in soils high in K status. Further, Potassium is low in soils with less organic matter and application of potassium fertilizers to the crop might have led to lower exchangeable potassium in soils (Chahal et al. 1976).
CONCLUSION
The texture of soils of Priyadarshini Jurala command area varied from sandy loam to sandy clay loam having an average value of 6.45 and 6.80, respectively under PJP right and left main canal command area and is non saline. The available nitrogen is low (< 280 kg N ha-1) in all soil samples. In PJP right main canal, all the samples were high in available phosphorus whereas in the PJP left main canal 28, 25 and 47 per cent were low, medium and high in available phosphorus. The available potassium in 75 per cent of the samples was low. These results suggest that under
Priyadarshini Jurala Project command, there is need to apply Nitrogen and potassium to meet the rice crop requirements and the level phosphorus need to be reduced.
REFERENCES
Arévalo-Gardini E, Canto M, Alegre J, Loli O, Julca A, Baligar V (2015) Changes in Soil Physical and Chemical Properties in Long Term Improved Natural and Traditional Agroforestry Management Systems of Cacao Genotypes in Peruvian Amazon. PLoS ONE 10(7): e0132147. oi:10.1371/journal.pone.0132147
Bhaskar Rao, B. R., Shantatam, M. V., Reddy, K. C. R and Maruthi Sankar. (2002). Soil fertility evaluation of Sreeramsagar Project Command area in Andhra Pradesh. Journal of Research ANGRAU. 30(2): 45-55.
Chahal, R. S., Sangwan, O. P and Bharat, S. (1976). Forms of potassium in some groundnut growing soils of Ambala and Gurgaon districts (Haryana). Bulletin of Indian Society of Soil Science. 10: 61-65.
Chaitanya T., Padmaja G. And Rao P.C. (2017). Salient Soil Characteristics And Potassium Fixation In Vegetable Growing Soils Of Ranga Reddy And Mahaboobnagar Districts Of Telangana. International Journal Of Agriculture Sciences Volume 9 (16) 2017 : 4128- 4132.
Jackson, M. L. 1967. Soil Chemical Analysis. Prentice Halls of India Pvt. Ltd. New Delhi.
Jackson, M. L. 1973. Soil chemical analysis. Printice Hall of India Pvt. Ltd. New Delhi.
Kalyani, K., Sailaja, V and Chandrasekhar Rao, P. (2015). Potassium fractions in soil and response of Cauliflower (Brassica oleracea var. Botrytis) in coarse textured soils of Ranga Reddy district. Journal of the Indian Society of Soil Science, 63 (1): 69-74.
Kiran Reddy, K. and V. Goverdhan. (2012). Characterization and classification of soil and land resource environs of Nagarjuna Sagar left bank command areas of Nalgonda district. J.Res. ANGRAU 40(4): 57- 61.
Kumar, A., Mishra, V.N., Srivastav, K and Rakesh, B. (2014). Evaluation of soil fertility status of available major nutrients (N, P & K) and Micro nutrients (Fe, Mn, Cu & Zn) in vertisol of Kabberdham district of Chhattisgarh, India. International Journal of Interdisciplinary and Multidisciplinary Studies, 1 (10): 72-79.
Neelima, T. L., Ramana, M. V. and Devender Reddy, M. 2013. Spatial and temporal rice yield variation in Jurala Irrigation Project using Remote Sensing and GIS . Scholarly Journal of Agricultural Science Vol. 3(7),: 274-283
Ninijamerina, R.,Sashikkumar, M. C., Catherine Dhanya V., Rizvana, N. ( 2017).Assessment of Physico- Chemical Characteristics of the Soil in Vaigai Reservoir, Tamilnadu, India . International Journal of ChemTech Research Vol.10 No.1 pp 110-115.
Olsen, S. R., Cole, C. V., Watanabe, F. S and Dean, L. A. (1954). Estimation of phosphorous in soils by extraction with sodium bicarbonate. United States Department of Agriculture, Circular 939, USDA, Washington DC.
Piper, C. S. (1966). Soil and plant analysis. Hans Publishers, Bombay.
Qihua Wu, Shuxiang Zhang,Yi Ren,Xiaoying Zhan,Minggang Xu & Gu Feng. (2018). Communications in Soil Science and Plant Analysis . Soil Phosphorus Management Based on the Agronomic Critical Value of Olsen P. Volume 49, (8): 934-944. https://doi.org/10.1080/00103624.2018.1448410
Rajeswar, M., Sujini Rao, C.H., Balaguravaiah, D. and Aariff Khan, M. A. (2009). Distribution of available macro and micronutrients in soils of Garikapadu of Krishna district of Andhra Pradesh. Journal of the Indian Society of Soil Science 57 (2): 210-213.
Reddy, G.K. and Goverdhan, V. (2012). Characterization and classification of soil and land resource environs of Nagarjuna Sagar left bank command areas of Nalgonda district. J.Res. ANGRAU 40(4) 57- 61, 2012
Sharma, P.K., Sood, A., Setia, R.K., Tur, N.S., Mehra, D and Singh, H. (2008) Mapping of macronutrients in soils of Amritsar district (Punjab) A GIS approach. Journal of Indian Society of Soil Science, 56 (1): 34-41.
Sidhu, P. S., Raj Kumar and Sharma, B. D. (1994). Characteristics and classification of Entisols in different moisture regimes of India. Journal of the Indian Society of Soil Science. 42: 633-640.
Subbaiah, B. V and Asija, G. L. (1956). A rapid procedure for estimation of available nitrogen in soils. Current Science. 25: 259-260.
Vasu, D., Singh, S.K., Duraisami, V.P., Jangir, A and Butte, P.S. (2016). Fertility status of cotton (Gossypium hirsutum) growing soils in Thimmajipaet mandal, Mahabubnagar district, Telangana state. Andhra Pradesh Journal of Agricultural Sciences, 2 (1): 10-15.
www.savvygardener.com
Yeledhalli, N.A., Prakash, S.S and Ravi, M.V. (2008). Productive potential of soils of Tungabhadra project area for Bt cotton. Karnataka Journal of Agricultural Sciences, 21 (1): 35-37.

