University College, Addarb, Jazan University, Jazan Saudi Arabia, Postal Code 45412
Corresponding author Email: ruqayajabeen@gmail.com
Article Publishing History
Received: 22/07/2019
Accepted After Revision: 26/09/2019
Ten plant species from the roads with heavy traffic in Abha Saudi Arabia were collected and studied for their phytomonitoring potential by calculating their Air Pollution Tolerance Index (APTI). Physiological as well as the biochemical parameters like Relative Water Content (RWC), Ascorbate Content, leaf extract pH as well as the Total Chlorophyll Content (Chl) were used to calculate the APTI values. Bougainvillea glabra and Ricinus communis plants showed highest tolerance to vehicular pollution, Shinus molle, Catharanthus roseus, Hibiscus rosa-sinensis, Myoporum pictum, Juniperus procera, Phoenix caespitora showed moderate tolerance while as Tagetes tanuifolia and Vitis vinefera were least tolerant species, thus making Bouganivillea glabra and Ricinus communis plants the ideal candidates to be used for green belt development in Abha region of Saudi Arabia.
Air Pollution Tolerance Index (APTI), Air pollution, Ascorbic acid, Plantation program
Jabeen R. Air Pollution Tolerance Index (APTI) of Some Plants Growing on the Roads of Abha, Saudi Arabia. Biosc.Biotech.Res.Comm. 2019;12(3).
Jabeen R. Air Pollution Tolerance Index (APTI) of Some Plants Growing on the Roads of Abha, Saudi Arabia. Biosc.Biotech.Res.Comm. 2019;12(3). Available from: https://bit.ly/2lBprwz
Copyright © Jabeen, This is an open access article distributed under the terms of the Creative Commons Attribution License (CC-BY) https://creativecommns.org/licenses/by/4.0/, which permits unrestricted use distribution and reproduction in any medium, provide the original author and source are credited.
Introduction
Pollution, particularly the atmospheric pollution has emerged as one of the leading problems that has resulted from the rising human population and the industrialization (Odilara et al. 2006). Air pollutants including the particulate matter (PM), the vehicular exhausts as well as the industrial emissions result in deteriorating health effects in humans, create disturbances in plant ecosystem in addition to the global impact by changing the atmosphere (Raabe et al., 1999).According to the World Health Organization estimates, that air pollution results in around a million premature infant deaths around the world (Litchfield et al., 2018).
The fast urbanization and industrialization in the kingdom of Saudi Arabia has led to environmental concerns due to the heavy traffic and industrial activities. Experts at King Abdul Aziz University (KAU) have estimated that the consumption of benzene and diesel in the kingdom is 811,000 barrels every day for the 12 million cars that ply on the Saudi Arabian roads. Vehicular pollution is the major contributor of air pollution in Saudi Arabia, because of majority of population (which experts put at 95%) use cars and the population in Saudi Arabia was 32.94 million in 2017. Air Pollution Tolerance Index (APTI) is an inherent quality of plants to encounter air pollution stress. Owing to the contributions of parameters like ascorbic acid, the chlorophyll content, relative water contents as well as the leaf-extract pH in the pollution tolerance in plants, these parameters were computed together in a formulation to obtain an empirical value signifying the air pollution tolerance index (APTI) of species, (Singh and Rao, 1983 Aghaiee et al., 2019, Bellini and Tullio 2019 Manjunath and Reddy 2019).
To measure the air pollution tolerance indices of different plant species has become necessary owing to the increasing air pollution in urban localities. The Categorization of pants species as sensitive and tolerant has huge importance as the susceptible plant species can be used to serve as indicators while as the tolerant ones can work as sinks to monitor the air pollution in urban areas (Singh et al., 1991, Aghaiee et al., 2019). World-Wide significant work has been done to identify the plants suitable for phytomonitoring the vehicular pollution but nothing significant has been done to see the phytomonitoring capacity of Saudi Arabian flora. So this research aims at screening the Air Pollution Tolerance of Saudi Arabian flora to know about the susceptible and tolerant Plant species.
Material and Methods
Study Area
Abha city is situated in the south of Asir elevated at 2270 meters above sea level. It is located on the western edge of Mount al-Hijaz near the mount Alsouda, which is considered to be the highest mountain peak in Saudi Arabia.
The climate of Abha city is cold and semi-arid and the temperatures are influenced by the city’s high altitude.
Bougainvillea glabra, Ricinus communis, Shinus molle, Catharanthus roseus, Hibiscus rosa-sinensis, Myoporum pictum, Juniperus procera, Phoenix caespitora, Tagetes tanuifolia and Vitis vinefera plant species from Abha city were collected near traffic signals of Abha city for Polluted site while as the same plants were selected from garden away from the road which served as Control. The mature leaves were sampled from all the plant species. Collected leaves were packed in polythene bags and immediately stored in ice box for the analysis of various biochemical characteristics like total chlorophyll, ascorbic acid, pH of leaf extract, and relative water content. All the experiments were done in triplicate. The sampled leaves were analyzed in laboratory for their ascorbic acid content, Total chlorophyll, and Relative Water Content (RWC) as well as Leaf extract pH.
Ascorbic Acid Content
Leaf ascorbic acid content was calculated by the method of Bajaj and Kaur (1981) 4 ml oxalic acid-EDTA (0.05M oxalic acid, 0.2 M EDTA) was added to one gram leaf. To this one ml of o-phosphoric acid and 1ml sulphuric acid was added. 2ml of ammonium molybdate as well as 3ml of water were added to the mixture. The reaction was left alone for 15 minutes and later the OD was taken at 760 nm.The concentration of ascorbic acid in samples was then calculated from a standard ascorbic acid curve. For this 0.1 ml to 0.6 ml aliquots of standard ascorbic acid solution was taken in a series of test tubes and chemicals were added as before. After incubation period, absorbance was measured at 760 nm and standard graph was prepared.
pH
To determine the leaf extract pH, a 2 g leaves were ground in 20 ml de-ionized water and the reading was taken in a pH meter after filtration of the liquid.
Relative Water Content (RWC)
The relative water content (RWC) was determined following the method of Singh et al. (1991). Fresh leaves (FW) were weighed to determine the fresh weight. The turgid weight (TW) was calculated by immersing the leaves in water over night, while as the dry weight (DW) after drying in the oven at 700 C was calculated at dry weight.
RWC= (FW-DW/TW-DW) x100.
Total Chlorophyll Content
The Total chlorophyll content in the leaves was analysed by the method of Hiscox and Israelstam (1979). The method recommends the evaluation of plant pigments. Washed leaves were chopped and 0.1g was put in vials. A volume of 5ml from dimethyl sulfoxide (DMSO) was put in these vials. The plant samples with chemicals were incubated at 65˚ C to extract the pigments. Thereafter, the vials were taken out and the OD was recorded at 663, 645 nm on Uv-Vis spectrophotometer. Values of optical densities (ODs) were used to compute the total chlorophyll contents by using the following formulae given in Arnon (1949).
Air Pollution Tolerance Index
The APTI values were calculated by the formula of Singh and Rao (1983). APTI= A (T+ P) + R/10 A signifies the leaf ascorbic acid content (mg g-I FW), T is the leaf total Chlorophyll (mg g- FW), P is the pH of leaves, and R is the percentage relative water content of leaf tissue.
Results and Discussion
Ascorbic Acid Content
The Ascorbic Acid Content of the plant species is given in Fig 1. Ricinus communis showed the highest ascorbic content while as the Vitis vinefera showed the lowest Ascorbic acid content. Ascorbic acid an antioxidant is present in all growing plant parts to prevent the plant from various types of stress. Ascorbic acid is said to be able to decrease the amount of ozone penetrating the cell wall to reach the plasma membrane (Roshchina and Roshchina, 2013, Bellini and Tollulio 2019). Ascorbic acid also has a role in carbon fixation in the process of photosynthesis where it works as a reducing agent (Pasqualini et al 2001, Wheeler et al., 2015). Plants have been researched to have a decline in ascorbic acid under pollution (Keller and Schwager, 1977). Increased ascorbic acid content in plants despite after being under pollution stress, therefore, indicates the high tolerance in the plant against the pollution (Singh et al. 1991, Manjunath and Reddy 2019).
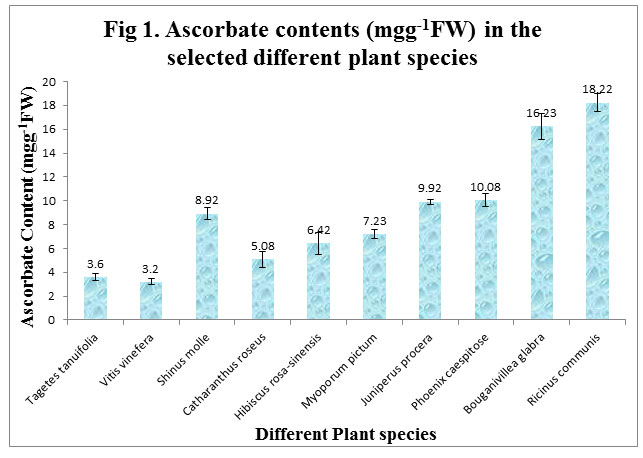 |
Figure 1 |
pH of leaves
The leaf extract of the plant species is given in Fig 2. Ricinus communis has the highest pH of 7.11 while as Myoporum pictum has the lowest pH of 5.32. Elevated pH in plant leaves has a role in conversion from hexose sugar to Ascorbic Acid (Escobedo, 2008) while as decreased pH is thought to be associated sensitivity to air pollution. Bharti et al. (2018) and Rathore et al. (2018) are of the opinion that the exposure of leaves to acidic pollutant like Sox and NOx result in decrease in the leaf pH and this decrease is more prominent in the sensitive plants in comparison to the tolerant ones.
 |
Figure 2 |
Total Chlorophyll Content
Total Chlorophyll Contents ranged from 0.84 mgg-1 FW in Tagetes tanuifolia to 6.32 mgg-1FW in Hibiscus rosa-sinensis. Total chlorophyll content of leaves has been used commonly for evaluation of the effect of air pollutants on photosynthesis rate in plant leaves (Sharma et al., 2019). Total Chlorophyll is thought to be an index of growth, photosynthetic activity and biomass production. Kameswaran et al. (2019) are of the opinion that the plant tolerance to the SO2 from vehicular exhaust might be responsible for decreased chlorophyll synthesis or degradation in the already present chlorophyll content, thereby, suggesting that the plants with a high chlorophyll content even after subjected to vehicular pollution are usually tolerant to the pollutants.
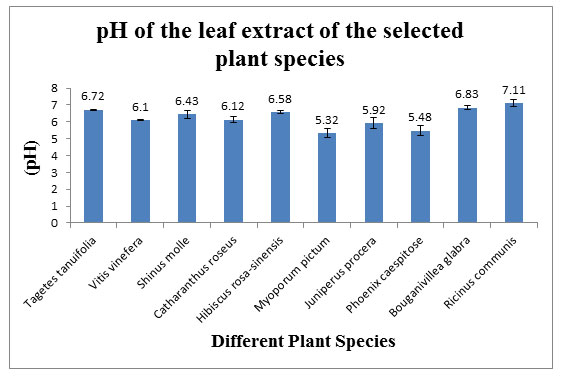 |
Figure 3 |
Relative Water Content (RWC)
The Relative Water Contents of the plant species are shown in Fig 4. Ricinus communis showed the greatest RWC (92.15%) while as the Hibiscus rosa-sinensis (41.15%) showed the least RWC. High Relative water content (RWC) in the leaves helps plants in the maintenance of the physiological balance under stress conditions. So a high value of RWC means a high resistance to stress in plants (Aghaiee et al., 2019).
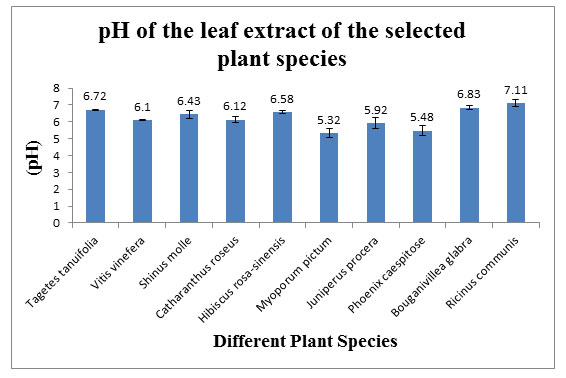 |
Figure 4 |
Air Pollution Tolerance Index (APTI)
The APTI values of the selected plant species is shown in Fig 4. Bougainvillea glabra and Ricinus communis plants showed highest APTI values, Shinus molle, Catharanthus roseus, Hibiscus rosa-sinensis, Myoporum pictum, Juniperus procera, Phoenix caespitora showed moderate values while as the Tagetes tanuifolia and Vitis vinefera plants showed the least APTI value. The APTI values offer a credible method to screen the flora of any location for their tolerance and susceptibility to vehicular pollution. Plants with APTI value ≤11 are considered to be sensitive, while those with APTI value ranged from 12 to 16 classified as intermediate, and APTI value of ≥17 are known to be tolerant (Bharti et al., 2018, 1991).
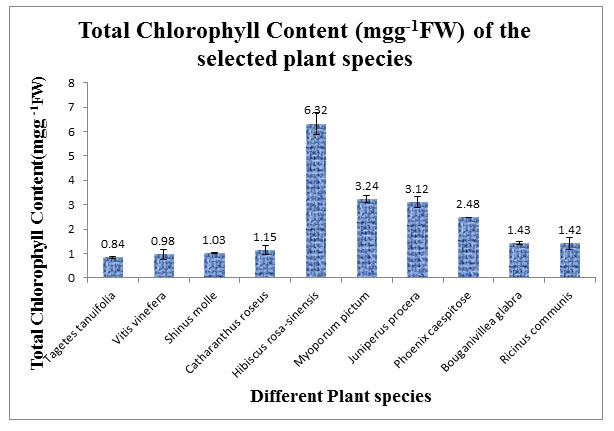 |
Figure 5 |
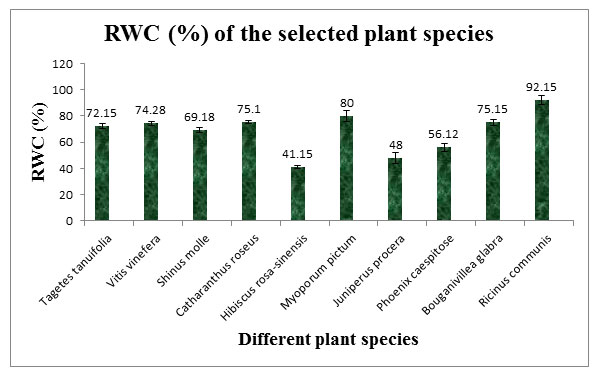 |
Figure 6 |
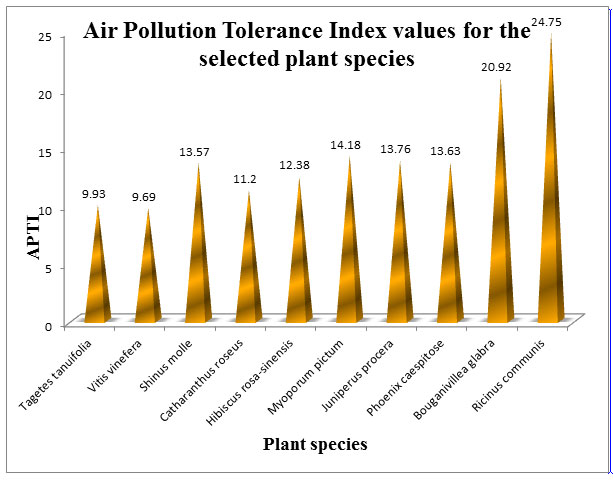 |
Figure 7 |
Conclusions
The APTI values were in the order Ricinus communis (24.75)>Bougainvillea glabra (20.92)>Myoporum pictum(14.18)> Juniperus procera (13.76)> Phoenix caespitora (13.63)> Shinus molle (13.57)> Hibiscus rosa-sinensis (12.38)> Catharanthus roseus (11.2)> Tagetes tanuifolia (9.93) >Vitis vinefera (9.69). This study is very important to choose tolerant species suitable to monitor the vehicular pollution in Saudi Arabia.
Acknowledgement
The author duly acknowledges the various administrators, specially, the Dean of the University College, Addarb Jazan, Kingdom of Saudi Arabia for all the facilities provided to carry out this work.
References
Aghaiee, N., Zarei, L., & Cheghamirza, K. (2019). Evaluation of some morpho-physiological characteristics in strawberry under different moisture stress regimes. Journal of Berry Research, (Preprint), 1-11.
Arnon DI (1949). Copper Enzymes in Isolated Chloroplasts. olyphenoloxidase In Beta vulgaris. Plant Physiology 24(1): 1–15.
Bajaj KL, Kaur G (1981). Spectrophotometric Determination of L. Ascorbic Acid in Vegetables and Fruits. Analyst 106:117-120.
Bellini, E., & De Tullio, M. C. (2019). Ascorbic acid and ozone: Novel perspectives to explain an elusive relationship. Plants, 8(5), 122
Bharti, Sushil Kumar, Arti Trivedi, and Narendra Kumar (2018) Air pollution tolerance index of plants growing near an industrial site. Urban climate 24 820-829.
Escobedo FJ, Wagner JE, Nowak DJ, et al. (2008). Analyzing the cost effectiveness of Santiago, Chile’s policy of using urban forests to improve air quality, Journal of Environmental Management 86: 148-157.
Hiscox JD, Israelstam GF (1979).A method for the extraction of chlorophyll from leaf tissue without maceration. Canadian Journal of Botany 57(12): 1332-1334.
Kameswaran, S., Gunavathi, Y., & Krishna, P. G. (2019). Dust pollution and its influence on vegetation–a critical analysis.
Keller T and Schwager H (1977). Air pollution and ascorbic acid. European Journal of Forest pathology 7:338-350.
Manjunath, B. T., & Reddy, J. (2019). Comparative evaluation of air pollution tolerance of plants from polluted and non-polluted regions of Bengaluru. Journal of Applied Biology & Biotechnology Vol, 7(03), 63-68.
Odilara CA, Egwaikhide PA, Esekheigbe A, Emua SA. (2006). Air pollution tolerance indices (APTI) of some plant species around llupeju industrial area, Lagos. Journal of Engineering Science and Applications 4(2): 97-101.
Pasqualini S, Batini P, Ederli L, et al (2001). Effects of short-term ozone fumigation on tobacco plants: response of the scavenging system and expression of the glutathione reductase, Plant Cell Environment 24:245-252.
Raabe OG (1999). Respiratory exposure to air pollutants. In: Swift DL, Foster WM, editors. Air Pollutants and the Respiratory Tract. New York, USA: Marcel Dekker Inc.
Rathore, D. S., Kain, T., & Gothalkar, P. (2018). A study of air pollution status by estimation of APTI of certain plant species around Pratapnagar circle in Udaipur city. International Journal of Agriculture, Environment and Biotechnology, 11(1), 33-38
Roshchina, V.V., Roshchina, V.D., (2013). Ozone and Plant Cell. Springer Science & Business Media.
Sharma, M. L., Pandey, A. C., & Goswami, N. (2019). Chemical Estimation of Air Pollutants and its impact on the Total Chlorophyll contents a and b of Adhatoda vasica and Aloe vera Plants. Asian Journal of Research in Chemistry, 12(2), 75-78.
Singh SK, Rao DN, Agrawal M, Pandey J and Narayan D (1991). Air Pollution Tolerance Index of Plants. Journal of Environmental Management 32: 45-55.
Singh SK and Rao DN (1983). Evaluation of plants for their tolerance to air pollution. In Proceedings of the Symposium on Air Pollution Control pp. 218-224.
Wheeler G, Ishikawa T, Pornsaksit V, Smirnoff N (2015) Evolution of alternative biosynthetic pathways for vitamin C following plastid acquisition in photosynthetic eukaryotes. eLife 4:e06369

