1King Saud University, Riyadh, Saudi Arabia;
2Northumbria University, Newcastle, UK
Corresponding author email: dalsaeed@ksu.edu.sa
Article Publishing History
Received: 18/07/2020
Accepted After Revision: 12/09/2020
Retinal blood vessel structure is an important feature for computer-aided diagnosis and treatment of diseases including diabetic retinopathy, hypertension, glaucoma, obesity, arteriosclerosis and retinal artery occlusion, and an accurate extraction is required to improve the accuracy of the diagnostic task. This paper proposes a new algorithm for blood vessel segmentation and extraction in retinal images. A multiscale matched filter combined with local features is developed to effectively extract blood vessels from retinal images. Local features are extracted from a circular and adaptive window around a candidate blood vessel pixel. Experimental evaluation using publicly available DRIVE and STARE databases shows accurate extraction of vessel networks as demonstrated by improved false alarm rates and segmentation accuracy when compared against existing works.
The mean true positive rate (TPR) values obtained are (0.7661%) and (0.6312 %) for STARE and DRIVE datasets respectively, while the mean false positive rate (FPR) values achieved are (0.0311 %) for STARE and (0.0183 %) for DRIVE. Moreover, our proposed method gave high accuracy values when compared to similar work on same datasets, 93.53% and 94.73% for STARE and DRIVE datasets respectively. While in the cases of methods achieving higher accuracy value than ours, we either have a higher TPR or a lower FPR. These promising results can be enhanced in the future by deploying some other features and/or experimenting different thresholding techniques. In addition to the detection of blood vessels from retinal images, there is ongoing work to develop a quantitative method based on the shape and regularity of the blood vessels detected in order to detect possible signs / symptoms of a disease.
Multiscale matched filters, Retinal imagery, Blood vessel extraction, Adaptive thresholding
AlSaeed D, Bouridane A, Jafri R, Al-Ghreimil N, Al-Baity H. H, Alhudhud G. A Novel Blood Vessel Extraction Using Multiscale Matched Filters with Local Features and Adaptive Thresholding. Biosc.Biotech.Res.Comm. 2020;13(3).
AlSaeed D, Bouridane A, Jafri R, Al-Ghreimil N, Al-Baity H. H, Alhudhud G. A Novel Blood Vessel Extraction Using Multiscale Matched Filters with Local Features and Adaptive Thresholding. Biosc.Biotech.Res.Comm. 2020;13(3). Available from: https://bit.ly/32UwXWW
Copyright © AlSaeed et al., This is an open access article distributed under the terms of the Creative Commons Attribution License (CC-BY) https://creativecommons.org/licenses/by/4.0/, which permits unrestricted use distribution and reproduction in any medium, provide the original author and source are credited.
INTRODUCTION
An accurate extraction of retinal vascular tree is an important task in computer aided diagnosis of retinopathy. The literature shows that there are several methods for retinal vascular tree extraction (vessel extraction) with different approaches. Based on several reviews and surveys Kirbas & Quek (2004, 2003); Mabrouk, Solouma, & Kadah (2006); Mansuri (2011), blood vessel segmentation algorithms can be divided into six main categories, which are : pattern recognition techniques, model-based approaches, tracking-based approaches, artificial intelligence-based approaches, and miscellaneous tube-like object detection approaches. Multiple techniques from the above categories are also combined and used together to solve different segmentation problems.Retinal vessels are affected by some diseases such as: diabetic retinopathy, hyper- tension, glaucoma, obesity, arteriosclerosis and retinal artery occlusion. Such diseases are diagnosed by studying and observing the retinal vascular tree Gao et al. (2001, Kocayigit et al 2020).
Pattern recognition techniques for retinal blood vessel detection can be further di- vided into the following categories Kirbas & Quek (2003): (i) multiscale approaches, (ii) skeleton-based approaches, (iii) region growing approaches, (iv) ridge-based ap- proaches, (v) differential and mathematical geometry-based approaches and (vi) matching filters approaches.
The proposed method in this paper aims to develop a more accurate extraction of the blood vessels in each region of the tree with a view to enhance the detection accu- racy while still reducing the false alarm rates. To achieve this, we propose to modify and extend the MF approach by using multiscale match filters and by incorporating some local features. Unlike existing methods, it can be observed that a multiscale filter approach enhances the detection of small blood vessels, and by incorporating local features some confidence measures are added for a more accurate blood vessel detection. This paper is organized as follows: Section 2 gives a brief overview on the matched filter approach for retinal image segmentation. Section 3 introduces the pro- posed method while Section 4 describes the experiments carried out. The results are discussed in Section 5 including a comparative study against other methods. Finally, Section 6 concludes the paper.
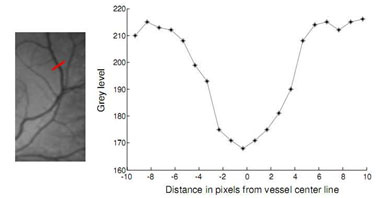
Figure 1: Profile of a cross section of a blood vessel
Blood vessel extraction using MF approaches convolve the image with multiple matched filters Chaudhuri, Chatterjee, Katz, Nelson, & Goldbaum (1989). Designing matched filters with different orientations and sizes plays a crucial role in such methods. MFs are usually followed with some other image processing operations like thresholding to get the final vessel contours.The original work on matched filters was proposed by Chaudhuri et al. Chaudhuri et al. (1989), in which they introduced matched filters to enhance blood vessel in the image and suggested using a proper thresholding scheme to distinguish between vessel and background; in their work they have used the Otsu method Otsu (1979) for thresholding.Hoover et al. Hoover, Kouznetsova, & Goldbaum (2000) combine local and region- based properties to segment blood vessels in retinal images. The method thresholds the matched filter response (MFR) Chaudhuri et al. (1989) using a probing technique. Classifying pixels in an area of the MFR as vessels and non-vessels is done by iteratively decreasing the threshold. At each iteration, the probe examines the region-based attributes of the pixels in the tested area and segments the pixels classified as vessels. Pixels that are not classified as vessels from probes are recycled for further probing. Hoover et al. have collected a database of 20 manually labeled images (STARE database), which is publicly available together with the results of their method.
Cinsdikici et al.(2009) proposed a (MF/ant algorithm) method as a hybrid model of matched filter and ant-based clustering aiming to im- prove the accuracy and false/true ratios performance of blood vessel detec- tion. They have tested their algorithm on 20 images from the DRIVE database Staal, et al (2004). Zhang et al.(2010), proposed combining the matched filter with first-order derivative of the Gaussian (MF-FDOG), as an extension and generalization of the MF. They used first-order derivative of Gaussian in order to reduce the problem of strong response of Matched Filter in non-vessel edges which could achieve much higher vessel detection accuracy than the MF alone. This method was tested on 20 images from each of STARE and DRIVE databases Hoover et al. (2000); Staal et al. (2004).
Dalmau et al. Dalmau & Alarcon (2011), worked on enhancing detection accuracy by working on the thresholding technique. Instead of using a threshold directly, they relax an automatically obtained threshold value in order to obtain two thresholds: one for the object (vessels) and the other for the background (non-vessels). After applying both thresholds, they use a Cellular Automata Vezhnevets & Konouchine (2005) as segmentation method. They have tested their method on both STARE and DRIVE databases Hoover et al. (2000); Staal et al. (2004) with 20 images from each. Staal et al. (2004), and Jiang and Jiang & Mojon (2003) are well-known methods which are not based on matched filters, but related to our work in a sense that they are all considered as rule-based. Staal et al. (2004), worked on extraction of image ridges, which coincide approximately with vessel centerlines. The ridges are used to compose primitives in the form of line elements, an image is partitioned into patches by assigning each image pixel to the closest line element. Every line element constitutes a local coordinate frame for its corresponding patch.
For every pixel, feature vectors are computed that make use of properties of the patches and the line elements. The feature vectors are classified using a KNN-classifier and sequential forward feature selection. For testing their method on a large database, they have constructed the DRIVE database of 40 manually labeled images, divided into two sets for training and testing. They also tested their method on STARE database Hoover et al. (2000). Their database is publicly available (DRIVE database), and has been widely used for experiments. Jiang and Mojon (2003) proposed a general framework of adaptive local thresholding based on a verification-based multi-threshold probing scheme. Object hypotheses were generated by binarization using hypothetic thresholds and accepted/rejected by a verification procedure. Their proposed algorithm was applied on blood vessel extraction; Their proposed method shared with Hoover et al. who used threshold probing. The method was tested on DRIVE database Hoover et al. (2000) had compared results to global thresholding.
Retinal Segmentation Using Matched Filters (MF): MF was first proposed by Chaudhuri et al (1989) to detect vessels in retinal images. It was based on the assumption that the cross-section of the vessels can be approximated by a Gaussian function. A vessel segment and the local gray level distribution is shown in Fig. 1. One can see that the vessel sectional profile can be assumed as a Gaussian shape and the proposed 2D Gaussian kernel is suitable when applied to local blood vessels since the vessels may be considered as piecewise linear segments. Instead of matching a single intensity profile of the cross section of a vessel 1D, an improvement can be achieved by matching a number of cross sections (of identical profiles) along its length simultaneously with a 2D matched filter Chaudhuri et al. (1989).In MF approach, multiple 2D Gaussian matched filters with different orientations are convolved with the given retinal image and the highest responses of the directional filters are then threshold in order for the blood vessel network to be extracted. Gaussian MF is defined as Chaudhuri et al. (1989); Lei Zhang & Zhang (2009):
![]()
where L is the length of the segment for which the vessel is assumed to have a fixed orientation, and σ defines the spread of the intensity profile and represents the scale of the MF filter; the negative sign indicates that the vessels are darker than the background. Actually, a 2D MF is a 1D Gaussian function in x-direction and repeated in y-direction. For the detection of blood vessels at different orientations, the kernel has to be rotated accordingly, and the direction of the vessel is assumed to be aligned along the y-axis. For implementation purposes, g(x, y) is rotated to detect the vessels from different orientations. The rotation of g(x, y) with angle θ is Lei Zhang & Zhang (2009).
MATERIAL AND METHODS
As mentioned previously, an MF makes use of the prior knowledge that the cross- section of the blood vessels, which is a feature of the vessels, can be approximated by a Gaussian function. However, a well-known problem of this approach is that it responds not only to vessels but also to non-vessel edges such as edges of bright blobs and red lesions in the retinal images . In this paper, we propose an extension to the MF approach to reduce/suppress false detections caused by MF. Our approach enhances the MF approach by addressing two main issues: (i) to be able to detect thin blood vessels and (ii) to reduce the false detection rates of non-vessel edges. To achieve these goals, we propose to employ a multiscale matched filter approach and by incorporating into the filter response some local features of the circular area formed by a wheel centered around each pixel in the retinal image.These features are then combined/fused to form a feature image which can then be threshhold to extract the blood vessel network. Selecting the threshold value is a very critical issue.
As mentioned earlier, the MF produces strong responses to vessels and edges non-vessel structures in the retinal images. As a result, selecting one global threshold may cause false detections. Therefore, we chose to deploy the first order derivative of Gaussian (FoDoG) to select the threshold value based on the FoDoG response at each pixel. In order to build a set of Multiscale Matched Filters (MSMF) we compute a set of scales (σi) i=1,2, · · · ,m; a set of lengths (Li), i = 1, 2, · · · , m; one L value for each sigma; a set of orientations (θi), i = 1, 2, · · · , n ; the number of orientation is n and the total number of convolution kernels is equal to n×m. The parameter Li can be selected based on σi.
If σi is small then Li is relatively small and vice versa. The orientations can simply be defined as the number of orientations n or the angular resolution (180/n). According to previous works Dalmau & Alarcon (2011), 12 orientations (n=12) produce good experimental results, i.e., an angular resolution of 15o. The scales used in our proposed method for the MSMF for both databases are: σ [1, 1.5, 2] , L [7, 7, 9] and orientations n=12; resulting in 36 kernels.
For the LFs extension, we have used two local features obtained from the circular area around each pixel as follows:
- LF1 : the MSMF response of the center
- LF2 : the difference between the MSMF value of center pixel and MSMFmin the minimum MSMF response among all pixels inside that circle with rk radius around it; LF2 is computed using the following equation:
LF2(i, j) = |MSMF (i, j) − MSMFmin(i, j)| (2)
MSMFmin(i, j) = min {MSMF (x, y)∀p(x, y) ∈ Crcl(p(i, j), rk)} (3)
where Crcl(p(i, j), rk) is a circle of radius rk centered at pixel p(i,j).
These features represent a measure of confidence of the vessel detection method through their fusion and will result in images with much enhanced detected blood vessels; the details of these features and this enhancement step will be described in subsequent subsections. Our methodology requires some preprocessing steps such as extracting the Region of Interest (ROI) which is the retinal fundus and generating the retinal mask. This step will be described in the next section. Another important preprocessing step relates to image enhancement to remove uneven illuminations and enhance low contrast image using an Adaptive Histogram Equalization (AHE).
Locating ROI of Retinal Fundus: A fundus image consists of a circular fundus and a dark background surrounding the fundus. It is important to separate the fundus from its background so that further processing is only performed for the fundus and not on non-useful pixels belonging to the background. In this sub-section a method for creating a binary fundus mask prior to lesion detection is described. In a fundus mask, pixels belonging to the fundus are marked with 1’s and the background of the fundus with 0’s. With the help of the fundus mask a lesion detection algorithm can process only the pixels of the fundus and omit the background pixels. The fundus can be easily separated from the background when the original fundus image has been converted from the RGB color system to any color system where a separate channel is used to represent the intensity values of the image Kuivalainen (2005) such as HSI, which we have chosen for our work in this paper.
The intensity channel can be threshold by a low threshold since the background pixels are typically significantly darker than the fundus pixels. The threshold value can be fixed to certain low value for all images; in our work we used the Otsu method to determine a threshold for each image Otsu (1979).In some cases, the intensity difference between the fundus and the background is not very clear due to inadequate illuminations near to the edge of the fundus. Thus, some dark regions of the fundus may be considered as background after the thresholding process. However, very dark pixels near to the fundus edges can be excluded from further processing since it is not possible to detect lesions from regions where illuminations have been almost zero. After thresholding, a median filter is performed to remove single noise pixels from the created fundus mask. The edge of a fundus tends to be very noisy, and thus, the edge pixels are removed by a morphological erosion operation with a small structuring element (clearEdgeThickness) Kuivalainen (2005). The remaining holes in the mask can be filled by processing the mask line by a line and filling the missing pixels between the first and last fundus pixels in each row. An example of a created fundus mask is shown in Figure 2.
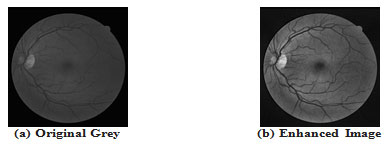
Proposed Retinal Image Enhancement: Contrast enhancement techniques are used widely in image processing; and histogram equalization (HE) is one of the most popular automatic procedures Stark (2000); Wu, Zhang, Liu, & Bauman (2006). Although it is widely used, HE is less effective when the contrast characteristics vary across the image. Adaptive HE (AHE) Stark (2000) overcomes this drawback by generating the mapping for each pixel from the his- togram in a local window. AHE does not allow the degree of contrast enhancement to be regulated. Previous works have shown that AHE is more effective than the classical histogram equalization, especially when detecting small blood vessels characterized by low contrast levels. As the green channel of retinal images presents the largest contrast between the blood vessels and the background Dalmau & Alarcon (2011); Soares, Le, Cesar, Jelinek, & Cree (2006).
In our proposed method, we converted the retinal color images into gray scale images by keeping the green channel, and discarding the rest of the color channels. We then applied the AHE to enhance contrast, Fig. 3 shows an example of the enhancement on retinal image.
Figure 2: Sample of locating retinal fundus for image im0163 from STARE DB
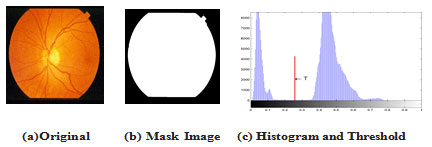
Figure 3: Sample of AHE enhancement to image 01 from DRIVE DB
- Convert images from RGB color space to HSI color space and determine the fundus mask.
- Convert the green channel of RGB color space to gray level and enhance the
- Create proposed multiscale MSMFs using multiple scales.
- Convolve the enhanced image with MSMFs using different orientations by selecting the highest response directional filter response.
- The MSMFLF feature image is obtained using the following steps:
- For each pixel P0 inside the retinal area in image q(x, y), use a wheel of radius rk around it to define a circular area around that pixel (see Fig. 4) and get local features (LF1, LF2) as described in section 4 with equation ( 2 , 3)
- Create the feature image MSMFLFs(x,y) by fusing the 2 features together using the following equation:
MSMFLFs(x, y) = LF1(x, y) + LF2(x, y) (4)
- Create the MSFoDoG response by convolving the feature image MSMFLFs(x,y) with a multiscale 2D first derivative of Gaussian with scales: σ[1, 1.5, 2], L [7, 7, 9] and orientations n=12. Select the smallest response among the 36 kernels.
- Using the MSFoDoG response to the feature image MSMFLFs(x,y), find a map of optimal threshold values TAdp, with a threshold for each pixel;
- Threshold MSMFLFs(x, y) by TAdp to get the initial image of extracted vessel network v0(x, y) as:
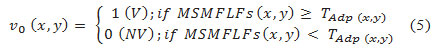
where TAdp is the threshold map formed by the FoDoG map and feature image MSMFLFs, and each pixel has a threshold value adaptively set. The abbreviation (V, NV ) stand for vessel and non-vessel.′
- Obtain the final vessel network v(x, y) by labeling objects in v (x, y) then removing objects that are
smaller in size than ShrL, where ShrL is the shortest accepted length of a vessel segment;
Fig.( 4) shows different cases of the processed pixels and our MSMFLFs method to detect the blood vessel pixels. In our proposed method, we used a wheel of radius rk around each pixel (see Fig. 5).
Figure 4: Illustration of effect of using local features on vessel detection accuracy (4 cases): circular area in (yellow) color is the wheel defining the circular area around center pixel Po, in a snapshot of the image area and showing values of local features.
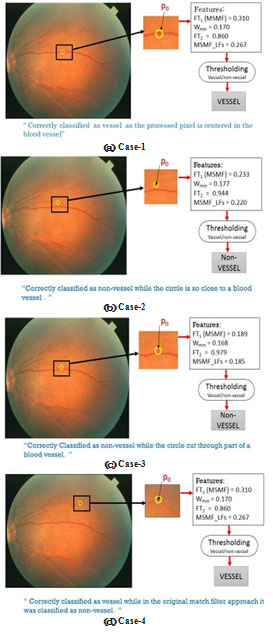
Figure 5 : Circular area: In (blue) color is the wheel defining the circular area around center pixel Po , rk is the radius of the wheel.
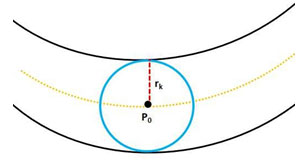
This wheel defines a circular area around the pixel of interest; and is used to collect the local features (LF1, LF2) as described in section 4 with equation ( 3, 4); these local features are used to form the final MSMFRLFs image with equation ((6)), which is then thresholded to get the segmented image. Fig. 6 shows an example to illustrate the enhancement process to improve the vessel detection and reduce false detections by using our MSFoDoG technique to adaptively estimate a threshold map. As can clearly be seen in the original image of Fig. 6(a), there are bright lesions. Fig. 6(b) shows the MSMFLFs feature map, in Fig. 6(c) we can see that with a global threshold value (e.g., Otsu method) these lesions may get falsely detected as blood vessels. However, in Fig. 6(d), which illustrates our MSFoDottLm method, the local mean map of the response of MSFoDoG clearly shows that it has high value in areas of bright lesions and low values for vessel areas; this feature is used to adaptively increase the threshold value in these areas which will help in reducing false detections; Fig. 6(e) shows the result of our proposed method, compared to ground truth image shown in Fig. 6(f).
RESULTS AND DISCUSSION
The proposed algorithm has been evaluated on real retinal images from the publicly available STARE Hoover et al. (2000) and DRIVE Staal et al. (2004) databases. The STARE (Structured Analysis of Retina) database contains twenty retinal fundus slides and their ground truth images. The digitized slides are captured by a TopCon TRV- 50 fundus camera with 35 degree field of view. Each slide was digitized to produce a 605×700 pixel image. All the twenty images were carefully labeled by hand to produce ground truth vessel segmentation by an expert. The DRIVE (Digital Retinal Images for Vessel Extraction) database consists of 40 color fundus photographs whose images are digitized using a Cannon CR5 non-mydriatic 3CCD camera with a 45 degree field of view. Each image is captured using 24-bits per pixel at the image size of 565584.
In our experiments, we have used 20 images from each of the two databases, STARE and DRIVE. In both databases, the original images are in color. The green channel of the color fundus images was used for vessel extraction.
Parameter Settings: There are three types of parameters to be set efficiently: parameters of the MSMF algorithm, local features extraction, and the FoDoG algorithm. Since it is hard to assign the best values to these parameters we have chosen an empirical approach based on knowledge about the type of data (i.e., blood vessel). For the MSMF algorithm one needs to set the values for (number of orientations (n), σ , L). In our experiments using the multiscale MF (MSMF), the scales used for both databases have been chosen as follows: Σ = [1, 1.5, 2] , L =[7, 7, 9].
From previous works 12 orientations (n=12) have been used Dalmau & Alarcon (2011) resulting in 36 kernels;
The same parameters are also used for the FoDoG algorithm for the purpose of comparison.
Local feature extraction algorithm is a very important part of our proposed method. Here the features are extracted based on a wheel with a radius rk placed around each pixel in the image to capture information used to form the feature image. The widths of the vessels are found to lie within a range of 2-10 pixels Chaudhuri et al. (1989). Based on this finding from our experiments, we have set rk = 9.
Performance Measures: The measures used to quantitatively evaluate the performance of our algorithm and compare it to some similar techniques include: Detection accuracy (ACC), True posi- tive rate (TPR) and False positive rate (FPR). In our experiments, we have evaluated the performance results of our proposed method on each of the DRIVE and STARE databases. This has been carried out as follows:
- For each image, compute the evaluation matrices (ACC, TPR, FPR)
- Compute the average (ACC, TPR, FPR) of all images
As mentioned earlier, the proposed algorithm has been assessed on real retinal images from the publicly available STARE Hoover et al. (2000) and DRIVE Staal et al. (2004) databases using twenty retinal fundus slides and their ground truth images from each database. It was compared with other methods, Table-1 shows a list of related methods, used methodology and the dataset used. Tables 2 and 3 show the results of our proposed method using DRIVE and STARE databases respectively. From these two tables, it can be seen that the mean TPR obtained is (0.7661%) for STARE and (0.6312 %) for DRIVE while the mean FPR is (0.0311 %) for STARE and (0.0183 %) for DRIVE. Therefore, the FPR does not exceed (0.0512%) for STARE and (0.0242 %) for DRIVE. Figures 7 to 10 show sample results of our method from both databases.
Table 1. Methods used for comparison
| Method | Methodology | Databases |
| Chaudhuri et al. (1989) | General matched filters (MF). Implemented by later works for comparison reasons e.g Cinsdikici & Aydin (2009); Zhang et al. (2010); | STARE (20 images).
DRIVE (20 images). |
| Hoover et al. (2000) | Based on matched filters with threshold probing technique | STARE (20 images). |
| Cinsdikici & Aydi (2009) | Used a (MF/ant algorithm) | DRIVE (20 images). |
| Zhang et al. (2010) | Used (MF-FDOG) | STARE (20 images).
DRIVE (20 images). |
| Dalmau &Alarcon (2011) | Based on a relaxed thresholding technique with a Cellular Automata segmentation method. | STARE (20 images).
DRIVE (20 images). |
| Staal et al. (2004) | Ridge-based method | STARE (19 images).
DRIVE (20 images). |
| Jiang & Mojon (2003) | Using adaptive
Local thresholding based on a verification-based multi-threshold probing scheme |
DRIVE (20 images). |
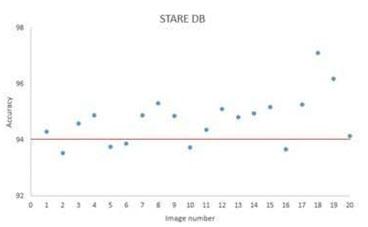
For the DRIVE database, fig.8 shows a sample result of blood vessel extraction in image-19 and the evaluation of the extracted image shows that the accuracy of extraction compared to the ground truth image is (95.10 %) with very good true positive rate (0.7169 %) while at the same time maintaining a low false positive rate (0.0155 %). This shows that our method to some extent does not miss-classify non-vessel objects as blood vessel. Fig.11 shows a scatter plot for the extraction accuracy values of our method on the 20 tested images from DRIVE database. The red line marks the level for mean accuracy, and the Y-axis is bounded by minimum (91.77 %) and maximum (95.10 %) accuracy values for our method. From this figure one can see that for nearly more than (50%) of the tested images the accuracy is above the mean value (93.53 %). In the case of the STARE database, a sample result of our method is shown in fig. 9 for image im0129 and the evaluation of extraction results compared against the ground truth image, has given an accuracy of (97.10 %) with a true positive rate (0.7426%) and a false positive rate (0.0114 %). These results suggest an excellent extraction accuracy. From the scatter plot for the extraction accuracy values of our method on the 20 tested images from STARE database are shown in Fig.12, where the Y-axis is bounded by minimum (93.53 %) and maximum (97.10 %) accuracy values for our method while the mean accuracy is marked by the red line. This figure clearly shows that more than (50%) of the tested images have an extraction accuracy higher than the mean value (93.53 %).
For the purpose of quantitatively evaluating the performance of our algorithm, a com- parative study against some similar methods in literature has been carried out. Tables 4 and 5 show the results of this comparison. It can clearly seen that our proposed method gave high ACC values. While in the cases of methods with higher ACC value than ours, we either have a higher TPR or a lower FPR.
Table 2. Results on DRIVE DB
| Image | ACC | TPR | FPR | TNR | FNR |
| 1 | 93.45 | 0.6602 | 0.0228 | 0.9772 | 0.3398 |
| 2 | 93.61 | 0.6749 | 0.0167 | 0.9833 | 0.3251 |
| 3 | 91.77 | 0.5285 | 0.0133 | 0.9867 | 0.4715 |
| 4 | 93.37 | 0.5739 | 0.0086 | 0.9914 | 0.4261 |
| 5 | 93.44 | 0.6035 | 0.0112 | 0.9888 | 0.3965 |
| 6 | 92.78 | 0.5814 | 0.0131 | 0.9869 | 0.4186 |
| 7 | 92.90 | 0.6250 | 0.0230 | 0.9770 | 0.3750 |
| 8 | 92.37 | 0.5717 | 0.0242 | 0.9758 | 0.4283 |
| 9 | 93.82 | 0.6032 | 0.0152 | 0.9848 | 0.3968 |
| 10 | 94.23 | 0.6330 | 0.0138 | 0.9862 | 0.3670 |
| 11 | 93.42 | 0.6500 | 0.0224 | 0.9776 | 0.3500 |
| 12 | 93.54 | 0.6104 | 0.0163 | 0.9837 | 0.3896 |
| 13 | 92.82 | 0.6185 | 0.0188 | 0.9812 | 0.3815 |
| 14 | 93.86 | 0.6791 | 0.0257 | 0.9743 | 0.3209 |
| 15 | 94.09 | 0.6756 | 0.0275 | 0.9725 | 0.3244 |
| 16 | 93.46 | 0.6262 | 0.0170 | 0.9830 | 0.3738 |
| 17 | 93.39 | 0.5939 | 0.0166 | 0.9834 | 0.4061 |
| 18 | 94.50 | 0.6973 | 0.0215 | 0.9785 | 0.3027 |
| 19 | 95.10 | 0.7169 | 0.0155 | 0.9845 | 0.2831 |
| 20 | 94.69 | 0.7013 | 0.0225 | 0.9775 | 0.2987 |
| Average | 93.53 | 0.6312 | 0.0183 | 0.9817 | 0.3688 |
Table 3. Results on STARE DB
| Image | ACC | TPR | FPR | TNR | FNR |
| im0001 | 94.30 | 0.7488 | 0.0333 | 0.9667 | 0.2512 |
| im0002 | 93.53 | 0.6155 | 0.0316 | 0.9684 | 0.3845 |
| im0003 | 94.58 | 0.7345 | 0.0354 | 0.9646 | 0.2655 |
| im0004 | 94.89 | 0.6796 | 0.0201 | 0.9799 | 0.3204 |
| im0005 | 93.75 | 0.6894 | 0.0267 | 0.9733 | 0.3106 |
| im0044 | 93.87 | 0.8332 | 0.0512 | 0.9488 | 0.1668 |
| im0077 | 94.89 | 0.8594 | 0.0402 | 0.9598 | 0.1406 |
| im0081 | 95.32 | 0.8728 | 0.0376 | 0.9624 | 0.1272 |
| im0082 | 94.87 | 0.8343 | 0.0375 | 0.9625 | 0.1657 |
| im0139 | 93.73 | 0.7879 | 0.0440 | 0.9560 | 0.2121 |
| im0162 | 94.37 | 0.7921 | 0.0380 | 0.9620 | 0.2079 |
| im0163 | 95.11 | 0.8283 | 0.0341 | 0.9659 | 0.1717 |
| im0235 | 94.82 | 0.7658 | 0.0264 | 0.9736 | 0.2342 |
| im0236 | 94.95 | 0.7688 | 0.0242 | 0.9758 | 0.2312 |
| im0239 | 95.17 | 0.7969 | 0.0277 | 0.9723 | 0.2031 |
| im0240 | 93.67 | 0.6553 | 0.0166 | 0.9834 | 0.3447 |
| im0255 | 95.26 | 0.7675 | 0.0210 | 0.9790 | 0.2325 |
| im0291 | 97.10 | 0.7426 | 0.0114 | 0.9886 | 0.2574 |
| im0319 | 96.18 | 0.8326 | 0.0302 | 0.9698 | 0.1674 |
| im0324 | 94.15 | 0.7162 | 0.0351 | 0.9649 | 0.2838 |
| Average | 94.73 | 0.7661 | 0.0311 | 0.9689 | 0.2339 |
Table 4. Comparison of different methods on the DRIVE DB
| Method | TPR | FPR | ACC |
| 2nd Human observer | 0.7761 | 0.0275 | 94.73 |
| Staal et al. (2004) | 0.7194 | 0.0227 | 94.42 |
| MF Chaudhuri et al. (1989); | 0.6168 | 0.0259 | 92.8 |
| Jiang & Mojon (2003) | – | – | 89.11 |
| MF-FDOG Zhang et al. (2010) | 0.7120 | 0.0276 | 93.82 |
| Cinsdikici & Aydin (2009) | – | – | 92.93 |
| Our Method | 0.6312 | 0.0183 | 93.53 |
Table 5. Comparison of different methods on the STARE DB
| Method | TPR | FPR | ACC |
| 2nd Human observer | 0.8949 | 0.0610 | 93.54 |
| Hoover et al. (2000); | 0.6751 | 0.0433 | 92.67 |
| Staal et al. (2004) | 0.6970 | 0.0190 | 95.16 |
| MF-FDOG Zhang et al. (2010) | 0.6134 | 0.0245 | 93.84 |
| MF-MET Dalmau & Alarcon (2011) | 0.7380 | 0.0604 | 91.84 |
| MFCA Dalmau & Alarcon (2011) | 0.7606 | 0.0599 | 92.12 |
| Our Method | 0.7661 | 0.0311 | 94.73 |
Figure 6: Illustration of the proposed MSMFLFs method for blood vessel extraction
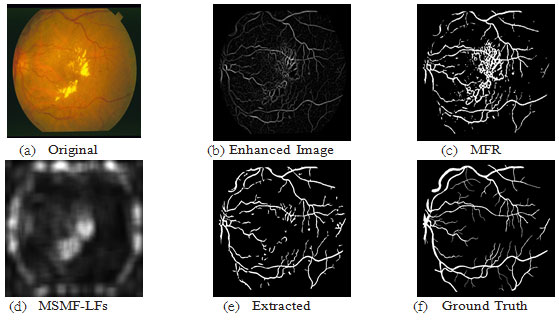
Figure 7: Results of image 02 from DRIVE DB; ACC=93.61, TPR=0.6749, FPR=0.0167
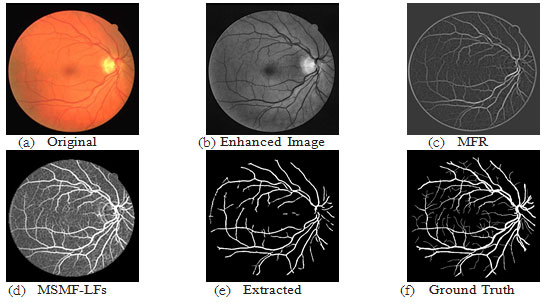
Figure 8: Results of image 19 from DRIVE DB; ACC=95.10, TPR=0.7169, FPR=0.0155
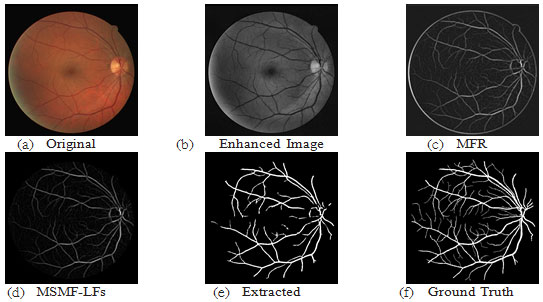
Figure 9: Results of image im0291 from STARE DB; ACC=97.10, TPR=0.7426, FPR=0.0114
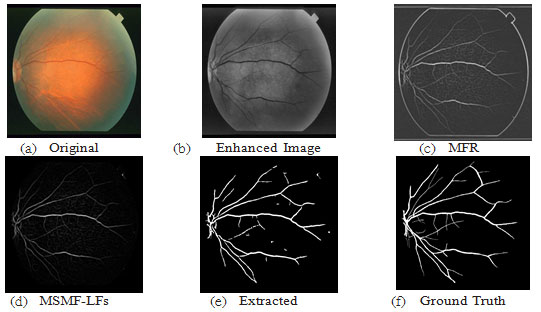
Figure 10: Results of image im0255 from STARE DB; ACC=95.26, TPR=0.7675, FPR=0.0210
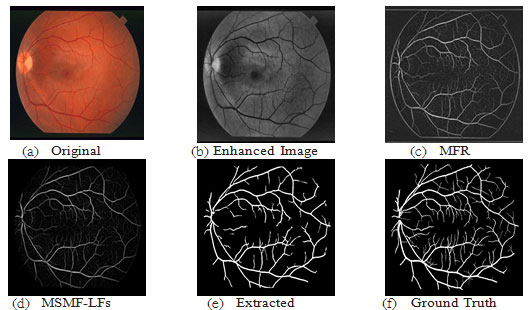
Figure 11: A scatter plot for accuracy values of our method on tested images from DRIVE database; The red line marks the level for mean accuracy; The Y-axis is bounded by minimum and maximum accuracy values for our method.
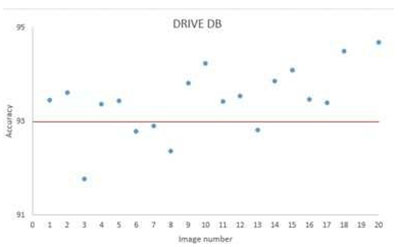
Figure 12: A scatter plot for accuracy values of our method on tested images from STARE database; The red line marks the level for mean accuracy; The Y-axis is bounded by minimum and maximum accuracy values for our method.
CONCLUSION
In this paper we have presented a novel extension to the matched filter approach for use in blood vessel detection of retinal images. An adaptive thresholding scheme us- ing FoDoG was developed and the proposed method (MSMFLFs) was evaluated on publicly available DRIVE and STARE databases. The results obtained are promising and compare favorably against those obtained using existing and similar methods. A possible enhancement to this method could be to deploy some other features and/or experimenting different thresholding techniques. Although, our method was proposed in the context of detecting blood vessels from retinal images an ongoing work is under- way to develop a quantitative method based on the shape and regularity of detected blood vessels in order to detect possible signs/symptoms of diseases.
REFERENCES
Chaudhuri, S., Chatterjee, S., Katz, N., Nelson, M., & Goldbaum, M. (1989). Detection of blood vessels in retinal images using two-dimensional matched filters. IEEE transactions on medical imaging , 8 (3), 263–269.
Cinsdikici, M. G., & Aydin, D. (2009). Detection of blood vessels in ophthalmoscope images using mf/ant (matched filter/ant colony) algorithm. Computer Methods and Programs in Biomedicine, 96 (2), 85 – 95.
Dalmau, O., & Alarcon, T. (2011). Mfca: Matched filters with cellular automata for retinal vessel detection. In I. Batyrshin & G. Sidorov (Eds.), Advances in artificial intelligence (Vol. 7094, p. 504-514). Springer Berlin Heidelberg.
Gao, X., Bharath, A., Stanton, A., Hughes, A., Chapman, N., & Thom, S. (2001). Measurement of vessel diameters on retinal images for cardiovascular studies. In On-line conference proceedings on medical image understanding and analysis.
Hoover, A., Kouznetsova, V., & Goldbaum, M. (2000). Locating blood vessels in retinal images by piecewise threshold probing of a matched filter response. IEEE Transactions on Medical Imaging, 19 , 203–210.
Jiang, X., & Mojon, D. (2003). Adaptive local thresholding by verification-based multithresh-
old probing with application to vessel detection in retinal images. Pattern Analysis and
Machine Intelligence, IEEE Transactions on, 25 (1), 131-137.
Kocayigit I, Mahmut Atum, Salih Sahinkus, Murat Aksoy, Yusuf Can (2020) Increased cardio-ankle vascular index values in patients with acute branch retinal vein occlusion Ind J of Opthal.Vol 68 No 5 868-871
Kirbas, C., & Quek, F. (2004, June). A review of vessel extraction techniques and algorithms. ACM Comput. Surv., 36 (2), 81–121.
Kirbas, C., & Quek, F. K. H. (2003). Vessel extraction techniques and algorithms: a survey. Third IEEE Symposium on Bioinformatics and Bioengineering 2003 Proceedings, 238–245.
Kuivalainen, M. (2005). Retinal image analysis using machine vision (Unpublished masters thesis). Lappeenranta University of Technology.
Lei Zhang, J. Y., Qin Li, & Zhang, D. (2009). A modified matched filter with double- sided thresholding for screening proliferative diabetic retinopathy. IEEE Transactions on Information Technology in Biomedicine, 13 (4), 528-534.
Mabrouk, M. S., Solouma, N. H., & Kadah, Y. M. (2006). Survey of retinal image segmentation and registration. ICGST International Journal on Graphics, Vision and Image Processing , 6 , 1-11.
Mansuri, M. I. K. . H. S. . A. M. (2011). A review of retinal vessel segmentation techniques and algorithms. International Journal of Computer Technology and Applications, 2 (5), 1140-1144.
Otsu, N. (1979, January). A Threshold Selection Method from Gray-level Histograms. IEEE Transactions on Systems, Man and Cybernetics, 9 (1), 62-66.
Sekiguchi, H., Sugimoto, N., Eiho, S., Hanakawa, T., & Urayama, S. (2005). Blood vessel segmentation for head mra using branch-based region growing. Systems and Computers in Japan, 36 (5), 80–88.
Soares, J. V. B., Le, J. J. G., Cesar, R. M., Jelinek, H. F., & Cree, M. J. (2006). Retinal vessel segmentation using the 2-d gabor wavelet and supervised classification. IEEE Trans. on Medical Imaging ,25 , 1214–1222.
Staal, J., Abramoff, M., Niemeijer, M., Viergever, M., & van Ginneken, B. (2004). Ridge- based vessel segmentation in color images of the retina. Medical Imaging, IEEE Transactions on, 23 (4), 501-509.
Stark, J. A. (2000, May). Adaptive image contrast enhancement using generalizations of histogram equalization. Trans. Img. Proc., 9 (5), 889-896.
Vezhnevets, V., & Konouchine, V. (2005). Growcut: Interactive multi-label nd image segmentation by cellular automata. Proc. of Graphicon, 150–156.
Wu, D., Zhang, M., Liu, J.-C., & Bauman, W. (2006). On the adaptive detection of blood vessels in retinal images. Biomedical Engineering, IEEE Transactions on, 53 (2), 341-343.
Zhang, B., Zhang, L., Zhang, L., & Karray, F. (2010, April). Retinal vessel extraction by matched filter with first-order derivative of gaussian. Comput. Biol. Med., 40 (4), 438–445.

