Department of Petroleum Engineering, Marvdasht Branch, Islamic Azad University, Marvdasht, Iran
Corresponding author Email: amin.azhdarpour@miau.ac.ir
Article Publishing History
Received: 15/12/2016
Accepted After Revision: 19/03/2017
Oil production from reservoirs usually occurs by natural flow of the fluid out of the formation. This oil recovery is called primary recovery, where the production is solely controlled by the natural energy of the formation. However, after some times of production reservoir pressure declines, which causes a decline in oil production rate. Thus, regaining the reservoir pressure to enhance oil production is of great importance. Gas lift as one of the best methods of oil recovery when reservoir pressure declines has been implemented for decades. The reservoir pressure of one of the oil fields in Iran has been dropped to a level where no natural fluid flow occurs form the reservoir. Gas lift has been proposed to compensate the natural pressure of the reservoir and ease the petroleum production from the reservoir. PIPESIM software was used to study the effectiveness of the gas lift system. Different parameters including tubing diameter, injected gas rates, and injection depth and their effect on inflow performance relationship (IPR) were investigated. The simulation results showed that natural energy of the reservoir is not sufficient for producing oil. Thus, gas lift as of the best methods of increasing the production rate in this field could be implemented successfully.
Oil Production, Artificial Lift, Gas Lift, Improved Oil Recovery, Optimization
Azdarpour A, Karaei M. A, Dabiri A. A Case Study on Simulation and Optimization of Artificial Lift Methods in One of the Iranian Oil Fields. Biosc.Biotech.Res.Comm. 2017;10(1).
Azdarpour A, Karaei M. A, Dabiri A. A Case Study on Simulation and Optimization of Artificial Lift Methods in One of the Iranian Oil Fields. Biosc.Biotech.Res.Comm. 2017;10(1). Available from: https://bit.ly/31pVxef
Introduction
Gas lift is a method of artificial lift that uses an external source of high-pressure gas for supplementing formation gas to lift the well fluids. The principle of gas lift is that gas injected into the tubing reduces the density of the fluids in the tubing, and the bubbles have a scrubbing action on the liquids. Both factors act to lower the flowing bottom-hole pressure (BHP) at the bottom of the tubing. There are two basic types of gas lift in use today, continuous and intermittent flow (Denney, 1999, Al Abdin, 2000, Decker, 2008, Hearn, 2008, Akinnibosun et al. 2011, Allyeva and Novruzaliyev, 2015).
Bahadori et al. (2001) performed a simulation study using PVD data along with fluid and multiphase flow correlations. They monitored the actual pressure and temperature data to determine the point of gas injection and construct the gas lift performance curve. They used solution nodal method to determine the optimal gas lift conditions including optimum injection depth, optimum wellhead pressure, optimum production rate and minimum injection gas volume. Their analysis showed that the optimum production rate of 2200 bbl/day and optimum injection gas volume of 1.1 MM SCF/day could be gained using gas lift process. In addition, they also concluded that the optimum gas liquid ratio is about 2100 SCF/bbl where increasing the gas liquid ratio from its optimum value has no significant effect on production rate.
de Souza et al. (2010) simulated the process of continuous gas lift using an optimization algorithm coupled to a stationary two phase flow network model. They declared that the solution of the optimization system could be used for the injected gas flow rate to maximize the production rate and profit as well as lowering the capital cost of the process. Their study particularly focused on two cases, an offshore single well case and a complex subsea system. The analysis on offshore well showed that the gas lift system could be optimized to yield the maximum oil production for different well pressure, while maximizing the profit gained from the process. At the second case study, a complex petroleum production system with multiple wells is simulated and optimized to obtain the optimal design considering annualized costs of compressor, turbine driver, gas pipelines and fuel gas consumption.
In another study by Mahmudi and Sadeghi (2013) the gas lift system was optimized to maximize the profit of the well for a long period of time. They investigated the effects of gas injection rate, tubing diameter and separator pressure on overall performance of gas lift system. They developed a mathematical model coupled to a combination of Marquardt optimization method and a genetic algorithm to simulate the gas lift system. Their results showed that production lifetime should be divided into a number of consecutive operation intervals with different tubing diameter, lift gas injection rates and separator pressures and an optimum value for tubing diameter.
Naderi et al. (2014) investigated the feasibility of artificial lift selection in the Khesht field. The Khesht field is located in in south of Iran and was discovered in 1992. Asmari reservoir, which is one the most important oil reservoirs is located in this field. The authors performed a comprehensive study to select the most suitable artificial lift method, which can be applied in this field. They investigated different production scenarios including natural flow, electrical submersible pump, and gas lift. They concluded that, initially natural flow should be considered. However, by increasing the water cut gas lift can be implemented and if the water cut is too high the electrical submersible pump can be utilized.
Ebrahimi and Khamehchi (2016) have investigated the feasibility and effectiveness of the natural gas lift (NGL) using supportive vector machine (SVM). They optimized the process using particle swarm optimization (PSO) and genetic algorithm (GA). The optimum SVM parameters were determined by the PSO algorithm. Taguchi experiment design was used to determine optimum GA and PSO parameters. The simulation results showed that SVM could be used effectively to simulate the gas lift process.
In this study, the feasibility of gas lift implementation in one of the oil reservoirs in Iran was investigated. The reservoir characteristics data including rock and fluid properties were used as input data to be used in PIPESIM software. In addition, different parameters including tubing size, injection depth and flow rates were varied to determine the optimum production scenario.
Materials and Methods
Simulation Study
In order to perform the optimization study, PIPESIM software was used. This software is capable of determing optimum prodcution scenarios during artificail lift activities (Sedarat et al. 2014, Silva et al. 2015, AlHarooni et al. 2015). The required data such as production rate data, average reservoir pressure, bottom hole flowing pressure, and well profile data were used as input data. The vertical multiphase flow correlation and fluid properties were utilized to determine production rate as a function of gas injection rates. Injected gas rate and production tubing size are the only main parameters that affect well performance, however, since production tubing is already fixed in the reservoir, thus injection gas rate can be controlled to optimize the well
performance.
The methodology of perform the simulation study was taken by the method presented by Bahadori et al. (2001). The following steps were followed to perform the simulation and optimization study of gas lift system. In the first step of this study, appropriate fluid properties correlations were selected. Then, pressure travers (Pt) inside the tubing string was calculated. Then, different values of GLR and production rates were assumed and gas injection pressure (Pg) in the casing was calculated. The values of Pt and Pg were compared and if Pt=Pg-ΔPvalve, the depth of injection was determined. The well head pressure was calculated using the assumed GLR and production rates. Then, well head pressure as a function of flow rates for horizontal and vertical tubing were plotted and the intersection of these curves was determined. Finally, the performance curve was plotted and optimum production rates and injection rates were determined.
Characteristics Of The Studied Oil Field
The studied oil filed is located in south of Iran. Pressure data analysis shows that reservoir pressure has been declining to about 4368 psi, which is near the bubble point pressure of the reservoir (4100 psi). The reservoir temperature is 220 ºF. The reservoir permeability is 3 mD, connate water saturation is 0.24, and crude oil API is 32. In addition, productivity index (PI) of the reservoir is 0.8 STB/Day/Psi and gas oil ratio is about 381
SCF/STB.
Results
Figure 1 represents the IPR of this reservoir under different flow rates, where PI is about 0.8 STB/Day/Psi and reservoir pressure is 4368 psi. In this case the absolute open flow (AOF) of the well is determined to be around 2927.9 STB/Day. On the other hand, Figure 2 represents the IPR of this reservoir under different PIs. As shown in this figure, increasing PI increases the AOF of the well, which is considered positive from production perspective. It is worth mentioning that increasing the AOF increases the prodcution from the reservoir, whcih is the main target of this study.
 |
Figure 1: Inflow perfromance relationship (IPR) of the production well |
 |
Figure 2: IPR of producing well with variable productivity index |
Figure 3 represents the inflow (IPR) and outflow (VLP) curve of the investigated well where AOF was calculated to be 2927.9 STB/day. The optimum production rate of 184.4 bbl/day was yield based on the tubing size and present condition of well. This flow rate yields a well head pressure of 350 psi. In order to optimize the production rate form this well, different tubing size were utilized and the production profile (IPR-VLP) curve was plotted as shown in Figure 4. Different tubing size including 2.44, 2.99, 3.92, and 8.60 inches were utilized with the bottom measured depth of 3593.3 m and bottom true vertical depth of 3299.9 m.
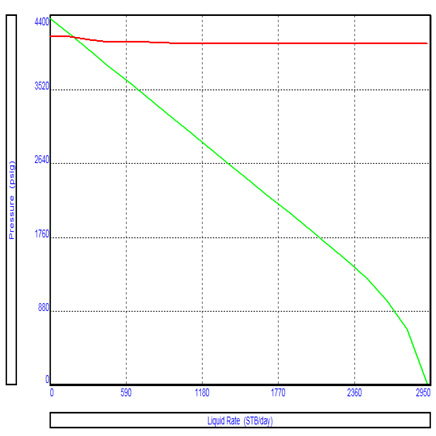 |
Figure 3: IPR-VLP plot of the production well |
 |
Figure 4: System analysis plot of production well with different tubing size |
In another production scenario, well performance was investigated where the liquid and gas rates were 344.1 STB/day and 0.13109 MMSCF/day, respectively and total depth was 1500 m. Figure 5 represents the IPR-VLP curve under this production scenario. On the other hand, the effect of different tubing size on production rate at total depth of 1500 m was investigated and the results are shown in Figure 6. Table 1 represents the calculated production rates under different tubing size. As shown in this table, the maximum production rate is achieved under 2.875 inch tubing size. The minimum profitable production rate of 1000 bbl/day is expected under natural flow from the well, which in this case has not been achieved. Thus, gas lift could be implemented to maximize the production rate from this field.
| Table 1: Oil production rate under different tubing size | |
| Tubing size (inch) | Oil rate (STB/day) |
| 350.6 | 2.875 |
| 188.8 | 3.5 |
| 182.8 | 4.5 |
| 179 | 9.875 |
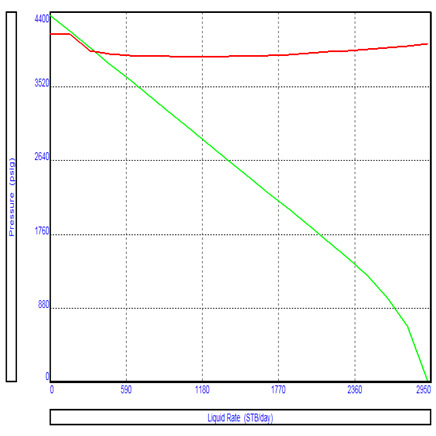 |
Figure 5: IPR-VLP plot of production well at 1500 m |
 |
Figure 6: System analysis plot with differnet tubing size at 1500 m |
Gas lift approach can be implemented in this field since intersection of IPR and VLP curves happens in low flow rates. Gas was injected to the field with the gas to liquid ratio (GLR) of 850 SCF/STB. The optimum oil production rate of 1139 STB/day was achieved under gas lift implementation in this field. Figure 7 represents the IPR-VLP plot of this field after gas lift implementation.
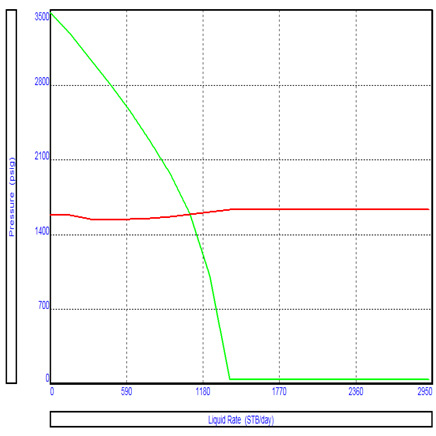 |
Figure 7: IPR-VLP plot of production well after gas lift |
Discussion
Gas injection is one of the most important paramters for prodcution optimization during artificial lift activities. The pressure drop due to fluid level drop is reduced by gas injection to the wellbore, thus, the density of the fluid is reduced and it moves more easily to the surface (Hanafizadeh et al., 2014; Ebrahimi and Khamechi, 2016; Elldakli and Soliman, 2017). Increasing the tubing size decreases the pressure drop due to friction in the wellbore, thus increasing the prodcution rate. However, the pressure drop due to fluid level drop would be domininat over the pressure drop due to friction when the tubing size is more than the optimum tubing size. This would result in production rate to decrease (Camponogara et al., 2010; Mahmudi and Sadeghi, 2013; Allyeva and Novruzaliyev, 2015; Elldakli and Soliman, 2017). Therfore, there always must be an optimum value for the tubing size as it was shown in Figures 4-6 in this study. The value of GLR is increased with increasing gas injection rate. Hence, the pressure drop is reduced and prodcution rate is increased, which creates a favorable condition in terms of oil recovery. On the other hand, when the value of the GLR is more than its critical value (GLR>GLRlimit), the results is inverse, which causes the production rate to decline. The reason is that the pressure drop due to friction would be dominant over the pressure drop due to fluid level drop (Ray and Sarker, 2007; Guerrero-Sarabia and Fairuzov, 2013; Elldakli and Soliman, 2017). The same thing happened in this study, where the value of GLRlimit was found to be 850 SCF/STB, which resulted in the maximum prodcution rate as shown in Figure 7.
Conclusions
In this study, different tubing size and total depth were simulated to determined the effectiveness of natural flow from the reservoir. The simulation results showed that the natural flow from the well is not capable of producing sufficient hydrocarbon to the surface. Gas lift process can be implemented in wide range of depth and flow rate, which is one of the advantages of this method over other artificial methods. The simulation results showed that the optimum tubing size during gas lift process is 2.875 inch, which resulted in the maximum flow rate. In addition, the simulation results showed that gas lift can be implemented in wells with low productivity index and low gas to liquid ratio. Moreover, the simualtion results showed that gas lift is one of the best artificial methods to be considered in Iran since large gas resources are available. This is one of the most important advantages of using gas lift for improving oil recovery in Iran.
Acknowledgment
The authors would like to appreciate the Department of Petroleum Engineering, Marvdasht Branch, Islamic Azad University, Marvdasht, Iran for the provision of the laboratory facilities necessary for completing this work.
References
- Akinnibosun, F.I., Atuanya, E.I., Burton, S.K., Lappin-Scott, H.M. (2011). Spectrophotometric determination of hydrogen sulphide production by sulphate-reducing bacteria in crude oil and produced water. Bioscience Biotechnology Research Communication, 4 (2): 181-187.
- Al Abdin, M.Z. (2000). Analysis of Gas Lift Installation Problems. Abu Dhabi International Petroleum Exhibition and Conference, Abu Dhabi, UAE.
- AlHarooni, K., Barifcani, A., Pack, D., Gubner, R., Ghodkay, V. (2015). Inhibition effects of thermally degraded MEG on hydrate formation for gas system. Journal of Petroleum Science and Engineering 135: 608–617.
- Allyeva, F., Novruzaliyev, B. (2015). Gas Lift–Fast and Furious. SPE Annual Caspian Technical Conference & Exhibition, Baku, Azerbaijan.
- Bahadori, A., Ayatollahi, S.H., Moshfeghian, M. (2001). Simulation and Optimization of Continuous Gas Lift System in Aghajari Oil Field. SPE Asia Pacific Improved Oil Recovery Conference, kuala Lumpur, Malaysia.
- Camponogara, E., Plucenio, A., Teixeira, A.F., Campos, S.R.V. (2010). An automation system for gas-lifted oil wells: Model identification, control, and optimization. Journal of Petroleum Science and Engineering, 70 (3–4): 157-167.
- Decker, K.L. (2008). IPO Gas Lift Design with Valve Performance. SPE Production & Operation, 23 (4): 464-467.
- Denney, D. (1999). Automated Continuous-Gas-Lift Control. Journal of Petroleum Technology, 51 (10): 38–38.
- de Souza, J.N.M., de Medeiros, L.L., Costa, A.L.H., Nunes, G.C. (2010). Modeling, simulation and optimization of continuous gas lift systems for deepwater offshore petroleum production. Journal of Petroleum Science and Engineering, 72: 277–289.
- Ebrahimi, A., Khamechi, E. (2016). Developing a novel workflow for natural gas lift optimization using advanced support vector machine. Journal of Natural Gas Science and Engineering, 28: 626-638.
- Elldakli, F., Soliman, M. (2017). Optimum design for new gas lift valve seat. Journal of Petroleum Science and Engineering, 149: 456-464.
- Guerrero-Sarabia, I., Fairuzov, Y.V. (2013). Linear and non-linear analysis of flow instability in gas-lift wells. Journal of Petroleum Science and Engineering, 108: 162-171.
- Hanafizadeh, P., Raffiee, A.H., Saidi, M.H. (2014). Experimental investigation of characteristic curve for gas-lift pump. Journal of Petroleum Science and Engineering, 116: 19-27.
- Hearn, W.J. (2010). High Reliability Type Gas Lift Equipment. Abu Dhabi International Petroleum Exhibition and Conference, Abu Dhabi, UAE.
- Mahmudi, M., Sadeghi, M.T. (2013). The optimization of continuous gas lift process using an integrated compositional model. Journal of Petroleum Science and Engineering, 108, 321–327.
- Naderi, A., Ghayyem, M.A., Ashrafi, M. (2014). Artificial Lift Selection in the Khesht Field. Petroleum Science and Technology, 32: 1791–1799.
- Ray, T., Sarker, R. (2007). Genetic algorithm for solving a gas lift optimization problem. Journal of Petroleum Science and Engineering, 59 (1–2): 84-96.
- Sedarat, E., Ghasemi, M., Gerami, S., Ebrahimzadeh, S. (2014). A quality control protocol for gas condensate fluid samples. Journal of Petroleum Science and Engineering, 122: 776–786.
- Silva, T.L., Camponogara, E., Teixeira, A.F., Sunjerga, S. (2015). Modeling of flow splitting for production optimization in offshore gas-lifted oil fields: Simulation validation and applications. Journal of Petroleum Science and Engineering, 128: 86–97.


