C. Rama Mohan,1,*![]() S. Kiran2
S. Kiran2![]() and A. Ashok Kumar3
and A. Ashok Kumar3![]()
1 Department of CSE, VTU, Belgaum, Karnataka, India.
2Department of CSE, YSR Engineering College of YVU, Proddatur, A.P., India.
3Department of Physics, YSR Engineering College of YVU, Proddatur, A.P., India.
Corresponding author email: ramamohanchinnem@gmail.com
Article Publishing History
Received: 09/07/2020
Accepted After Revision: 16/09/2020
The main issue with the multi-focus images are that the relative information about the identification of objects in the individual images with less resolution. Hence the image fusion methods have attracted attention to obtain high resolute image with a pair of multi-focus images. The fusion methods have also raised its attention to apply for biomedical images obtained with different modalities. An attempt has been made in the present work to develop an image fusion methodology designing on discrete cosine transform using frequency partitioning (DCT-FP). For the feature extraction and for better morphological details, the paper discussed about the modified principal component analysis (M-PCA) algorithm. Six sets of medical images obtained with different modalities have been introduced to the six different image fusion algorithms including the proposed method. Various statistical metrics were evaluated for each image fusion method. The careful comparison of the visual and objective metrics reveals that the proposed method shows best performance with not only having visual quality and also confirmed based on the variation of the variation of the statistical metrics.
Biomedical Images, Frequency Partitioning, Imaging Modalities, Medical Image Fusion, Modified PCA.
Mohan C. R, Kiran S, Kumar A. A. Efficiency of Image Fusion Technique Using DCT-FP with Modified PCA for Biomedical Images. Biosc.Biotech.Res.Comm. 2020;13(3).
Mohan C. R, Kiran S, Kumar A. A. Efficiency of Image Fusion Technique Using DCT-FP with Modified PCA for Biomedical Images. Biosc.Biotech.Res.Comm. 2020;13(3). Available from: https://bit.ly/3hgXcL2
Copyright © Mohan et al., This is an open access article distributed under the terms of the Creative Commons Attribution License (CC-BY) https://creativecommons.org/licenses/by/4.0/, which permits unrestricted use distribution and reproduction in any medium, provide the original author and source are credited.
INTRODUCTION
Biomedical image processing is one of the emerging tool for disease diagnosis and treatment, visualization of internal parts of the human body (Fei et al., 2017).The essence of the biomedical image processing involves in design and testing of different algorithms and helps to ease the clinical analysis at less time and also provides less space to store the processed images. Different modalities are available in medical images to provide complementary information about different parts of the body. There are certain limitations in using each modality to view the different anatomical structures of the body (Gomathi and Kalaavathi, 2016, Valdes Hernandez et al., 2010, Liu et al., 2014, Yang et al., 2014, Yin Fei et al., 2017, Rajalingam and Priya, 2018, Chen Jingyue et al., 2020, Haskins Grant Kruger Uwe and Yan Pingkun, 2020, Zhang Yu et al., 2020).
The various number of modalities are generally used in medical imaging such as MRI, CT, PET, X-ray and so on. Each modality expresses its own advantages over other modalities. For example in MRI soft tissue information is available but in CT imaging dense tissue information is provided. Like this one modality is superior in getting particular information about the human body than other (Fatma El-Zahraa et al., 2016). The responses from the imaging modalities provide sufficient information that can be used for the study, detection and diagnosis of diseases by radiologists. But major limitations of these modalities are that one modality cannot provide the complete information about the activity of the anatomical structures as each modality uses different radiation powers. To get benefit over all modalities, the images obtained from different modalities can be processed through image fusion algorithms to produce multimodal images.
These fusion algorithms improve the identification of damaged region of the human body and also present accurate integrating complementary information useful for the clinical analysis and treatment. Rather than single modal images, multimodal images had major advantages such as combination of images of CT and MR representing both soft tissue and bone simultaneously. Similarly, the use of image fusion algorithms in medical images MR-T1 and MR-T2 to help the segment of white matter lesions and also to guide the resection of epileptogenic lesions by neurosurgical methods. The use of PET / CT imaging provides an insight into the physiological and anatomical features of the tumor disease (Kunpeng Wang et al., 2020, Ullah Hikmat et al., 2020).
Multimodality images are generally produced to get advantage over single modality image by different algorithms. One of the mostly used algorithms is image fusion algorithms. A lot of work has been carried out over the past decade in the application of appropriate image fusion algorithms for biomedical images to investigate the anatomical and physiological features of the human body.
A pulse-coupling neural network (PCNN) image fusion algorithm using sparse representation to overcome the limitations of wavelet-based transform methods and the decomposition of the coefficients of the source images was performed using NSCT method (Xia et al., 2018). Fuzzy transform (FTR) based image fusion method is proposed for multi-focus images with the help of pair of error images (Manchanda and Sharma, 2018). A cascaded PCA-based image fusion algorithm is proposed with shift invariant wavelet transform to retain important image features, such as edges, clarity, and image descriptions (Benjamin and Jayasree, 2018). An image fusion algorithm is described based on PCNN using the Poisson Hidden Markov (PHMM) model to implement the fusion requirements (Biswas and Kanti Sen, 2018).
This hybrid algorithm improves both functional and color information of the image. NSCT and SWT based image fusion algorithm is proposed for multimodal biomedical images (Ramlal et al., 2019). NSCT based phase congruency and local Laplacian energy is proposed for multimodal biomedical image fusion by Zhu Zhiqin et al., 2019. SPECT and CT images of the brain are considered for the image fusion using PCNN, HIS and shuffled frog leap algorithm (SFLA) (Huang Chenxi et al., 2019). A hybrid advanced image fusion method is proposed based on NSST and Parameter adaptive PCNN (PAPCNN) model (Jingming Xia et al., 2020).
A two scale decomposition of images with sparse representation is used as image fusion method (Sarmad Maqsood et al., 2020). A new image fusion algorithm is proposed which takes the advantages of the transform domain such as wavelets and both Independent component analysis (ICA) and PCA methods (Satya Prakash Yadav et al., 2020). The proposed method involves the utilization of the advantages of discrete cosine transform with frequency partitioning. To evaluate the features of the fused the paper propose a modified PCA algorithm.
MATERIAL AND METHODS
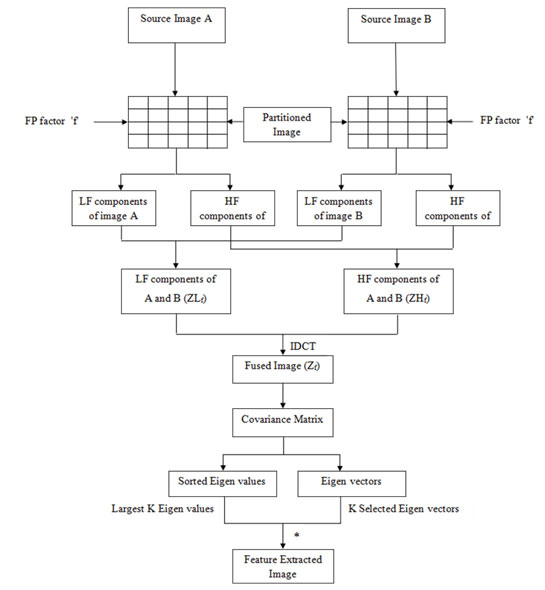
Figure 1, which consists of two methods, the FPDCT-based image fusion approach (Naidu VPS, 2013) and the MPCA approach, demonstrate the proposed system structure. The definition of both processes is as follows.
Image Fusion Based On DCT with Frequency Partitioning: The image fusion approach is applied with different fusion rules for high and low frequency components having partition factor (‘f’). The algorithm 1 describes the different steps involved in the implementation of the proposed method.
Algorithm 1: FPDCT based Image Fusion
Input : Medical Images
Output : Fused Image
Steps :
- Start
- Loaded Source Images
- To get the components of low and high frequency respectively, performed the frequency partition on source image A & source image B.
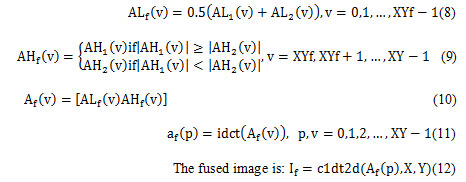
- Using the Fusion law, images fusion is applied for low and high frequency components.
- To obtain the fused image, the inverse DCT algorithm is applied to the high and low frequency elements of the composite.
- Stop
The 2-D Lyapunov inequality becomes more critical option to apply for the entire frequency domain. To alleviate this it is necessary to use a matrix function varies with the frequency domain. Hence, in order to get the advantage of 2-D Lyapunov inequality, a group of discrete intervals of constant matrix functions can be considered using the frequency partitioning approach. Frequency is a periodic motion undergone for one cycle after passing through series of values. Frequency partition refers to identification of LF and HF in given set of data. Further apply frequency function f which divides LF and HF values separately.
Here LF indicates low frequency and HF indicates high frequency. In case of digital image, low frequency components are perceptually important. Generally, background components are considered as low frequency values. Whereas in case of high frequency components sharp image edges are identified which represents foreground components of image. The frequency partitioning is very useful in identification of periodic texture pattern or extraction of features of image. In case of matching procedure, high frequency components are considered to identify texture pattern.
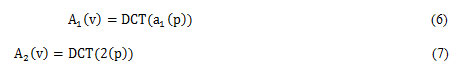
With the help of 1D DCT, vector data has been generated with DCT function Z(x). Further, DCT coefficients are identified for the given vector. A partition factor ‘f’ is applied for energy compaction DCT coefficients (high and low frequency) which separates DCT coefficients as low frequency and high frequency separately as shown in figure 1.
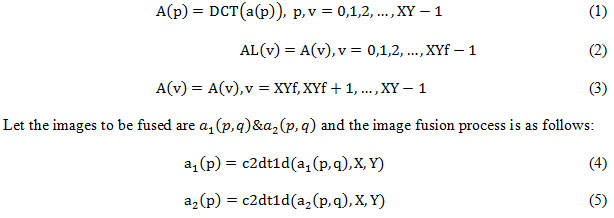
Figure 1: The flow diagram for the system suggested
With the help of eq. 3, the fused coefficients are represented as:
Implementation of Mpca Algorithm: The fused image obtained after applying FPDCT algorithm is given as an input to MPCA algorithm. The purpose of using MPCA algorithm is to reduce the dimensionality of the images (Savnte et al, 1987). The detailed description of some key steps involved in the MPCA algorithm is given below.The MPCA converts associated variables into a variety of unrelated principal components as a mathematical method. It determines optimum definition for compact operation of a given data set. MPCA first principle is the calculation of covariance values for a given data set. Maximum variance from the first variable of theory is determined.
Let the image of the source become a vector of one column. To project the data into a 1D subspace, the following steps are required.
- Set the data to a vector.
- For the given vector, measured the matrix of covariance.
- Calculated the values of Eigen for given matrix of covariance.
- Determined the V, D is part of the Eigen function.
- Order the D as the own value decreases.
- The first column of V is computed to represent the larger value of Eigen. In order to measure P
P = V( : , ind(1))./sum(V( : , ind(1)) (13)
Eventually, to obtain image extracted as the features
PCA = P(1) * Img (14)
Quality Metrics of the Image Fusion Algorithm: The quality measure of the image fusion process is categorized into subjective and objective metrics. The subjective metrics usually depends on visual features and observer’s professional knowledge. Further, the computation time of this process is time-consuming with poor readability. On the other hand, the objective metrics can easily be computed and calculates the similarity between the fused image and input images. The present paper evaluates twelve objective metrics to understand the performance of the proposed algorithm. (Jagalingam and Hegde, 2015, Silvina al., 2018, Yin Chen and Blum, 2009).
RESULTS AND DISCUSSION
The medical image test pairs (CT / MRI, MR – PD / MR – T1, MR – PD / MR – T2, MR – T1 / MR – T2, MR – PD / PET, and MR – T1 / PET) were chosen by online resources such as http://www.med.harvard.edu/AANLIB/home.html page. These images were given as inputs for different standard fusion algorithms such as MSVD, DWT, MRDCT, LPDCT, FPDCT and FPDCT + MPCA (proposed method). The performance of these algorithms was analyzed using different visual and quantitative measures. The proposed algorithm fuse source images with FPDCT + MPCA process to extract features of an image.Different statistical measures such as Mean (API), QW (weighted fusion quality index), QE1 (edge-dependent fusion quality index (version 1)), QE2 (edge-dependent fusion quality index (version 2)), CQM (pistonesi_metric), and QCB (Chen-Blum metric) used to quantify the performance of the fusion algorithms mentioned.
The computed values of the statistical measures for different standard medical image test pairs using the mentioned fusion algorithms are specified in the table 1- 6. Based on the nature of these statistical measures, the values of API, QW, QE1, QE2, CQM, and QCB should be of higher value to show the enhanced performance of the fusion algorithm. The images obtained after fusion process should be in such a way that it provide more necessary information based on people’s perceptions, visual and quantitative analysis. The visual analysis of the fused image should reveal the significant improvement in the transfer of information from the source images, information lost from the source images and less artifacts.
Figure 2 describes the original CT / MRI images obtained by different image fusion algorithms. The image (figure 2(h)) obtained from the proposed fusion algorithm shows better visual quality and less information loss. The statistical metrics evaluated for original CT / MRI images using different fusion algorithms are specified in the table 1. After the comparison of the statistical measures obtained by different fusion algorithms, the proposed method shows good performance over other standard fusion methods expect QE1 and QE2.
Figure 2: Visual evaluation of the fusion of MRI and CT Medical Images using (a) CT original Image (b) MRI original image (c) MSVD+PCA (d) DWT+PCA (e) MRDCT+PCA (f) LPDCT+PCA (g) FPDCT+PCA and (h) FPDCT+MPCA.
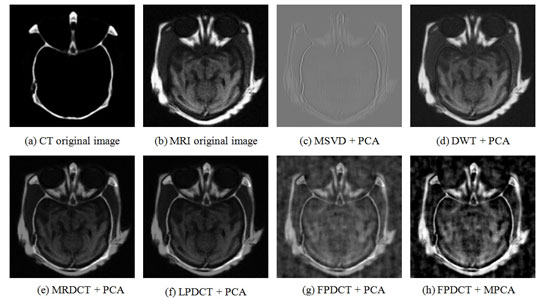
Table 1. Statistical measures of medical images (CT / MRI) using MSVD+PCA, DWT+PCA, MRDCT+PCA, LPDCT+PCA, FPDCT+PCA and FPDCT+MPCA
| Evaluation Index | MSVD | DWT | MRDCT | LPDCT | FPDCT | FPDCT+MPCA |
| API | 51.7817 | 51.73047 | 32.08205 | 32.08356 | 54.22952 | 55.85124 |
| QW | 0.048087 | 0.579082 | 0.627186 | 0.627418 | 0.777976 | 0.7877 |
| QE1 | 0.001948 | 0.280026 | 0.351254 | 0.352333 | 0.581518 | 0.5623 |
| QE2 | 0.044136 | 0.529175 | 0.592667 | 0.593577 | 0.762573 | 0.7499 |
| CQM | 0.071625 | 0.614085 | 0.669865 | 0.669393 | 0.838948 | 0.8446 |
| QCB | 0.036214 | 0.211707 | 0.358095 | 0.34075 | 0.189254 | 0.386236 |
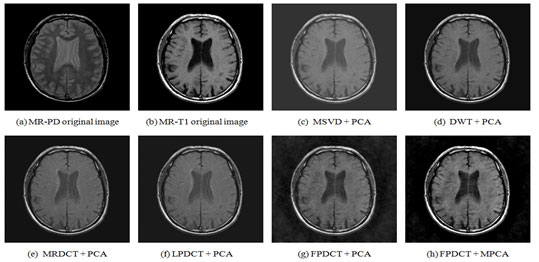
The original MR – PD / MR – T1 images and images after various image fusion methods can be visualized in Figure 3. After the visual analysis of these images, the image obtained using the proposed method shows better quality and less information loss. Table 2 shows the statistical measures of the different fusion algorithms and the metrics obtained for the proposed algorithm shows better values than compared to other algorithms.Original medical MR – PD / MR – T2 images obtained after applying to different fusion algorithms are shown in figure 4. The boat image (figure 4(h)) obtained using the proposed method shows the better visual appearance and appreciably more image quality. Table 3 shows the quality metrics of the MR – PD / MR – T2 image using different fusion algorithms. From the visual appearance and quality metrics the proposed algorithm shows better performance than other algorithms.
Table 2. Statistical measures of medical images (MR-PD/MR-T1) using MSVD+PCA, DWT+PCA, MRDCT+PCA, LPDCT+PCA, FPDCT+PCA and FPDCT+MPCA
| Evaluation Index | MSVD | DWT | MRDCT | LPDCT | FPDCT | FPDCT+MPCA |
| API | 37.42545 | 37.43239 | 35.36881 | 35.36997 | 42.56744 | 45.41017 |
| QW | 0.784108 | 0.837708 | 0.795226 | 0.795348 | 0.830738 | 0.8454 |
| QE1 | 0.556044 | 0.680914 | 0.61139 | 0.612899 | 0.666913 | 0.6856 |
| QE2 | 0.745683 | 0.825175 | 0.781915 | 0.782879 | 0.816647 | 0.828 |
| CQM | 0.829274 | 0.855221 | 0.825664 | 0.826336 | 0.853063 | 0.8681 |
| QCB | 0.15093 | 0.259611 | 0.208251 | 0.191667 | 0.278866 | 0.521908 |
Figure 3 : Visual evaluation of the fusion of MR-PD and MR-T1 Medical Images using (a) MR-PD original Image (b) MR-T1 original image (c) MSVD+PCA (d) DWT+PCA (e) MRDCT+PCA (f) LPDCT+PCA (g) FPDCT+PCA and (h) FPDCT+MPCA.
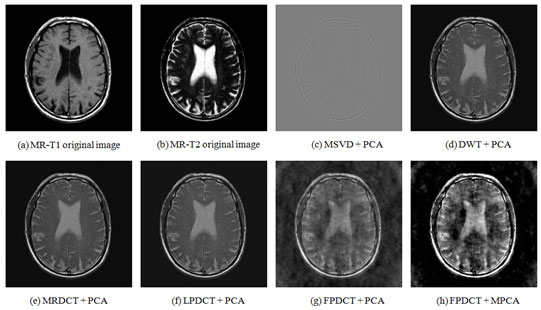
The visual information of medical MR – T1 / MR – T2 images both input and output of various image fusion algorithms are shown in figure 5. Table 4 gives the statistical measures of the fusion algorithms of the medical MR – T1 / MR – T2 image. After comparing the performance of the fusion methods, the proposed method shows good image quality and better statistical measures.
Figure 4: Visual evaluation of the fusion of MR-PD and MR-T2 Medical Images using (a) MR-PD original Image (b) MR-T2 original image (c) MSVD+PCA (d) DWT+PCA (e) MRDCT+PCA (f) LPDCT+PCA (g) FPDCT+PCA and (h) FPDCT+MPCA.
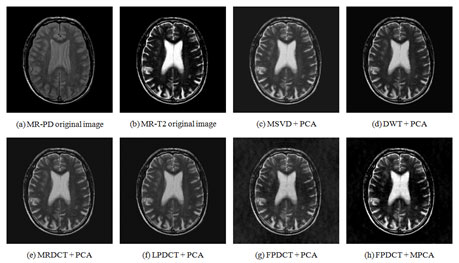
Table 3. Statistical measures of medical images (MR-PD/MR-T2 ) using MSVD+PCA, DWT+PCA, MRDCT+PCA, LPDCT+PCA, FPDCT+PCA and FPDCT+MPCA
| Evaluation Index | MSVD | DWT | MRDCT | LPDCT | FPDCT | FPDCT+MPCA |
| API | 28.63709 | 28.6367 | 28.53053 | 28.5188 | 28.89087 | 32.21809 |
| QW | 0.829519 | 0.903563 | 0.862544 | 0.862274 | 0.896868 | 0.9094 |
| QE1 | 0.587614 | 0.778354 | 0.700519 | 0.700711 | 0.780103 | 0.7971 |
| QE2 | 0.76656 | 0.882244 | 0.83697 | 0.837085 | 0.883234 | 0.8928 |
| CQM | 0.880485 | 0.920614 | 0.883243 | 0.883242 | 0.916054 | 0.9291 |
| QCB | 0.218126 | 0.303231 | 0.221705 | 0.232343 | 0.281452 | 0.553689 |
Table 4. Statistical measures of medical images (MR-T1/MR-T2) using MSVD+PCA, DWT+PCA, MRDCT+PCA, LPDCT+PCA, FPDCT+PCA and FPDCT+MPCA
| Evaluation Index | MSVD | DWT | MRDCT | LPDCT | FPDCT | FPDCT+MPCA |
| API | 35.53705 | 35.59537 | 35.72916 | 35.71688 | 42.56744 | 49.14842 |
| QW | 0.003865 | 0.637714 | 0.637597 | 0.639368 | 0.639109 | 0.6643 |
| QE1 | 0.000003 | 0.419465 | 0.417329 | 0.42436 | 0.42573 | 0.4487 |
| QE2 | 0.001624 | 0.647661 | 0.64601 | 0.651429 | 0.65248 | 0.6698 |
| CQM | 0.007306 | 0.667563 | 0.674461 | 0.675637 | 0.692676 | 0.7186 |
| QCB | 0.022406 | 0.186874 | 0.179976 | 0.155508 | 0.196004 | 0.431429 |
Figure 5: Visual evaluation of the fusion of MR-T1 and MR-T2 Medical Images using (a) MR-T1 original Image (b) MR-T2 original image (c) MSVD+PCA (d) DWT+PCA (e) MRDCT+PCA (f) LPDCT+PCA (g) FPDCT+PCA and (h) FPDCT+MPCA
The visual information of medical MR – PD / PET images both input and output of various image fusion algorithms are shown in figure 6. Table 5 gives the statistical measures of the fusion algorithms of the medical MR – PD / PET image. After comparing the performance of the fusion methods, the proposed method shows good image quality and better statistical measures.
Table 5. Statistical measures of medical images (MR-PD/PET) using MSVD+PCA, DWT+PCA, MRDCT+PCA, LPDCT+PCA, FPDCT+PCA and FPDCT+MPCA
| Evaluation Index | MSVD | DWT | MRDCT | LPDCT | FPDCT | FPDCT+MPCA |
| API | 37.3841 | 37.34552 | 34.44221 | 34.43369 | 40.71423 | 44.66777 |
| QW | 0.581465 | 0.56562 | 0.541483 | 0.542056 | 0.536618 | 0.5932 |
| QE1 | 0.158264 | 0.172488 | 0.171794 | 0.173742 | 0.192043 | 0.1984 |
| QE2 | 0.397824 | 0.415316 | 0.414481 | 0.416824 | 0.438227 | 0.4454 |
| CQM | 0.601001 | 0.60154 | 0.570198 | 0.569143 | 0.567141 | 0.6257 |
| QCB | 0.157026 | 0.165922 | 0.234127 | 0.236401 | 0.237634 | 0.502601 |
Figure 6: Visual evaluation of the fusion of MR-PD and PET Medical Images using (a) MR-PD original Image (b) PET original image (c) MSVD+PCA (d) DWT+PCA (e) MRDCT+PCA (f) LPDCT+PCA (g) FPDCT+PCA and (h) FPDCT+MPCA
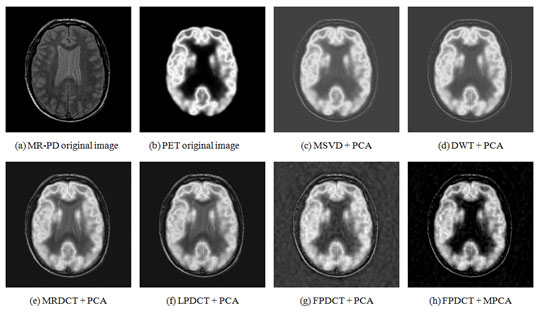
Figure 7 shows the medical MR – T1 / PET images of various fusion algorithms. The fusion image obtained using proposed method shows better visual quality and appreciably no loss of information. Table 6 gives the information about statistical measures of the MR – T1 / PET image processed with different image fusion algorithms. The comparison of the processed fusion images and statistical measures reveals that the proposed method shows better performance than other algorithms.
After thorough investigation of the visual quality and objective evaluation metrics of the images fused by the proposed method, it is evident that the quality of the fused images is efficiently enhances and the appearance of artifacts and regions blurred in the fused images are quite significantly reduced than compared to other transform methods and with and without PCA methods. The obtained results are also produces outperform results than compared to algorithms proposed recently (Zhu Zhiqin et al, 2019, Yin Fei et al., 2017, Liu Xingbin Mei Wenbo and Du Huiqian, 2018, Bin Yang Chao Yang and Guoyu Huang, 2016).
Figure 7: Visual evaluation of the fusion of MR-T1 and PET Medical Images using (a) MR-T1 original Image (b) PET original image (c) MSVD+PCA (d) DWT+PCA (e) MRDCT+PCA (f) LPDCT+PCA (g) FPDCT+PCA and (h) FPDCT+MPCA
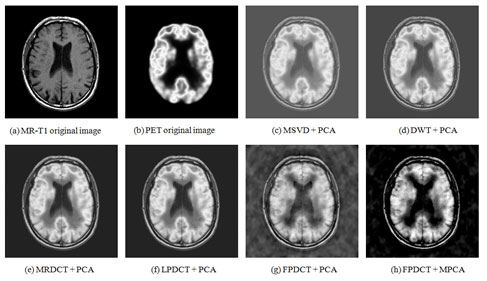
Table 6. Statistical measures of medical images (MR-T1/PET) using MSVD+PCA, DWT+PCA, MRDCT+PCA, LPDCT+PCA, FPDCT+PCA and FPDCT+MPCA
| Evaluation Index | MSVD | DWT | MRDCT | LPDCT | FPDCT | FPDCT+MPCA |
| API | 41.43909 | 41.45071 | 41.64084 | 41.63403 | 42.56744 | 50.32249 |
| QW | 0.343233 | 0.346612 | 0.365363 | 0.365374 | 0.289679 | 0.3647 |
| QE1 | 0.071484 | 0.097302 | 0.106583 | 0.106683 | 0.109173 | 0.1209 |
| QE2 | 0.267365 | 0.311933 | 0.32647 | 0.326624 | 0.330413 | 0.3477 |
| CQM | 0.379906 | 0.389641 | 0.399926 | 0.399008 | 0.324854 | 0.4051 |
| QCB | 0.131176 | 0.154801 | 0.210985 | 0.209323 | 0.222449 | 0.472058 |
CONCLUSION
Image fusion methods have great importance to get multi-resolute image from the multi-focus images of the same scene. A new fusion algorithm based on discrete cosine transformation with frequency partitioning has been attempted. The image extraction feature was made using the modified principle component analysis algorithm, which is at the heart of the proposed method. From the standard data base, various medical images with various modalities were selected and applied to different forms of image fusion methods. For the image fusion algorithms the visual and objective analysis was performed. The results show that the FP-DCT is stronger than the other standard fusion algorithms using a modified PCA.
Conflict of Interest Statement: The author(s) declare(s) that there is no potential conflict of interest relevant to this article was reported.
REFERENCES
Bin Yang Chao Yang and Guoyu Huang (2016) Efficient image fusion with approximate sparse representation International Journal of Wavelets Multiresolution and Information Processing
Vol 14 No 3 Page 1650024 (1 – 15)
Biswas Biswajit and Kanti Sen Biplab (2018) Medical image fusion using PCNN and Poisson-hidden Markov model International Journal of Signal and Imaging Systems Engineering Vol 11 No 2 Page 73-84
Chen Jingyue Zhang Lei Lu Lu Li Qilei Hu Moufa and Yang Xiaomin (2020) A novel medical image fusion method based on Rolling Guidance Filtering Internet of Things doi: https://doi.org/10.1016/j.iot.2020.100172
Fatma El-Zahraa Ahmed El-Gamal Elmogy Mohammed and Ahmed Atwan (2016) Current trends in medical image registration and fusion Egyptian Informatics Journal Vol 17 Page 99–124
Fei Y Wei G and Zongxi S (2017) Medical image fusion based on feature extraction and sparse representation International Journal of Biomedical Imaging Article ID 3020461 Page 1-11
Haskins Grant Kruger Uwe and Yan Pingkun (2020) Deep learning inmedical image registration: a survey Machine Vision and Applications Vol 31 No 8 Page 1-18
Huang Chenxi Tian Ganxun Lan Yisha Peng Yonghong Ng E. Y. K. HaoYongtao Cheng Yongqiang and Che Wenliang (2019) A New Pulse Coupled Neural Network (PCNN) for Brain Medical Image Fusion Empowered by Shuffled Frog Leaping Algorithm Frontiers in Neuroscience Vol 13 No 210 Page 1-10
Jagalingam P and Hegde AV (2015) A Review of Quality Metrics for Fused Image Elsevier Transaction Aquatic Procedia Vol 4 Page 133-142
Jingming Xia Yi Lu and Ling Tan (2020) Research of Multimodal Medical Image Fusion Based on Parameter-Adaptive Pulse-Coupled Neural Network and Convolutional Sparse Representation Application of Computational Methods and Mathematical Models in Nuclear Medicine and Radiotherapy Article ID 3290136 Page 1-13
Jingming Xia Yiming Chen Aiyue Chen and Yicai Chen (2018) Medical Image Fusion Based on Sparse Representation and PCNN in NSCT Domain Computational and Mathematical Methods in Medicine Article ID 2806047 Page 1-12
Kunpeng Wang Mingyao Zheng Hongyan Wei Guanqiu Qi and Yuanyuan Li (2020) Multi-Modality Medical Image Fusion Using Convolutional Neural Network and Contrast Pyramid Sensors Vol 20 No 2169 Page 1 – 17
Liu Xingbin Mei Wenbo and Du Huiqian (2018) Multi-modality medical image fusion based on image decomposition framework and nonsubsampled shearlet transform Biomedical Signal Processing and Control Vol 40 Page 343 – 350
Liu Z Yin H Chai Y and Yang SX (2014) A novel approach for multimodal medical image fusion Expert Systems with Applications Vol 41 No 16 Page 7425–7435
Manchanda Meenu and Sharma Rajiv (2018) An improved multimodal medical image fusion algorithm based on fuzzy transform Journal of Visual Communication and Image Representation Vol 51 Page 76–94
Naidu VPS (2013) Novel Image Fusion Techniques using DCT International Journal of Computer Science and Business Informatics Vol5 No 1 Page 1-18
Rajalingam B and Priya R (2018) Multimodal Medical Image Fusion based on Deep Learning Neural Network for Clinical Treatment Analysis International Journal of Chem Tech Research Vol 11 No 06 Page 160-176
Reena Benjamin J Jayasree T (2018) Improved medical image fusion based on cascaded PCA and shift invariant wavelet transforms International Journal of Computer Assisted Radiology and Surgery Vol 13 Page 229–240
Ramlal J. Sachdeva C. K. Ahuja and N. Khandelwal (2019) An improved multimodal medical image fusion scheme based on hybrid combination of non-subsampled contourlet transform and stationary wavelet transform Int. J. Imag. Syst. Technol. Vol 29 No 2 Page 146-160
Sarmad Maqsood Umer Javed (2020) Multi-modal Medical Image Fusion based on Two-scale Image Decomposition and Sparse Representation Biomedical Signal Processing and Control Vol 57
Satya Prakash Yadav and Sachin Yadav (2020) Image fusion using hybrid methods in multimodality medical images Medical &Biological Engineering & Computing Vol 58 Page 669–687
SilvinaPistonesi Jorge Martinez Silvia Marıa Ojeda and Ronny Vallejos (2018) Structural Similarity Metrics for Quality Image Fusion Assessment: Algorithms Image Processing On Line Vol 8 Page 345-368
Ullah Hikmat Ullah Basharat Wu Longwen Abdalla Fakheraldin YO Ren Guanghui and Zhao Yaqin (2020) Multi-modality medical images fusion based on local-features fuzzysets and novel sum-modified-Laplacian in non-subsampled shearlettransform domain Biomedical Signal Processing and Control Vol 57 No 101724 Page 1 – 14
Valdes Hernandez MDC Ferguson KJ Chappell FM and Wardlaw JM (2010) New multispectral MRI data fusion technique for white matter lesion segmentation: method and comparison with thresholding in FLAIR images European Radiology Vol 20 No 7 Page 1684–1691
Wold S Esbensen Kim and Geladi Paul (1987) Principal Component Analysis Chemometrics and Intelligent Laboratory Systems Elsevier Science Publishers B.V. Vol 2 Page 37-52
Yang Y Tong S Huang S and Lin P (2014) Log-Gabor energy based multimodal medical image fusion in NSCT domain Computational and Mathematical Methods in Medicine Article ID 835481 Page 1-12
Yin Chen and Rick S. Blum (2009) A new automated quality assessment algorithm for image fusion. Image and Vision Computing Vol 27 No 10 Page 1421-1432
Yin Fei Gao Wei and Song Zongxi (2017) Medical Image Fusion Based on Feature Extraction and Sparse Representation International Journal of Biomedical Imaging Vol 5 Article ID 3020461 Page 1-11
Zhang Yu Liu Yu Sun Peng Yan Han Zhao Xiaolin and Zhang Li (2020) IFCNN: A general image fusion framework based on convolutional neural network Information Fusion Vol 54 Page 99 – 118
Zhu Zhiqin Zheng Mingyao Qi Guanqiu Wang Di and Xiang Yan (2019) A Phase Congruency and Local Laplacian Energy Based Multi-Modality Medical Image Fusion Method in NSCT Domain IEEE Access Vol 7 Page 20811-20824

