Dept. of Plant Molecular Biology and Biotechnology, College of Agriculture, Indira Gandhi Krishi Vishwavidyalaya, Raipur, Chhattisgarh (492 012), India
Corresponding author Email: girishchandel@gmail.com
Article Publishing History
Received: 10/06/2019
Accepted After Revision: 21/09/2019
Abiotic stresses such as heat stress, water stress etc. alter plant growth, metabolism and yield. Among them, water stress is a major one as it occurs severely in major producing areas of the world.It is not only due to the deficit of water but also due to other factors such as high temperatures and severe cold that makes plants not able to absorb enough water from soil to grow well and this is called physiological water stress that leads to a series of disorders in physiological and biochemical processes.Millets are resilient to extreme environmental conditions especially to inadequate water and are rich in nutrients.The current study was undertaken to analyse the effects of water stress on Leaf proline, protein, soluble carbohydrates, chlorophyll content of Minor Millets and Rice genotypes under water stress conditions at 5.5 to 6.5 % SMC (Soil Moisture Content) for Millets and 15-18 % SMC for Rice genotypes at vegetative stage. The photosynthetic pigments (Chlorophyll a, chlorophyll b and total chlorophyll) decreased and the biochemical components (Leaf Proline, Protein, Carbohydrates) increased under water stress. Our study revealed that, among the three crops, Little millet genotype, RLM-37 and Rice genotype, R-RF-127 showed maximum increase in proline, protein and carbohydrate content when compared to control ones. This study suggested that, little millet genotype RLM-37 having water stress tolerant adaptive mechanism and perform better under water stress than Rice genotypes.
Abiotic Stress, Biochemical Analysis, Minor Millet, Photosynthetic Pigments
Kathare P, Arun H. P, Chandel G. Water Stress Induced Physiological and Biochemical Responses of Minor Millets and Rice at Vegetative Stage Physiological and Biochemical Profiling of Minor Millets and Rice (Oryza sativa L.) Underwater Stress. Biosc.Biotech.Res.Comm. 2019;12(3).
Kathare P, Arun H. P, Chandel G. Water Stress Induced Physiological and Biochemical Responses of Minor Millets and Rice at Vegetative Stage Physiological and Biochemical Profiling of Minor Millets and Rice (Oryza sativa L.) Underwater Stress. Biosc.Biotech.Res.Comm. 2019;12(3). Available from: https://bit.ly/2ZxVhfN
Copyright © Kathare et al., This is an open access article distributed under the terms of the Creative Commons Attribution License (CC-BY) https://creativecommns.org/licenses/by/4.0/, which permits unrestricted use distribution and reproduction in any medium, provide the original author and source are credited.
Introduction
Abiotic stresses like water stress activates a series of physiological, morphological, molecular and biochemical changes in plants by affecting growth and productivity negatively. Plants deal with water stress by all these responses. Various morphological mechanisms functioning under water stress situation which includes, water stress escape, water stress avoidance, water stress tolerance and water stress recovery, has also been identified (Kholova et al., 2010, Monneveux et al., 2006 and Blum et al., 2005 Fang et al., 2015 ). Under water stress, accommodation of dehydrin like proteins was identified in the leaves and roots of water-stressed plants that lead to protect plants from further dehydration losses. The rate and levels of accumulation of proteins, amino acids and sugars may determine the ability of a genotype to withstand the level of water stress. Minor millet is known for its greater level of tolerance against water stress, salinity and diseases. On the darker side, millet have been included in the “Orphan crop” list due to lack in their trade across the world, extra efforts are required in grain processing as well as in the social stigma attached to these crops as “food for the poor”. Together these negativities have failed them to seek attention of researchers at all, (Fang et al., 2015, Sharma and Khurana, 2014, Dubey et al., 2018, Sushmitha et al., 2018 Kumari et al., 2019).
Diverse abiotic stresses are the reason for the exceptional tolerance of millets including under water stress. Millets are considered as the climate change compliant crops score high when compared with other grains like Wheat and Rice in terms of high nutritional value and marginal growing conditions. Inspite of the unusual, extraordinary, exceptional nutritional qualities of small millet grains and capacities of millet farming systems, the area under small millet production has been shrinking or declining over the last five decades. Rice is a staple food crop and second largest crop in the world with high Drought Sensitivity Index (Karl, 1983) as it dies below 18 % SMC as it is mainly grown under water-logged condition. The molecular biology of minor millets has been explored to the very less extent and there is much that requires investigation, including the establishment of a genome map and sequenced genome.
Material and Methods
Plant material
The experimental materials of the present investigation comprised of minor millet (Little millet includes RLM-37, BL-4, MM-23, BL-8, BL-15-1, OLM-203 and MM-10, Barnyard millet includes Sawa, VL-29, Melghat-1, Melghat-3 and MM-03) and Rice genotypes (R-RF-127,Moroberekan and MTU-1010) sowing was done in pots separately and maintained in green house at 28±2 ºC.Water stress was induced after 30 days of sowing at the vegetative stage under the green house conditions (Figure 1& 2). Plants were watered normally once in a day before the stress imposition and the leaf samples were harvested when the soil moisture content in the stress pots as reached below 10% in Millets and below 20% in Rice genotypes in both control and stress condition. The harvested samples were stored immediately in liquid nitrogen at -800 C.
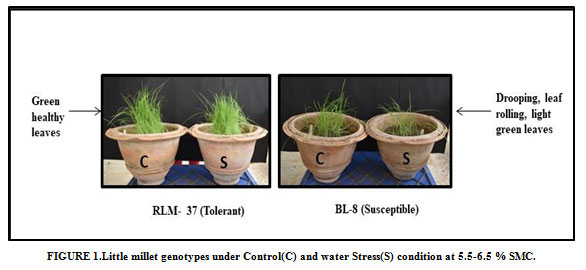 |
Figure 1: Little millet genotypes under Control(C) and water Stress(S) condition at 5.5-6.5 % SMC. |
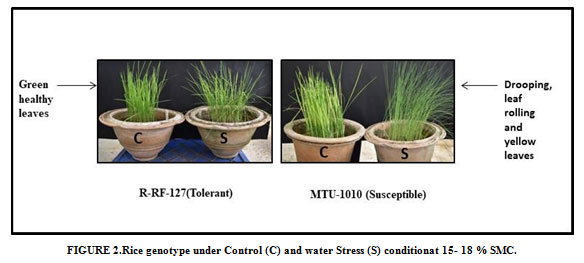 |
Figure 2: Rice genotype under Control (C) and water Stress (S) conditionat 15- 18 % SMC. |
Biochemical estimation was done by following methods
Leaf proline content was estimated by Acid ninhydrin method as given by Bates et al., (1973). Lowry et al. (1951) method was used for estimation of Leaf protein content, Leaf carbohydrate content was estimated by phenol sulphuric acid method proposed by Krishnaveni et al., (1984). Acetone method was used for estimation of Leaf Chlorophyll content given by Arnon (1949).
Statistical Analysis
The effect of water under stress and control condition in genotypes of Millets and Rice was analysed statistically by CRD by the application of OP-STAT, an online computerized software developed at BHU.
Results and Discussion
Biochemical characterization of fifteen genotypes of Minor millets and Rice
After 6 days of water stress imposition and at 6% Soil Moisture Content (SMC) for Minor millets and after 4 days of same and at 18% SMC for Rice genotypes. The wide variation for proline, protein, carbohydrates and chlorophyll (Chl a, chl b and total chl) content was recorded in stress tissue as when compared to that of control one’s for fifteen genotypes of Minor millets and Rice.
Effect of water stress on leaf Proline content among Minor millets and Rice genotypes
The leaf Proline was estimated by Acid ninhydrin method. Accumulation of proline as an osmolyte under water stress was observed in different Millet and Rice genotypes. The proline content ranged from 0.391 to 1.102 µ mole/g f.wt for stress; whereas in controlled condition it ranged from 0.270 to 0.925 µ mole/g f.wt in Little millet genotypes (Table 1). The Little millet genotype RLM-37(1.102 µ mole/g f.wt) had highest increase in proline content and OLM-203 (0.391 µmole/g f.wt) was recorded with lowest increase in proline content in stress tissue over control. Similarly the proline content ranged from 0.192 to 7.869 µ mole/tissue under stress; whereas under control condition proline content ranged from 0.015 to 0.204 µ mole/tissue. A significant increase in proline has been observed in response to water stress, favouring osmotic adjustment. When comparing fold increase in proline content under stress when compared with control among eight genotypes BL-15-1 was recorded with (63.460) higher fold increase Sushmitha et al. (2018).
The proline content ranged from 0.146 to 0.903 µ mole/g f.wt for stress; whereas in controlled condition it ranged from 0.111 to 0.520 µmole/g f.wt(Table 1). The Rice genotype, R-RF-127 had highest increase in proline content (0.903 µ mole/g f.wt) and MTU-1010 (0.146 µ mole/g f.wt) was recorded with lowest increase in proline in stress tissue when compared to control.The mean of all the genotypes selected was 0.481µ mole/g f.wtand it ranged from 0.111 to 0.925 µ mole/g f.wtin controlled condition and was increased to 0.826µ mole/g f.wt and it ranged from 0.146 to 1.102µ mole/g f.wtin stress tissue. Among three crops, Little millet genotype, RLM-37(1.102µ mole/g f.wt) was found to have highest increase in proline and Rice genotype, MTU-1010 (0.146µ mole/g f.wt) was found to have lowest increase in proline when compared to control(Table 1).Hence according to our study RLM-37 of Little millet shown to follow tolerant genotype characteristics. There was positive correlation in proline under stress condition. It increased when plants were exposed to stress in all the three crop genotypes. In general, proline content of leaves increased with the decline in irrigation water, suggesting that the production of proline is probably a common response of millet under water stress conditions. The role of proline in adaptation and survival of plants has been well documented by Watanabe et al. (2000) and Saruhan et al. (2006).Osmotic adjustment through accumulation of cellular solutes, such as proline, has been reported as one of the possible means for overcoming osmotic stress caused by the loss of water by Caballero et al.(2005). Teixeira and Pereira (2006) indicated that proline content significantly increased in all potato organs in response to stress condition. This increment was more remarkable in roots and tubers than in the leaves. High levels of proline enable the plant to maintain low water potentials causing the accumulation of compatible osmolytes that makes additional water to be taken up from the environment by the plant, thus buffering the immediate effect of water limit within the organism (Mousa and Abdel-Aziz, 2008).
Lobato et al. (2011) revealed that there was increment in the accumulation of proline and free amino acids in soybean (Glycine max cv.Sambaiba) leaves under water limited condition 67 and 388.1%, respectively. On the basis of accumulation of leaf proline content under water stress condition, Little millet genotype, RLM-37 and Finger millet genotype, BR-36 was found to be maximum compared to tolerant genotype GPU 67 hence were identified as potential drought tolerant genotypes by Dubey et al. (2018).
Effect of water stress on leaf Protein content among Minor millets and Rice genotypes
The leaf Protein content was estimated by the method given by Lowryl. Ashraf and Foolad (2005) had reported that higher protein content in tolerant genotypes under water stress condition is due to higher DNA and RNA content, which enhances synthesis and inhibits protein decomposition. Sushmitha et al. (2018) reported that the wide variation for protein content was found in stress tissues for eight Little millet genotypes (BL-8, MM-23, MM-10, BL-15-1, RLM37, OLM-203, BL-4, JK-8). The protein content ranged from 0.040 to 0.586 mg/tissue under stress condition, whereas 0.027 to 0.080 mg/tissue under control condition. BL-4 (8.746) had the highest fold increase. The protein content ranged from 0.314 to 0.558 mg/g f.wt in stress condition and from 0.236 to 0.432 mg/g f.wtin control in Little millet genotypes(Table 1). The Little millet genotype RLM-37(0.558 mg/g f.wt) had the highest increase in protein content and BL-8 (0.314 mole/g f.wt) was recorded with lowest protein content in stress tissue.
The protein content ranged from 0.278 to 0.538 mg/g f.wt in stress condition and from 0.269 to 0.460 mg/g f.wt in control condition (Table 1). The Rice genotype, R-RF-127 (0.538 mg/g f.wt) had the highest protein in stress and MTU-1010 (0.278 mg/g f.wt) had the lowest protein in stress when compared to control. The mean of all the genotypes selected was 0.408mg/g f.wt and it ranged from 0.278 to 0.558mg/g f.wtin stress tissue and the mean was 0.291mg/g f.wtand it ranged from 0.125 to 0.46 mg/g f.wtin controlled condition. Among the three crops, little millet genotype, RLM-37 (0.558mg/g f.wt) was reported with highest increment in protein and tends to be a tolerant genotype and MTU-1010 (0.278mg/g f.wt) was reported with lowest increase in protein under stress and tends to be a susceptible genotype (Table 1).There was increase in protein content in almost all genotypes of the three crops under stress condition. Hence the biochemical trait protein is positively correlated with both Millets and Rice, under water stress. Little millet genotype, RLM- 37 was found to show maximum protein content compared to tolerant genotype GPU 67 by Dubey et al,(2018).
Effect of water stress on leaf Carbohydrate content among Minor millets and Rice genotypes.
Leaf carbohydrate content was estimated by phenol sulphuric acid method proposed by Krishnaveni et al., (1984). Total carbohydrates in the leaves and seeds were determined by phenol sulphuric acid method. The observation of carbohydrate content under control and stress condition showed that the carbohydrate content increases significantly with prolongation to water stress. The carbohydrate content ranges from 0.127 to 0.382 mg/ g f.wt in stress condition whereas 0.061 to 0.495 mg/ g f.wt in controlled condition (Table 1.).Water stress induced highest increase in carbohydrate content was obtained in Little millet genotype RLM-37 (0.382 mg /g f.wt) and Little millet genotype, OLM-203(0.127 mg /g f.wt) had shown the lowest increase in Carbohydrates content under stresswhen compared to control. Likewise the carbohydrate content ranges from 234.221 to 612.222 mg/tissue under stress condition whereas 153.907 to 302.313 mg/tissue in control condition. BL-15-1 (2.705) had the highest fold increase by Sushmitha et al. (2018).
The carbohydrate content ranges from 0.092 to 0.378 mg/ g f.wt in stress condition where as 0.076 to 0.084 mg/ g f.wt in controlled condition(Table 1).Rice genotype, R-RF-127 (0.378 mg/ g f.wt) had shown the highest increase in Carbohydrates and MTU-1010 (0.092 mg/ g f.wt) had shown the lowest increase in Carbohydrates under stress.
Water stress induced highest increase in carbohydrate content was recorded in Little millet genotype, RLM-37 (2.571 fold) followed by Finger millet genotype PR-10 14 (2.035 fold) when compared with tolerant genotype GPU-67by Dubey et al.(2018).The mean of all the genotypes selected was 0.198 mg/g f.wt and it ranged from 0.092 to 0.382 mg/g f.wtin stress tissue and the mean was 0.118 mg/g f.wt and it ranged from 0.039 to0.198 mg/g f.wtin controlled condition. Among the three crops, Little millet genotype, RLM-37(0.382mg/g f.wt) was reported with highest increase in carbohydrates content when compared to control and tends to be a tolerant genotype and MTU-1010 (0.092mg/g f.wt) was reported with lowest carbohydrates content(Table 1)and tends to follow susceptible genotype characteristics. It was found to have positive correlation with stress induction. There was increase in carbohydrates content in most of the genotypes of the three crops under stress condition. Hence the biochemical trait, carbohydrate is positively correlated with both, Millets and Rice under water stress. The accumulation of sugars in response to water stress is quite well established (Izanloo et al., 2008; Watanabe et al., 2000).
Soluble sugars may function as an osmo protectant, stabilizing cellular membranes and maintaining turgor pressure. Gene ontology attributes such as proline and soluble sugar accumulations were highly enriched in the water stress-up-regulated genes, suggesting that those metabolic pathways are important in responses to water stress. Indeed, the importance of many of these pathways to water stress tolerance has been empirically supported by transgenic experiments by Umezava et al. (2006). Hermalina et al. (2014) revealed that, total soluble sugar and Proline content in the leaves were significantly (p<0.05) increased due to the increment in the level of water stress. The differences in the responses to water stress among the nine selected corn cultivars suggested that each cultivar has different ability to synthesis proline and total soluble sugar with an increase in water stress treatment.
Effect of water stress on Chlorophyll content among Minor millets and Rice genotypes.
Acetone method was used for estimation of Leaf Chlorophyll content given by Arnon. Chlorophyll maintenance is essential for photosynthesis under water stress. The chlorophyll a, chlorophyll b and total chlorophyll content ranges from 0.797 to 2.633 mg/g f.wt, 0.359 to 0.701 mg/g f.wt and 1.146 to 2.418 mg/g f.wt for stressed leaf tissue where as in control condition, it ranges from 0.797 to 2.633 mg/ g f.wt, 0.483 to 1.500 mg/ g f.wt and 1.326 to 4.963 mg/ g f.wtin Little millet genotypes(Table 2). Chl a,chl b and total chl was found to have negative correlation on stress induction. There was decrease in chlorophyll a, b and total chlorophyll content in almost all the genotypes of the three crops under stress condition (Table 2).Among the Minor millet genotypes, Little millet genotype, OLM-203 had the lowest decrease in Chlorophyll a content (0.764mg/g f.wt), MM-10 in Chlorophyll b content (0.359mg/g f.wt) and OLM-203 in total chlorophyll content(1.146 mg/g f.wt) and Little millet genotype, RLM-37 had the highest decrease in Chlorophyll a content (1.359 mg/g f.wt), Chlorophyll b content(0.701 mg/g f.wt) and Total chlorophyll content (2.418 mg/g f.wt) under water stress as when compared to control.
Sushmitha et al. (2018) revealed that, a wide variation for chlorophyll content was found in stress tissues for eight Little millet genotypes (MM-23, BL-8, RLM-37, OLM-203, MM-10, BL-15-1, BL-4, JK-8). Chlorophyll a, Chlorophyll b and Total Chlorophyll content ranged from 0.783 to 2.441 mg/tissue, 0.403 to 1.332 mg/tissue, 1.330 to 3.811 mg/tissue respectively for stress leaf tissue whereas under control condition it ranged from 1.223 to 3.075 mg/tissue, 0.597 to 3.006 mg/tissue, 1.819 to 6.047 mg/tissue respectively. The genotype MM-10 had the highest fold reduction of 2.011 mg/tissue in the total chlorophyll content, where as in case of chlorophyll a, the genotype MM-23 showed highest fold reduction of 2.00 and in chlorophyll b, the genotype JK-8 showed the highest fold decrease of 3.00.
In rice genotypes, chlorophyll a, chlorophyll b and total chlorophyll content ranges from 0.400 to 0.933mg/g f.wt, 0.203 to 0.434 mg/g f.wt and 1.133 to 1.877 mg/g f.wt for stressed leaf tissue where as in control condition it ranged from 0.400 to 1.263mg/ g f.wt, 0.313 to 0.880 mg/ g f.wt and 1.528 to 3.077 mg/g f.wt respectively (Table 2.). Among the Rice genotypes, Moroberekan had the lowest decrease in Chlorophyll a content (0.441 mg/ g f.wt), MTU-1010 in Chlorophyll b content (0.203 mg/g f.wt) and MTU-1010 in total chlorophyll content(1.133 mg/g f.wt)and R-RF-127(0.933 mg/g f.wt), had the highest decrease in Chlorophyll a content, Chlorophyll b content (0.434 mg/g f.wt) and Total chlorophyll content (1.877 mg/g f.wt) under water stress. Manirannan et al. (2007) found a depression in CHL a and b and TC in Helianthus annuus L. under water stress. The chlorophyll was decreased from well watered (control) condition to severe water stress (13 DID) and there was plant pigment increment by the age of maturity in plant by Paul et al.(2013). At the highest stressed condition with respect to its control set, CR dhan 40 showed best performance for chlorophyll content by Kumari et al.(2019).
Dubey et al. (2018) concluded that Reduced fold decrease in chlorophyll a content was recorded in finger millet genotype, GPU 67 (1.129 Fold) followed by BR 36 (1.265 fold). The mean of all the genotypes selected was 1.010 mg/g f.wt and it ranged from 0.4 to 1.359 mg/g f.wtin stress tissue and the mean was 1.337 mg/g f.wt and it ranged from 0.4 to 2.633 mg/g f.wtin controlled condition. Among the three crops, Rice genotype, MTU-1010 (0.4mg/g f.wt) was recorded with lowest reduction in chlorophyll a content and Little millet genotype, RLM-37 (1.359 mg/g f.wt) was reported with highest reduction in chlorophyll a content under water stress.
Out of seven genotypes under study, minimum decrease was reported in Little Millet genotype OLM-203 (0.994 fold) followed by finger millet genotype GPU-67 (1.254 fold) by Dubey et al.,(2018). The mean of all the genotypes selected was 0.488 mg/g f.wt and it ranged from 0.203 to 0.701 mg/g f.wt in stress tissue and the mean was 0.747 mg/g f.wt and it ranged from 0.313 to 1.500 mg/g f.wt in controlled condition. Among the three crops, Rice genotype,MTU-1010 (0.203 mg/g f.wt) was recorded with lowest decrease in chlorophyll b content and Little millet genotype, RLM-37 (0.701 mg/g f.wt) was recorded with highest decrease in chlorophyll b and under stress.
Dubey et al. (2018) reported that, the minimum decrease were recorded in finger millet GPU-67 (1.173 fold) followed by PR-10 14 (1.440 fold) and BR-36 (1.709 fold). The mean of all the genotypes selected was 1.657 mg/g f.wt and it ranged from 1.133 to 2.418 mg/g f.wtin stress tissue and it increased to the mean 2.451 mg/g f.wt and it ranged from 1.326 to 4.963 mg/g f.wtin controlled condition. Among the three crops, Rice genotype, MTU-1010 (1.133mg/g f.wt) was recorded with lowest decrease and Little millet genotype, RLM-37(2.418mg/g f.wt) was recorded with highest decrease in total chlorophyll under stress (Table 2).
Among the three crops, Rice genotype, MTU-1010was recorded with lowest reduction in chlorophyll a, chlorophyll b and total chlorophyll content as already in control itself it was having less chlorophyll content so it is showing less chlorophyll content and Little millet genotype, RLM-37 was reported with highest reduction in chlorophyll content under water stress but found to be tolerant genotype by morphological, physiological and majority of aspects.
Table 1: Statistical Analysis of biochemical traits (Proline, Protein and Carbohydrates) for Minor millets and Rice genotypes under control and stress
| Proline | Proline | Protein | Protein | Carbohydrate | Carbohydrate | |
| Genotypes | Control | Stress | Control | Stress | Control | Stress |
| (µ mole/gf.wt) | (µ mole/gf.wt) | (mg/g f.wt) | (mg/gf.wt) | (mg/g f.wt) | (mg/g f.wt) | |
| RLM-37 | 0.397±0.001 | 1.102±0.001 | 0.264±0.001 | 0.558±0.001 | 0.061±0.001 | 0.382±0.001 |
| BL-4 | 0.636±0.000 | 0.988±0.001 | 0.330±0.000 | 0.335±0.001 | 0.070±0.000 | 0.135±0.001 |
| MM-23 | 0.491±0.001 | 1.000±0.058 | 0.236±0.001 | 0.345±0.000 | 0.078±0.001 | 0.181±0.001 |
| BL-8 | 0.925±0.001 | 1.022±0.001 | 0.262±0.000 | 0.314±0.000 | 0.198±0.001 | 0.169±0.001 |
| BL-15-1 | 0.448±0.001 | 0.495±0.001 | 0.125±0.000 | 0.432±0.000 | 0.495±0.001 | 0.275±0.001 |
| OLM-203 | 0.356±0.002 | 0.391±0.001 | 0.277±0.001 | 0.354±0.000 | 0.070±0.001 | 0.127±0.001 |
| MM-10 | 0.270±0.000 | 0.482±0.001 | 0.322±0.001 | 0.391±0.001 | 0.197±0.001 | 0.203±0.001 |
| SAWA | 0.391±0.001 | 1.084±0.001 | 0.265±0.001 | 0.538±0.000 | 0.039±0.001 | 0.178±0.000 |
| VL-29 | 0.471±0.001 | 1.000±0.000 | 0.330±0.001 | 0.362±0.000 | 0.091±0.001 | 0.150±0.001 |
| MELGHAT-1 | 0.848± 0.001 | 0.916±0.001 | 0.280±0.045 | 0.432±0.001 | 0.071±0.001 | 0.140±0.001 |
| MELGHAT-3 | 0.472± 0.001 | 1.022±0.000 | 0.262±0.001 | 0.319±0.001 | 0.073±0.000 | 0.151±0.000 |
| MM-03 | 0.508±0.000 | 1.001±0.001 | 0.278±0.001 | 0.425±0.001 | 0.093±0.000 | 0.177±0.000 |
| R-RF-127 | 0.378±0.001 | 0.903±0.001 | 0.407±0.001 | 0.538 ±0.000 | 0.076±0.001 | 0.378±0.000 |
| Moroberekan | 0.520±0.001 | 0.850±0.001 | 0.460±0.000 | 0.511±0.001 | 0.084±0.001 | 0.235±0.000 |
| MTU-1010 | 0.111±0.001 | 0.146±0.001 | 0.269±0.001 | 0.278±0.001 | 0.082±0.001 | 0.092±0.000 |
| Mean | 0.481 | 0.826 | 0.291 | 0.408 | 0.118 | 0.198 |
| Maximum | 0.925 | 1.102 | 0.46 | 0.558 | 0.198 | 0.382 |
| Minimum | 0.111 | 0.146 | 0.125 | 0.278 | 0.039 | 0.092 |
| CD(p=0.05) | 0.002 | 0.043 | 0.034 | 0.003 | 0.001 | 0.002 |
| SE(m) | 0.001 | 0.015 | 0.012 | 0.001 | 0.001 | 0.001 |
| SE(d) | 0.001 | 0.021 | 0.016 | 0.001 | 0.001 | 0.001 |
| C.V. | 0.243 | 3.126 | 6.894 | 0.474 | 0.754 | 0.487 |
condition
Table 2: Statistical Analysis of photosynthetic pigments (Chlorophyll a, chlorophyll b and Total chlorophyll) for Minor millets and Rice genotypes
| Genotypes | Chlorophyll a Control
(mg/gf.wt) |
Chlorophyll a Stress
(mg/gf.wt) |
Chlorophyll b Control
(mg/gf.wt) |
Chlorophyll b Stress
(mg/gf.wt) |
Total Chl control
(mg/gf.wt) |
Total Chl Stress
(mg/gf.wt) |
| RLM-37 | 2.633±0.001 | 1.359±0.001 | 1.500±0.000 | 0.701±0.001 | 4.963±0.001 | 2.418±0.001 |
| BL-4 | 1.498±0.000 | 1.264±0.001 | 0.702±0.001 | 0.473±0.001 | 2.499±0.001 | 1.426±0.000 |
| MM-23 | 1.338±0.001 | 0.951±0.000 | 0.568±0.001 | 0.554±0.001 | 1.893±0.001 | 1.519±0.001 |
| BL-8 | 1.290±0.000 | 1.150±0.000 | 0.690±0.000 | 0.596±0.004 | 1.852±0.000 | 1.747±0.000 |
| BL-15-1 | 1.076±0.001 | 0.980±0.006 | 0.656±0.000 | 0.461±0.001 | 1.946±0.000 | 1.530±0.006 |
| OLM-203 | 0.797± 0.001 | 0.764±0.001 | 0.483± 0.001 | 0.382±0.000 | 1.326±0.000 | 1.146±0.001 |
| MM-10 | 1.274±0.001 | 0.872±0.001 | 0.513±0.001 | 0.359±0.001 | 1.491±0.001 | 1.230±0.000 |
| SAWA | 2.600±0.000 | 1.370±0.001 | 1.168±0.000 | 0.648±0.001 | 4.048±0.001 | 2.298±0.000 |
| VL-29 | 2.231±0.001 | 1.296±0.004 | 0.928±0.001 | 0.516±0.001 | 2.225±0.000 | 1.956±0.001 |
| MELGHAT-1 | 1.578±0.000 | 1.287±0.001 | 0.811±0.001 | 0.629±0.001 | 3.254±0.001 | 1.854±0.000 |
| MELGHAT-3 | 1.578±0.000 | 1.271±0.000 | 0.786±0.008 | 0.600±0.006 | 2.545±0.000 | 2.049±0.001 |
| MM-03 | 1.442±0.001 | 0.958±0.001 | 0.652±0.001 | 0.428±0.001 | 2.093±0.000 | 1.387±0.000 |
| R-RF-127 | 1.263±0.001 | 0.933±0.001 | 0.880±0.000 | 0.434±0.001 | 3.077±0.000 | 1.877±0.001 |
| Moroberekan | 0.500±0.000 | 0.441±0.001 | 0.567±0.001 | 0.343±0.004 | 2.027±0.000 | 1.296±0.001 |
| MTU-1010 | 0.400±0.001 | 0.400±0.000 | 0.313±0.001 | 0.203±0.001 | 1.528±0.001 | 1.133±0.001 |
| Mean | 1.337 | 1.010 | 0.747 | 0.488 | 2.451 | 1.657 |
| Maximum | 2.633 | 1.359 | 1.500 | 0.701 | 4.963 | 2.418 |
| Minimum | 0.400 | 0.400 | 0.313 | 0.203 | 1.326 | 1.133 |
| CD(p=0.05) | 0.002 | 0.005 | 0.006 | 0.006 | 0.001 | 0.005 |
| SE(m) | 0.001 | 0.002 | 0.002 | 0.002 | 0.000 | 0.002 |
| SE(d) | 0.001 | 0.003 | 0.003 | 0.003 | 0.001 | 0.002 |
| C.V. | 0.063 | 0.319 | 0.473 | 0.737 | 0.035 | 0.164 |
NOTE: Each mean indicates: Mean of three independent replicates at each time. μ mole/ g f.wt : micro mole per gram fresh weight, mg/ g f.wt : milligram per gram fresh weight.
Conclusion
Plants in water stress time adapt themselves by making some changes in their physiological and biochemical features. Accumulations of soluble carbohydrates, proline and protein increased under water stress. Chlorophyll content are more resistant to water stress.Our current study reveals that, after 6 days of water stress imposition and at 6% Soil moisture content for Minor milletand after 4 days of same at 18% SMC for Rice genotypes.Among Minor millets and Rice genotypes, RLM-37 was found to be show maximum increase in proline, carbohydrate and protein which indicates their comparable potential for water stress tolerance. This can be taken as a base for water stress tolerance response of the crop, which may be useful for further validation studies of genes for water stress tolerance in millet and other crop plants.
Acknowledgments
Seed material was provided by ZARI, Jagadalpur, KVK Shivpuri, Dr. PDKV Akola are thankfully acknowledged.
References
Arnon, D.I., (1949). Copper enzyme polyphenoloxides in isolated chloroplast in Beta vulgaris. Plant physiology, 24: 1–15.
Ashraf, M., Foolad, M.R.,( 2005). Role of Glycine Betaine and Proline in Improving Plant Abiotic Stress Resistance. Environmental and Experimental Botany 59(2), 206–216. doi:10.1016/j.envexpbot 2005.12.006.
Bates, L.S., Waldran, R.P. and Teare, I.D. (1973). Rapid determination of free proline for water stress studies. Plant Soil, 39: 205-208.
Blum, A. (2005). Drought resistance, water-use efficiency, and yield potential – are they compatible, dissonant, or mutually exclusive? Australian Journal of Agricultural Research, 56(11):1159–1168.
Caballero, J.I., Verduzco, C.V., Galan, J., Jimenz, E.S.D., (2005). Proline accumulation as a symptom of drought stress in maize: A tissue differentiation requirement. Journal of Experimental Botany 39(7), 889–897.
Dubey, M., Sao, A. and Chandel, G., (2018).Characterization of Minor Millets (Panicum sumatrense and Eleusine coracana) for Trait Related to Moisture Stress Tolerance. International Journal of Bio-Resource & Stress Management, 9(2).
Fang, Y.J. and Xiong, L.Z. (2015).General mechanisms of drought response and their application in drought resistance improvement in plants. Cellular and Molecular Life Sciences, 72(4): 673–689.
Hermalina, S., Karuwal, R.L., (2014). Proline and total soluble sugar content at the vegetative phase of six corn cultivars from Kisar Island Maluku, grown under drought stress conditions. International Journal of Plant Biology.volume 6, 6071
Izanloo, A., Condon, A.G., Langridge, P., Tester, M., Schnurbusch, T., (2008). Different mechanisms of adaptation to cyclic water stress in two South Australian bread wheat cultivars. Journal of Experimental Botany 59, 3327–3346.
Karl, T.R., (1986). The sensitivity of the Palmer Drought Severity Index and Palmer’s Z-index to their calibration coefficients including potential evapotranspiration. Journal of Climate and Applied Meteorology, 25(1), pp.77-86.
Kholova, J. (2010). Understanding of terminal drought tolerance mechanisms in pearl millet [Pennisetum glaucum (L.) R. Br.] in Faculty of Science, Charles University in Prague Prague, 115.
Krishnaveni, S., Theymoli, Balasubramanian., and Sadasivam, S. (1984). Phenol sulphuric acid method. Food chem., 15-229.
Kumari, R., Choudhury, D., Goswami, S. and Dey, N., (2019) Physiological, biochemical, and molecular screening of selected upland rice (Oryza sativa L.) lines from eastern India. Bulletin of the National Research Centre, 43(1), p.56.
Lobato, A.K.S., Oliveira Neto, C.F., Costa, R.C.L., Santos Filho, B.G., Cost, R.C.L., Cruz, F.J.R., Neves, H.K.B., Lopes, M.J.S., (2011). Physiological and biochemical behavior in soybean (Glycine max cv. Sambabia) plants under water deficit. Australian Journal of Crop Science 5(1), 55–60.
Lowry, O.H., Rosenbrough, N.J., Farr, A.L., Randall, R.J., (1951).Protein measurement with the Folin Phenol reagent. Journal of Biological Chemistry, 193: 265–275.
Manirannan, P., Abdul Jaleel, C., Sankar, B., Kishorekumar, A., Somasundaram, R., Lakshmanan, G.M., Panneerselvam, R., (2007). Growth, biochemical modifications and proline metabolism in Helianthus annuus L. as induced by drought stress. Colloids and Surf B: Biointerfaces 59, 141–149.
Monneveux, P. and J.P. Ribaut, (2006).Secondary traits for drought tolerance improvement in cereals, in Drought adaptation in cereals, J.M. Ribaut, Editor. Food Products Press: New York, 97–143.
Mousa, H.R., Abdel-Aziz, S.M., (2008). Comparative response of drought tolerant and drought sensitive maize genotypes to water stress. Australian Journal of Crop Science 1, 31–36.
Saruhan, N., Terzi, R, Kadioglu, A., (2006). The effects of exogenous polyamines on some biochemical changes during drought stress in Ctenanthesetosa. Acta Biologica Hungarica 57, 221–229.
Sharma M and Paul Khurana SM. (2014).Alternative Healthy Food Crops J Nutr Food Sci,4:4.
Sushmitha, B., Arun, P.H., Dubey, M. and Chandel, G., (2018). Transcript analysis of the known moisture stress responsive gene orthologs among different genotypes of Little millet, Panicum sumatrense. Bioscience Biotechnology Research Communications, 11(2), pp.335-346.
Teixeira, J., Pereira, S., (2006). High salinity and drought act on an organ-dependent manner on potato glutamine synthetase expression and accumulation. Journal of Experimental Botany 60, 121–126.
Umezawa, T., Fujita, M., Fujita, Y., Yamaguchi Shinozaki, K., Shinozaki, K., (2006). Engineering drought tolerance in plants: discovering and tailoring genes to unlock the future. Current Opinion in Biotechnology 17, 113–122.
Watanabe, S., Kojima, K., Ide, Y., Satohiko, S., (2000). Effects of saline and osmotic stress on proline and sugar accumulation in Populus euphratica in vitro.Plant Cell, Tissue and Organ Culture 63,199–206.

