1 Multidisciplinary Food and Nutrition Research Team: Regional Center of Excellence in Food and Nutrition, Faculty of Science and Technology, Marien Ngouabi University, Brazzaville, Congo
2 Process Engineering Laboratory, Higher Polytechnic Normal School,
Marien Ngouabi University, Brazzaville, Congo.
3Agro-resource valorization laboratory
*Corresponding author Email: celestine.kiminou@gmail.com
Article Publishing History
Received: 20/06/2025
Accepted After Revision: 11/09/2025
In the Republic of Congo, banana production is estimated at approximately 80,000 tons per year, mainly in regions far from the capital. Due to their climacteric nature, many bananas arrive overripe and soft after transport, becoming unattractive for consumption, leading to significant postharvest losses. Traditionally, Musa sp. is consumed fresh, leading to the rejection of a large quantity of overripe fruit. This study aimed to valorize Musa sp. by producing an alcoholic beverage, commonly known as “banana wine.” The juice extracted from ripe bananas was stabilized, chaptalized, and fermented using Saccharomyces cerevisiae. Physicochemical parameters (temperature, °Brix, pH, titratable acidity, density, and alcohol content) were monitored throughout the fermentation. A sensory evaluation of the final product was also performed. Before fermentation, the banana must had a temperature of 29°C, 23°Brix, pH 3.84, density 1.086, and 0% alcohol. After fermentation, the wine had a temperature of 18°C, 7.5°Brix, pH 4.0, density 0.993, and 12.56% alcohol. These parameters comply with international quality standards (WHO). The results demonstrate that bananas can be effectively converted into a quality alcoholic beverage, thus reducing post-harvest losses while offering a potential new agro-industrial product for Congo.
Musa sp., banana wine, fermentation, valorization, physicochemical properties, post-harvest losses.
Ngounga C. K, Loumouamou B. W, Binaki A. F, De-bazebidia P. O. N, Nzikou J. M. Valorization of Musa sp. in the Production of An Alcoholic Beverage: The Banana Wine. Biosc.Biotech.Res.Comm. 2025;18(3).
Ngounga C. K, Loumouamou B. W, Binaki A. F, De-bazebidia P. O. N, Nzikou J. M. Valorization of Musa sp. in the Production of An Alcoholic Beverage: The Banana Wine. Biosc.Biotech.Res.Comm. 2024;18(3). Available from: <a href=”https://shorturl.at/Pacev“>https://shorturl.at/Pacev</a>
INTRODUCTION
Banana (Musa spp.) is one of the most important fruits for food and economy in many tropical regions. Despite high global and local production, a significant portion of the crop is lost during post-harvest stages (harvesting, transport, storage, and marketing), affecting food security and producers’ incomes. In sub-Saharan Africa, post-harvest losses for fruits and vegetables can exceed 40% of production, requiring adapted value-added strategies (Kikulwe et al., 2021, Affognon et al., 2023).
Recycling bananas and their by-products (flesh, peels, etc.) into higher-value products is a promising way to transform these losses into economic and nutritional opportunities. Several recent reviews have highlighted the nutritional and functional potential of banana by-products, as well as processing methods for obtaining juices and musts suitable for fermentation (Hossain et al., 2022; Memon et al., 2023).
Among fermented products, “banana wine” has been studied in several contexts. The process generally involves juice extraction, stabilization, chaptalization, and fermentation by Saccharomyces cerevisiae, resulting in an alcoholic beverage with acceptable physicochemical and sensory characteristics (Bukar et al., 2020; Ssemugabo et al., 2021). Recent work has also validated standardized protocols to evaluate the fermentation performance of S. cerevisiae strains and control the quality of fruit wines (Padilla et al., 2022).
However, the literature shows significant variability in alcohol yields and sensory profiles depending on the Musa species/variety, maturity stage, must treatment, and yeast strain used (Hossain et al., 2022; Ssemugabo et al., 2021). In the Congolese context, where bananas are produced mainly in rural areas far from the capital and where significant post-harvest losses have been reported, banana wine production represents an attractive way to reduce losses, create local added value, and diversify producers’ outlets (Kikulwe et al., 2021; Affognon et al., 2023).
The objective of this study is therefore to assess the technological feasibility and the physicochemical and organoleptic quality of a banana wine produced from Musa sp. cultivated in Congo, following a protocol for preparing the must (extraction, stabilization, chaptalization) and fermentation by S. cerevisiae.
MATERIAL AND METHODS
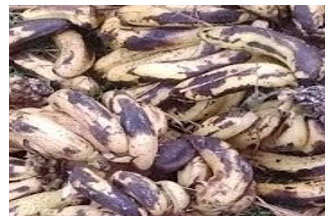
Plant Material: The plant material used in this study consisted of dessert bananas (Musa sp.) purchased at the main train station in Brazzaville, Republic of Congo (Figure 1). The fruits were selected based on their commercial maturity, with no visible signs of deterioration or fungal contamination.
Figure 1: Fruits of Musa sp
Extraction of the Must : The banana juice (initial must) was extracted according to the following steps:
- Fruit Cleaning: Washing with potable water to remove surface impurities.
- First Weighing: Determination of the total mass of the raw fruit.
- Peeling: Manual removal of the peel.
- Second Weighing: Net mass of the pulp obtained.
- Dividing: Slicing into small pieces to facilitate extraction.
- Filtration: Extraction of the juice by mechanical pressing followed by filtration through sterile cheesecloth.
The resulting must was immediately stabilized by the addition of potassium metabisulfite (50 mg/L) to limit enzymatic oxidation and microbial growth (Amerine & Ough, 1980).
Banana (Musa sp.) Wine Production Process : Wine production from banana (Musa sp.) follows a series of technological steps aimed at transforming the must into a stable, aromatic, and clear alcoholic beverage. Banana wine production followed the following steps:
- Stabilization: To limit the growth of unwanted microorganisms while preserving yeast activity, the must is initially stabilized by adding metabisulfite. This treatment controls the microbial flora without inhibiting fermentation.
- Chaptalization: Chaptalization involves adjusting the sugar content of the must by adding sucrose to achieve the desired alcohol content and improve the sweetness of the final product. The sugar level was measured using a refractometer, set at 23°Brix.
- Cooling: The must, obtained after thermal extraction, is cooled to approximately 25°C. This temperature is optimal for initiating alcoholic fermentation, generally effective between 25 and 30°C.
- Pitching: The must is inoculated with a previously rehydrated dry strain of Saccharomyces cerevisiae. A preliminary fermentation called “pied de cuve” is carried out to prepare the starter: 5g of yeast is incorporated into a portion of must at 25°C. The appearance of foam after 15 minutes confirms fermentation activity.
- Main fermentation: The starter is then introduced into the main must, triggering alcoholic fermentation. This is carried out in 10L carboys equipped with aseptic bungs to allow the CO₂ to escape. The fermentable sugars are then converted into ethanol, with the release of carbon dioxide.
- First siphoning: Once fermentation is complete, the wine is decanted to remove the lees deposited at the bottom of the carboy. This operation is carried out using a siphon.
- Secondary fermentation: Malolactic fermentation (MLF) converts malic acid to lactic acid, thus reducing the wine’s acidity. It takes place at a temperature of 20 to 23°C. This phase is less active due to the reduction in fermentable sugars and the inhibition of yeast growth by the already present alcohol.
- Second siphoning and first fining: A second decanting is performed to remove new lees. The wine is then clarified by adding bentonite (0.7g per 3L), a fining agent that flocculates suspended particles.
- Third siphoning and second fining: A second fining is performed to improve the wine’s clarity. Two fining agents were tested:
- Sample 1: bentonite for the first fining, egg albumin for the second (4 to 8 eggs per 225L).
Sample 2: Bentonite used for both finings.
Albumin promotes the flocculation of fine particles through protein precipitation. The two samples were compared based on organoleptic criteria: color, odor, taste, and aromatic persistence.
- Fourth siphoning: This step separates the supernatant from the final sediment, resulting in a clear wine. It marks the final stage of the product, where aromatic adjustments can be made to impart a sensory signature specific to the manufacturer.
- Flash pasteurization: The wine undergoes rapid pasteurization at 72°C for 28 seconds, ensuring its microbiological stability without altering its organoleptic qualities.
- Packaging: The wine is bottled in pre-sterilized glass containers, guaranteeing hygiene and product preservation.
- Storage and aging: The bottles are stored in a dry environment, away from light, and at room temperature. Aging allows the wine to develop its sensory characteristics and aromatic complexity.
Physicochemical Analyses : The physicochemical parameters of the must and wine were monitored at the various stages of fermentation:
- Temperature: measured using a digital thermometer (AOAC, 2019).
- Brix: determined by refractometry (AOAC, 2019).
- pH: measured with a calibrated pH meter (AOAC, 2019).
- Density: measured using a hydrometer.
- Titratable acidity: determined by titration with 0.1 N NaOH and expressed as g/L of sulfuric acid equivalent (OIV, 2021).
- Alcohol content: determined by distillation and densimetric measurement according to the official OIV method (2021).
Sensory Evaluation : A sensory analysis was conducted with a panel of 15 semi-trained judges. The characteristics evaluated included color, odor, taste, and aftertaste. A quantitative descriptive method was used to establish a sensory profile (Stone & Sidel, 2004). Samples were coded and randomly presented in ISO standard glasses.
Statistical Analysis : All physicochemical measurements were performed in triplicate. Data were analyzed using OriginPro 8 software.
RESULTS AND DISCUSSION
Fermentation Process Monitoring Parameters : Temperature Changes During Fermentation: The temperature curve observed (Figure 2) over a 10-day period shows significant fluctuations, with a marked drop around day 3, followed by a gradual rise, and then a further drop around day 10. These variations reflect biochemical and microbiological phenomena typical of the fermentation process.
Figure 2: Temperature variation curve during alcoholic fermentation
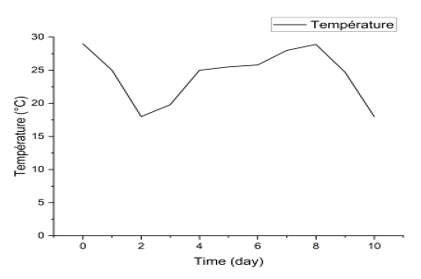
The temperature evolution observed during the fermentation of banana must shows notable variations. On day 0 (29 °C), the relatively high initial temperature corresponds to the initial ambient conditions, before the influence of yeast metabolism. A sudden drop is observed on day 2 (18 °C), which can be explained by the loss of heat due to the thermal inertia of the medium and exchanges with the environment, before the fermentation becomes truly exothermic (Fleet, 2003).
Between days 3 and 7, the temperature gradually increases, reaching 28.9°C on day 8. This increase reflects the intensity of the fermentative metabolism of Saccharomyces cerevisiae yeasts, which generate heat proportionally to the consumption of sugars (Bisson et al., 2017). This phase coincides with the peak activity of alcoholic fermentation, where fermentable sugars are converted into ethanol and CO₂ (Pretorius, 2000).
The decrease observed on days 9 and 10 (24.7°C then 18°C) corresponds to the end of primary fermentation. At this stage, substrate availability decreases, reducing the yeasts’ metabolic activity and therefore heat production (Ribéreau-Gayon et al., 2006). Furthermore, the temperature drop can be accentuated by ambient environmental conditions and the gradual cessation of exothermic reactions (Walker & Stewart, 2016).
Overall, this thermal profile is consistent with the classic fermentation kinetics of tropical wines: initial thermal equilibration phase, exothermic phase linked to active fermentation, then decrease at the end of fermentation (Amerine & Ough, 1980; Fleet, 2003). Temperature monitoring is therefore a relevant indicator for controlling the speed and efficiency of fermentation (Jackson, 2014).
Evolution of total soluble solids (°Brix) during fermentation: The curve presented in Figure 3 shows a progressive decrease in the °Brix degree, going from approximately 23 °Brix on day 0 to almost 8 °Brix on day 10. This downward trend reflects the consumption of soluble sugars by the yeasts during alcoholic fermentation.
Figure 3: Variation of total soluble solids (°Brix) during fermentation
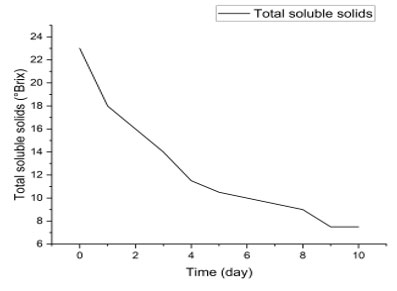
The results show a progressive decrease in total soluble solids (TSS) during fermentation, from 23°Brix on day 0 to 7.5°Brix on day 10. This decrease reflects the consumption of fermentable sugars (mainly glucose, fructose and sucrose) by yeasts, mainly Saccharomyces cerevisiae, for the production of ethanol and CO₂ (Fleet, 2003). The rapid drop in °Brix observed between day 0 (23°Brix) and day 4 (11.5°Brix) reflects an intense phase of alcoholic fermentation, corresponding to a high metabolic activity of the yeasts (Pretorius, 2000).
From day 5 onwards, the rate of decrease in °Brix becomes slower, reaching a near-stable value of 7.5 °Brix between days 9 and 10. This stabilization suggests the progressive depletion of available fermentable sugars and the end of the main fermentation, at which point yeast activity is reduced due to the reduction in substrates and the accumulation of ethanol (Bisson & Karpel, 2010).
The reduction in total soluble solids is thus a key indicator for monitoring fermentation, confirming that the transformation of sugars into ethanol follows typical winemaking kinetics (Ribéreau-Gayon et al., 2006). The final value (7.5 °Brix) indicates the persistence of some residual sugars, which may contribute to the sensory profile of banana wine by influencing its sweetness and taste balance (Jackson, 2020).
pH Variation During Fermentation: Figure 4 illustrates the pH change in banana must (Musa sp.) over a ten-day fermentation period.
Figure 4: pH evolution
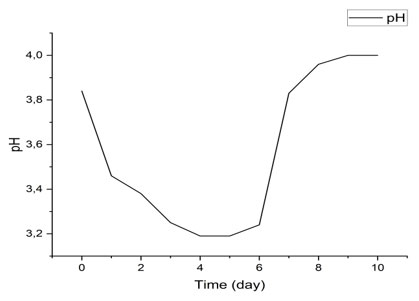
The results obtained show a progressive decrease in pH during the first days of fermentation, from 3.84 on day 0 to 3.19 on day 4, followed by a stabilization around 3.19–3.24 between days 5 and 7. An increase in pH is then observed from day 8, reaching 4 on day 10 (Figure 4).
This trend is consistent with classical observations of alcoholic and lactic acid fermentation. The initial decrease in pH is mainly attributed to the production of organic acids such as lactic acid and acetic acid by the activity of yeasts and lactic acid bacteria (Odăgeriu et al., 2005; Akin, 2008). This acidification promotes microbial growth while limiting the development of undesirable contaminants (Australian Wine Research Institute, 2023). The slight rise in pH observed at the end of fermentation could result from the partial consumption of organic acids or the formation of basic compounds (Atlas Scientific, 2023).These results highlight the importance of monitoring pH as a key indicator of fermentation progress and quality.
Variation of Titratable Acidity During Fermentation: Figure 5 illustrates the dynamics of total titratable acidity (expressed in g/L of H₂SO₄) over a ten-day process. A rapid increase in acidity is observed between day 0 and day 2, reaching a peak at approximately 1.2 g/L. This initial phase can be interpreted as a period of intense metabolic activity, often associated with microbial growth or primary fermentation, during which organic acids such as lactic or acetic acid are produced (Jay, Loessner, & Golden, 2005).
Between day 2 and day 6, acidity remains relatively stable, suggesting a metabolic plateau phase. This stability may indicate that the system reaches a balance between acid production and consumption, or that the dominant microorganisms have adapted their metabolism to the environment (Tamang et al., 2016). Finally, a slight decrease is observed after day 6, stabilizing around 1.1 g/L on day 10. This decrease may be attributed to the consumption of acids by secondary microorganisms or to chemical reactions such as precipitation or neutralization (Fleet, 2003).
Figure 5: evolution of titratable acidity
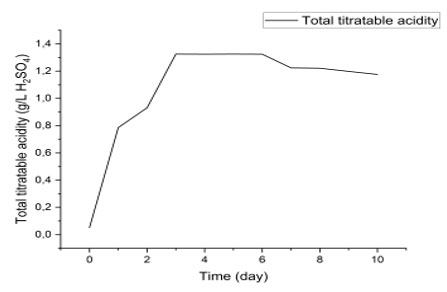
The evolution of titratable acidity is a key indicator in fermentation, food preservation, or biodegradation processes. In fermentation systems, rapid acidification is often desired to inhibit undesirable microorganisms and promote beneficial species (Caplice & Fitzgerald, 1999). The stability phase observed here is typical of controlled fermentations, where environmental conditions (pH, temperature, substrate) are optimized to maintain constant microbial activity.
The slight decrease at the end of the process may also reflect a transition to a maturation or product stabilization phase, as observed in vegetable or dairy fermentations (Marco et al., 2017). This dynamic is consistent with observations made in similar systems, where acidity reaches a plateau before stabilizing or decreasing slightly.
Variation in Wort Density During Fermentation: Figure 6 shows a gradual decrease in the specific gravity of a liquid, from approximately 1.08 on day 0 to 0.99 on day 10. This trend suggests a biochemical or physicochemical transformation of the medium, typical of fermentation or enzymatic degradation processes. Specific gravity is often used as an indirect indicator of the concentration of sugars or solutes dissolved in a liquid (Prajapati et al., 2014). A continuous decrease generally indicates the consumption of these substrates by microorganisms or enzymes, with the concomitant production of lighter metabolites such as ethanol, carbon dioxide, or organic acids (Steinkraus, 2004).
Figure 6: evolution of density
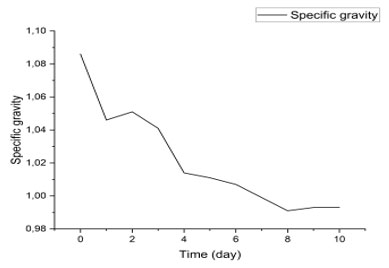
In alcoholic fermentations, for example, specific gravity decreases as sugars are converted to ethanol, which is less dense than water (Fleet, 2003). This phenomenon is also observed in lactic acid fermentation, where sugars are transformed into lactic acid and other compounds, changing the composition of the medium (Tamang et al., 2016). Stabilization around 0.99 at Specific gravity kinetics is a valuable tool for monitoring the progress of a fermentation process without resorting to complex chemical analyses. It allows for estimating the rate of substrate consumption, the duration of the active fermentation phase, and the time of product stabilization (Caplice & Fitzgerald, 1999). In artisanal or industrial systems, this measurement is often used to determine the end of fermentation or to adjust production parameters.
The decline observed in this figure is consistent with typical controlled fermentation profiles, where the density drops rapidly in the first few days, corresponding to an exponential phase of microbial growth, followed by a slowdown as the substrates are depleted (Jay et al., 2005). This type of profile is also used in monitoring the fermentation of fruits, cereals, or dairy products, where specific gravity is correlated with the quality and stability of the final product (Marco et al., 2017).the end of the period may indicate that the majority of fermentable substrates have been consumed, and that the system reaches a state of metabolic equilibrium.
Specific gravity kinetics is a valuable tool for monitoring the progress of a fermentation process without resorting to complex chemical analyses. It allows for estimating the rate of substrate consumption, the duration of the active fermentation phase, and the time of product stabilization (Caplice & Fitzgerald, 1999). In artisanal or industrial systems, this measurement is often used to determine the end of fermentation or to adjust production parameters.
The decline observed in this figure is consistent with typical controlled fermentation profiles, where the density drops rapidly in the first few days, corresponding to an exponential phase of microbial growth, followed by a slowdown as the substrates are depleted (Jay et al., 2005). This type of profile is also used in monitoring the fermentation of fruits, cereals, or dairy products, where specific gravity is correlated with the quality and stability of the final product (Marco et al., 2017).
Changes in alcohol content during fermentation: Figure 7 shows a gradual increase in alcohol content (% vol.) over a ten-day fermentation process. The alcohol content increases from 0% on day 0 to approximately 12% on day 10, with a marked upward slope, although punctuated by slight fluctuations. This trend is typical of alcoholic fermentation, where the sugars present in the substrate (often fruits or grains) are metabolized by yeasts, mainly Saccharomyces cerevisiae, to produce ethanol and carbon dioxide (Fleet, 2003).
Figure 7
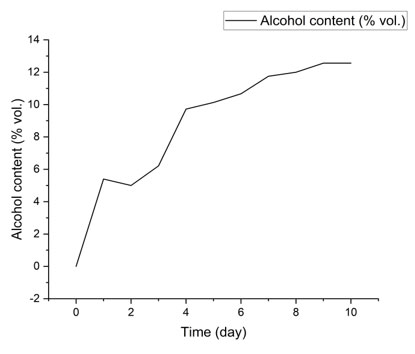
The initial phase (days 0 to 3) generally corresponds to the yeasts’ adaptation to the environment, followed by an exponential phase of alcohol production (days 3 to 8), where the ethanol concentration increases rapidly. The stabilization observed around days 9 and 10 suggests that fermentable sugars have been largely consumed or that ethanol accumulation is beginning to inhibit microbial activity (Pretorius, 2000).
The evolution of alcohol content is a key indicator of fermentation performance and final product quality in the food industry, particularly in the production of wine, beer, and traditional fermented beverages. Efficient ethanol production depends on several factors: the yeast strain used, temperature, pH, initial sugar concentration, and the presence of nutrients (Bisson, 1999).
The observed curve is consistent with classical alcoholic fermentation kinetics, where ethanol production follows sigmoidal dynamics. Minor fluctuations may be due to variations in substrate availability or microbial interactions (Ciani & Comitini, 2015). A final concentration of approximately 12% vol. is typical of controlled fermentations, indicating good fermentation efficiency and near-complete sugar conversion (Zoecklein et al., 1995).
Comparative analysis of banana wine according to WHO standards
Table 1. Analysis results compared to WHO standards
| Settings | Banana wine | WHO standards | Interpretation |
| Temperature (°C) | 18 | 20 – 28 | Slightly below optimal range; may slow fermentation. |
| Sugar content (°B) | 7,5 | 6 – 10 | Compliant; adequate concentration for balanced alcoholic fermentation.. |
| pH | 4 | 3 – 4 | At the upper limit; favorable to microbiological stability . |
| Titratable acidity
(g/L of H2SO4) |
1,76 | / | High value, suggesting good protection against microbial spoilage. |
| Density | 0,994 | 0,994 – 0,993 | Conforms; indicates a well-completed fermentation |
| Alcohol content (°) | 12 | 8 – 15 | Conforms; concentration typical of a light to moderate wine. |
The fermentation temperature at 18°C, although slightly below the WHO recommendations (20–28°C), remains compatible with slow fermentation, often associated with better preservation of volatile aromas (Fleet, 2003). A lower temperature can, however, extend the fermentation time and influence microbial kinetics (Bisson, 1999).
The initial sugar content of 7.5°Brix is within the optimal range for efficient alcoholic fermentation, allowing ethanol production without excess sugar residue (Zoecklein et al., 1995). The pH of 4 is at the upper limit of standards, promoting product stability while limiting the growth of pathogenic microorganisms (Jay et al., 2005).
The high titratable acidity (1.76 g/L H₂SO₄), although not specified in WHO standards, is generally desirable in fermented beverages to ensure good shelf life and balanced sensory perception (Caplice & Fitzgerald, 1999). The final specific gravity of 0.994 confirms that the majority of sugars have been converted to alcohol, which is consistent with an alcohol content of 12% vol., fully compliant with international standards for fruit wines (Steinkraus, 2004).
Comparative Sensory Analysis of Banana Wine: The figure presents a comparative sensory profile between two banana wine samples, E1 (blue line) and E2 (orange line), evaluated according to seven organoleptic descriptors: pale yellow, dark yellow, fruity odor, vinegar odor, sweet taste, tangy taste, and length in the mouth. Each attribute is rated on a scale of 0 to 6, reflecting the intensity perceived by a panel of tasters.
Figure 8: sensory profile
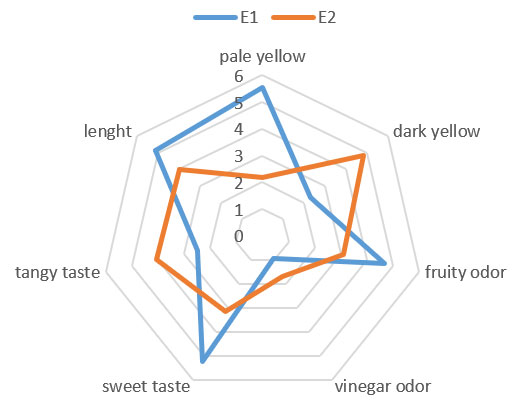
- Color (Pale Yellow vs. Dark Yellow) E1 has a more pronounced intensity for pale yellow, while E2 is more associated with dark yellow. This difference may be related to fermentation duration or oxidation of phenolic compounds (Jackson, 2008). A darker hue is often correlated with advanced ripening or prolonged exposure to oxygen (Ribéreau-Gayon et al., 2006).
- Fruity Odor E2 receives a significantly higher score, suggesting a better expression of volatile esters from fermentation (Swiegers et al., 2005). These compounds are essential for the sensory acceptability of fruit wines.
- Vinegar odor: E1 exhibits a stronger intensity for this note, which may indicate slight acetic acid contamination or undesirable secondary fermentation (Drysdale & Fleet, 1988). A vinegar odor is generally perceived negatively and can compromise product quality.
- Sweet and sour: E2 is distinguished by a higher perception of sweetness, while E1 is more sour. This contrast can be attributed to differences in residual sugar and organic acid content (Zoecklein et al., 1995). A good balance between sweetness and acidity is crucial for taste harmony.
- Length: E2 surpasses E1 in terms of length, reflecting a longer aromatic persistence after tasting. This parameter is often associated with the complexity and perceived quality of the wine (Noble et al., 1987).
- Length in the mouth: E2 outperforms E1 in terms of length, reflecting a longer aromatic persistence after tasting. This parameter is often associated with the complexity and perceived quality of the wine (Noble et al., 1987).
Overall, E2 presents a more favorable sensory profile, with higher scores for fruity odor, sweetness, and length, which are positive indicators of organoleptic quality. In contrast, the intensity of the vinegar odor in E1 could signal microbiological alteration or poor control of fermentation conditions (Fleet, 2003). These observations highlight the importance of controlling physicochemical parameters to ensure the sensory quality of banana wines.
CONCLUSION
This study demonstrates that the valorization of Musa sp. through alcoholic fermentation constitutes a viable technological approach for the production of quality banana wine. The physicochemical results obtained, including an alcohol content of 12%, a density of 0.994, and a pH of 4, comply with international standards (WHO), attesting to the control of the fermentation process. Furthermore, sensory analysis reveals a favorable organoleptic profile, particularly for sample E2, characterized by better aromatic expression and a pleasing finish.This valorization offers a concrete solution to reduce post-harvest banana losses in rural areas of Congo, while creating a promising agro-industrial outlet. It also paves the way for the diversification of banana products, with significant economic and nutritional potential. Additional studies on the product’s stability, shelf life, and consumer acceptability would optimize its integration into local processing sectors.
Conflict of interest: The authors declare no conflict of interest
Data availability: All data are available with the corresponding author on a reasonable request
Funding : Nil
REFERENCES
Affognon, H., Mutungi, C., Sanginga, P., & Borgemeister, C. (2023). Postharvest losses of tropical fruits and strategies for reduction in sub-Saharan Africa. Food Security, 15(2), 421–435. https://doi.org/10.1007/s12571-022-01383-4
Akin, H. (2008). Évolution du pH pendant la fermentation alcoolique de mouts de raisins : modélisation et interprétation métabolique. Institut National Polytechnique de Toulouse.
Amerine, M. A., & Ough, C. S. (1980). Methods for Analysis of Musts and Wines. John Wiley & Sons.
AOAC. (2019). Official Methods of Analysis (21st ed.). AOAC International.
Australian Wine Research Institute. (2023). Acidity and pH. https://www.awri.com.au/industry_support/winemaking_resources/frequently_asked_questions/acidity_and_ph/
Atlas Scientific. (2023). How does pH affect fermentation? https://atlas-scientific.com/blog/how-does-ph-affect-fermentation/
Bisson, L. F. (1999). Stuck and sluggish fermentations. American Journal of Enology and Viticulture, 50(1), 107–119.
Bisson, L. F., Karpel, J. E., Ramakrishnan, V., & Joseph, C. M. L. (2017). Functional genomics of wine yeast: Impact on fermentation performance and wine quality. Annual Review of Food Science and Technology, 8, 75–100. https://doi.org/10.1146/annurev-food-030216-030210
Bisson, L. F., & Karpel, J. E. (2010). Chemical and microbiological aspects of winemaking. Springer.
Bukar, A., Njobdi, H. Y., & Gidado, A. (2020). Production and quality evaluation of banana wine using Saccharomyces cerevisiae. African Journal of Biotechnology, 19(7), 455–462. https://doi.org/10.5897/AJB2020.17120
Caplice, E., & Fitzgerald, G. F. (1999). Food fermentations: role of microorganisms in food production and preservation. International Journal of Food Microbiology, 50(1-2), 131–149. https://doi.org/10.1016/S0168-1605(99)00082-3
Ciani, M., & Comitini, F. (2015). Yeast interactions in multi-starter wine fermentation. Current Opinion in Food Science, 1, 1–6. https://doi.org/10.1016/j.cofs.2014.09.001
Drysdale, G. S., & Fleet, G. H. (1988). Acetic acid bacteria in winemaking: a review. American Journal of Enology and Viticulture, 39(2), 143–154.
Fleet, G. H. (2003). Yeast interactions and wine flavour. International Journal of Food Microbiology, 86(1-2), 11–22. https://doi.org/10.1016/S0168-1605(03)00245-9
Hossain, M. A., Rahman, M. M., & Zaman, S. (2022). Valorization of banana by-products: Nutritional composition and functional properties. Food Reviews International, 38(7), 1290–1311. https://doi.org/10.1080/87559129.2021.1928021
Jackson, R. S. (2014). Wine science: Principles and applications (4th ed.). Academic Press.
Jackson, R. S. (2020). Wine science: Principles and applications (5th ed.). Academic Press.
Jay, J. M., Loessner, M. J., & Golden, D. A. (2005). Modern Food Microbiology (7th ed.). Springer.
Kikulwe, E. M., Okurut, S., Ajambo, S., & Smale, M. (2021). Reducing banana postharvest losses: Evidence from Uganda. Journal of Agriculture and Food Research, 6, 100212. https://doi.org/10.1016/j.jafr.2021.100212
Marco, M. L., Heeney, D., Binda, S., Cifelli, C. J., Cotter, P. D., Foligné, B., … & Hutkins, R. (2017). Health benefits of fermented foods: microbiota and beyond. Current Opinion in Biotechnology, 44, 94–102. https://doi.org/10.1016/j.copbio.2016.11.010
Memon, N., Soomro, A. H., & Ansari, S. H. (2023). Potential of banana waste for functional foods and beverages. Journal of Food Processing and Preservation, 47(2), e17023. https://doi.org/10.1111/jfpp.17023
Noble, A. C., Arnold, R. A., & Masuda, B. M. (1987). Comparison of intensity profiles and time–intensity characteristics of sweet and sour tastes. Journal of Food Science, 52(6), 1533–1535.
Odăgeriu, G., Cotea, V., & Stoica, G. (2005). pH variation during the alcoholic fermentation. Cercetări Agronomice în Moldova, 123-124(1-4), 107–115.
OIV. (2021). Compendium of International Methods of Wine and Must Analysis. International Organisation of Vine and Wine, Paris.
Padilla, B., Gil, J. V., & Manzanares, P. (2022). Validation of a standard protocol to assess fermentative properties of Saccharomyces cerevisiae wine strains. Frontiers in Microbiology, 13, 935678. https://doi.org/10.3389/fmicb.2022.935678
Prajapati, J. B., Nair, B. M., & Shah, N. P. (2014). Fermented Functional Foods. CRC Press.
Pretorius, I. S. (2000). Tailoring wine yeast for the new millennium: novel approaches to the ancient art of winemaking. Yeast, 16(8), 675–729. https://doi.org/10.1002/1097-0061(20000615)16:8<675::AID-YEA585>3.0.CO;2-B
Ribéreau-Gayon, P., Dubourdieu, D., Donèche, B., & Lonvaud, A. (2006). Handbook of Enology: The microbiology of wine and vinifications (Vol. 1, 2nd ed.). John Wiley & Sons.
Ssemugabo, C., Tumwine, G., & Turyagyenda, F. (2021). Optimization of banana wine production using local banana varieties in Uganda. Journal of Food Science and Technology, 58(11), 4083–4092. https://doi.org/10.1007/s13197-021-04934-2
Steinkraus, K. H. (2004). Industrialization of Indigenous Fermented Foods. CRC Press.
Stone, H., & Sidel, J. L. (2004). Sensory Evaluation Practices (3rd ed.). Elsevier Academic Press.
Swiegers, J. H., Bartowsky, E. J., Henschke, P. A., & Pretorius, I. S. (2005). Yeast and bacterial modulation of wine aroma and flavour. Australian Journal of Grape and Wine Research, 11(2), 139–173. https://doi.org/10.1111/j.1755-0238.2005.tb00285.x
Tamang, J. P., Watanabe, K., & Holzapfel, W. H. (2016). Review: Diversity of microorganisms in global fermented foods and beverages. Frontiers in Microbiology, 7, 377. https://doi.org/10.3389/fmicb.2016.00377
Walker, G. M., & Stewart, G. G. (2016). Saccharomyces cerevisiae in the production of fermented beverages. Beverages, 2(4), 30. https://doi.org/10.3390/beverages2040030
Zoecklein, B. W., Fugelsang, K. C., Gump, B. H., & Nury, F. S. (1995). Wine Analysis and Production. Springer Science & Business Media.

