Vibhuti Mishra*![]() , Sapneh Sharma
, Sapneh Sharma![]() and Nalini Srivastava
and Nalini Srivastava
School of Studies in Biochemistry, Jiwaji University, Gwalior 474 011, India
Corresponding author email: biochemistryresearch2014@gmail.com
Article Publishing History
Received: 01/12/2020
Accepted After Revision: 21/03/2021
Organophosphate pesticides are widely used in agriculture and household for pest control and consequently have been a major cause of toxicity in farmers and others especially in India. The present study was carried out to evaluate the ability of two pesticides: monocrotophos (MCP) and quinalphos (QNP) to generate oxidative stress and to explore the possible protective effects of melatonin in combating the caused stress. The purpose of the study was to find a suitable agent which could reduce the toxic symptoms generated due to acute as well as chronic exposure of monocrotophos and quinalphos. We studied the potential of MCP and QNP to generate oxidative stress and subsequent oxidative damage to DNA in the rat tissues and lymphocytes.
Oxidative stress was measured by quantitating the levels of reactive oxygen species (ROS), total antioxidant capacity, accumulation of lipid peroxidation end products while DNA oxidation was measured by the modified comet assay using the bacterial repair enzymes, formamidopyrimidine glycosylase (Fpg) and endonuclease III (Endo III) in the liver, brain and lymphocytes of rats given for two days and subchronic exposure of MCP and QNP, both separately and in combination. The results showed that both acute and subchronic pesticide exposure, separately and in combination, lead to the generation of oxidative stress. Extensive oxidative damage of both purine and pyrimidine bases was observed in liver, brain and lymphocytes of rats given exposure with MCP or QNP, separately or in combination. MCP was found to be more toxic than QNP as highest DNA damage was observed in this group of rats. The combined exposure of MCP and QNP does not potentiate each other’s action. However, co-treatment of melatonin, a well established antioxidant, decreased the oxidative stress and damage caused to the DNA.
Organophosphate pesticides, Oxidative stress, DNA damage, Melatonin
Mishra V, Sharma S, Srivastava N. The Protective effects of Melatonin on the Monocrotophos and Quinalphos Induced Oxidative DNA Damage in Rats. Biosc.Biotech.Res.Comm. 2021;14(1).
Mishra V, Sharma S, Srivastava N. The Protective effects of Melatonin on the Monocrotophos and Quinalphos Induced Oxidative DNA Damage in Rats. Biosc.Biotech.Res.Comm. 2021;14(1). Available from: <a href=”https://bit.ly/3d24XFP”>https://bit.ly/3d24XFP</a>
Copyright © This is an Open Access Article distributed under the Terms of the Creative Commons Attribution License (CC-BY). https://creativecommons.org/licenses/by/4.0/, which permits unrestricted use distribution and reproduction in any medium, provided the original author and sources are credited.
INTRODUCTION
Pesticides are the chemicals that are extensively applied in agriculture to fulfill the increasing food demands of steadily rising population and for the eradication of numerous vector borne diseases. The ubiquitous dispersion of these substances contaminated the food as well as surface, ground and drinking water. In almost all parts of the world, low level poisoning of human beings poses a risk of chronic illness and adverse health effects. (Sabarwal et al., 2018). Organophosphates (OP) compounds are some of the most common, and most toxic insecticides used today, adversely affecting the human nervous system even at low levels of exposure by irreversibly inhibiting the enzyme acetylcholinesterase (AChE). Besides being potent anticholinesterase compounds, many studies suggest that both acute and chronic exposure of OP pesticides cause disturbances in cells and tissues of test animals and in human beings also (Costa, 2018; Laksmidevi et al., 2020).
All the important biomolecules like proteins, lipids and nucleic acids are susceptible to oxidative DNA damage. Both, in acute or chronic OP exposure, induction of oxidative stress has been reported as the main mechanism of their toxicity (Farkondeh et al., 2020). DNA oxidation is known to be one of the most common kinds of damage. OP pesticides induced DNA damage has been reported by many workers. OP compounds have been shown to be genotoxic in vitro and cause extensive damage to DNA (Greeshma et al., 2019; Ali, 2020). The primary oxidant responsible for DNA damage is OH●, as it reacts directly with DNA molecule (Cadet and Davies, 2017).
A variety of oxidized bases have been identified in nuclear DNA but 8-oxo-7,8-dihydroguanine (8-oxoGua) is one of the most abundant and readily formed modified base which if not repaired prior to replication cause mis-incorporation of adenine leading to transversion mutation. It has been suggested that this kind of lesion plays important role in the initiation, promotion and progression of tumors (Poetsch, 2020). The modified comet assay has been applied to wide range to cell types and nowadays, is a well established and widely used genotoxicity test for estimation of DNA damage at the individual cell level in both in vivo and in vitro studies (Collins et al., 2020).
Melatonin, a hormone produced by pineal glands, is a ubiquitous molecule which is known to possess antioxidant properties and shown ability to detoxify H2O2, OH●, peroxynitrite anion, singlet oxygen, O2.- and peroxyl radicals. (Hacışevki and Baba, 2018).Monocrotophos [dimethyl-(E)-1-methyl-2-(methyl carbamoyl) vinyl phosphate, MCP], is an extremely toxic, systemic aliphatic OP insecticide, which is applied to kill various insects like spiders, mites which attack on cotton, sugarcane, peanuts, ornamentals and tobacco while quinalphos [O,O-diethyl-O-(2- quinoxalinyl)- phosphorothioate, QNP], another extensively used insecticide, is toxic to the unintended targets including humans and animals (Eid, 2017; Kaur and Goyal, 2019).
Since MCP and QNP are widely used OP pesticides, their overlapping application may lead to combined exposure that may potentiate the action of each other. The genotoxicity of MCP and QNP has been confirmed in our previous studies which showed highly significant extensive single and double strand breaks in DNA in tissues of rats given acute and subchronic exposure of MCP and QNP (Mishra et al., 2015). Therefore, it was considered worthwhile to evaluate the involvement of oxidative stress in damage of nitrogenous bases of DNA in tissues of rats given 2 day and 60 days oral exposure of MCP and QNP, separately and in combination.
The mechanism of this DNA damage was studied by modified comet assay using bacterial repair enzymes Fpg/ Endo III, to find out whether DNA damage is caused by oxidative stress. The levels of H2O2 and O2•– radical along with total antioxidant capacity was also estimated in pesticide exposed rats to find out any correlation with base oxidation. Since lipid peroxidation is a sensitive biomarker of oxidative stress, the accumulation of lipid peroxidation products, malondialdehyde (MDA) and 4-hydroxynonanal (4HNE) was monitored to have an idea about the extent of oxidative stress. The antioxidant effect of melatonin, if any, is also evaluated against MCP and QNP induced increase in generation of ROS and oxidative DNA damage in the present study.
MATERIAL AND METHODS
Adult male albino rats of Wistar strain (Rattus norvegicus) weighing about 120±10 g were used in the present study. Rats were obtained from the animal facilities of Defence Research and Development Establishment, Gwalior, India, and were maintained in a light (light-dark cycle of 12 h each) and temperature (25° ± 2°C) controlled animal room of our department on standard pellet diet (obtained from Amrut Rat & Mice Feed, New Delhi, India) and tap water ad libitum. Rats were acclimatized for one week prior to the start of the
Table 1 : Division of experimental animals and pesticide treatment
| Acute | Chronic | ||||
| I (2 days pesticide exposure) | II (Total pesticide exposure = LD50 in 60 days)
|
III (Total pesticide exposure = 2LD50 in 60 days) | |||
| Group i
|
Group ii | Group iii | Group iy | Group v | Group vi |
| Con | Con + MT | Con | Con + MT | Con | Con + MT |
| MCP
4.5mg/Kg b.w. x 2 days |
MCP + MT
4.5 mg/Kg b.w. x 2 days |
MCP
0.3 mg/Kg b.w. x 60 days |
MCP+MT
0.3 mg/Kg b.w.x 60 days |
MCP
0.6 mg/Kg b.w. x 60 days |
MCP + MT
0.6 mg/Kg b.w. x 60 days |
| QNP
5 mg/Kg b.w. x 2 days |
QNP + MT
5 mg/Kg b.w. x 2 days |
QNP
0.33mg/Kg b.w. x 60 days |
QNP + MT
0.33 mg/Kg b.w. x 60 days |
QNP
0.66 mg/Kg b.w. x 60 days |
QNP + MT
0.66 mg/Kg b.w. x 60 days |
| Mix
2.25mg MCP + 2.5mg QNP/Kg b.w. x 2 days
|
Mix + MT
2.25 mg MCP + 2.5mg QNP/Kg b.w. x 2 days |
Mix
0.15 mg MCP + 0.17mg QNP/Kg b.w. x 60 days |
Mix + MT
0.15 mg MCP + 0.17 mg QNP/Kg b.w. x 60 days |
Mix
0.3 mg MCP + 0.34mg QNP/Kg b.w. x 60 days |
Mix + MT
0.3 mg MCP + 0.34 mg QNP/Kg b.w. x 60 days |
Experiment. The animals were handled, ethically treated, and humanly killed as per the rules and instructions of the Ethical Committee on Animal Care of Jiwaji University, Gwalior, in accordance with the Indian National Law on animal care and use.Rats were randomly divided into three groups and were given 2 days of acute pesticide exposure and 60 days of subchronic pesticide exposure. The further division of groups and treatment is as described in Table 1. The animals were randomly divided into two groups, which were further divided into subgroups of six animals each. The rats of first group consisted of twenty four animals which were further divided into four subgroups of six animals each and were given pesticides for two consecutive days.
The second group consisted of thirty animals divided into five subgroups of six animals each, received co treatment of pesticide and melatonin for two consecutive days. The rats of first sub group received MCP [4.5 mg/Kg body weight dissolved in 0.4 ml corn oil per day equivalent to 0.25 LD50 as the reported LD50 is 18 mg/Kg body weight (Gaines, 1969), orally for two consecutive days, the second sub group received QNP (5 mg/Kg body weight dissolved in 0.4 ml corn oil per day equivalent to 0.25 LD50 as the reported LD50 is 20 mg/Kg body weight, (Raizada et al., 1993) orally for two consecutive days), the third sub group received a mixture of both the pesticides (0.125 LD50 each, total 0.25 LD50 equivalent/Kg body weight, orally, for two consecutive days), while rats of the fourth sub group received 0.4 ml corn oil orally for two days and served as the control.
The rats of the second group were divided into five sub groups, the first, second, third and fourth sub groups received a co treatment of melatonin (5 mg/Kg body weight intraperitoneally per day for two consecutive days(Suke et al., 2006) and MCP, QNP, their mixture or corn oil orally as in the first group. The fifth subgroup received just corn oil orally and served as control. The blood was collected 24 h after the last treatment via ocular bleeding and used for lymphocyte (Phatak, 1978) and serum separation (Tuck et al., 2009) The cell viability was checked by trypan blue dye exclusion test (Philips 1973) The lymphocytes samples with viability >95% were used for comet assay. After the blood collection, the rats were humanly killed by cervical dislocation; liver (Martin and Neuhaus, 2007) and brain (http:// biology.mit.edu/sites/default/files/Rat Brain Dissection.pdf) tissues were excised off, washed with 0.9% NaCl and used for different estimations.
Superoxide anion: release was measured by superoxide dismutase inhibitable reduction of ferricytochrome c (Cohen et al., 1980). Lymphocytes (3X10⁵ ) were incubated in PBS-EDTA buffer (pH7.4) with phorbol-12,13-dibutyrate (PDBu) at 37o C for 15 min and ferricytochrome c and PDBu were added in that the final concentration should be 50 nmol/L and 100 nmol/L, respectively, in total volume of 1.0 ml. The change in absorbance was measured spectrophotometrically at 550 nm for 10 min with a double beam Shimadzu UV-160A spectrophotometer. The amount of superoxide – anion secreted into the medium was calculated using the molar extinction coefficient of reduced cyochrome c, 2.1X 10⁴ M-1 cm-1, and the concentration is expressed as nmole O2˙-/ 106 cells/min (Pick and Keisari, 1981).
Hydrogen peroxide: in lymphocytes was measured by the method of Pick (Pick, 1986). For assay of H2O2, 100 µl of pesticide treated lymphocytes, 100 µl of assay solution (containing 0.2 ml phenol red, 0.2 g/l and 0.2 ml of horseradish peroxidase, 20 U/ml in potassium phosphate buffer, 0.05 M, pH 7.0 and 9.6 ml of 0.9% NaCl), was taken in microwell plate and reaction was started by the addition of 10 µl of 1.0 N NaOH, and absorbance was recorded at 600 nm. Results are expressed as µmol H2O2 formed/ml preparation.
MDA and 4HNE: were estimated by the method of Jacobson (Jacobson et al., 1999). Briefly 200 µl aliquot of tissue homogenate (10% w/v in Tris-HCl buffer, 20mM, pH 7.4) was transferred to 650 µl of 10.3 mM 1-methyl-2-phenylindole in acetonitrile and vortex mixed. To assay MDA + 4HNE, 150 µl of 15.4 M methanesulfonic acid was added, vortexed and incubated at 45oC for 40 min. To assay MDA alone, 150 µl of 37% HCl was added instead of methanesulfonic acid, vortexed, incubated at 45oC for 60 min. After incubation, samples were kept on ice, centrifuged at 9500 g for 5 min and absorbance was measured at 586 nm. The levels of MDA and 4HNE are expressed as nmol g-1 tissue using extinction coefficient 1.1 X 10⁵ M-1 cm-1.
Total antioxidant capacity: in serum was measured by the method described by Rice-Evans and Miller, 1994 (Rice-Evans and Miller,1994). The reaction mixture containing 8.4 µl of serum sample, 489 µl of buffer (0.1 M PBS, pH 7.4), 36 µl of 70 µM metmyoglobin, and 300 µl of 5 mM ABTS [2, 2’-azinobis-(3-ethylbanzothizoline-6-sulfonic acid) disodium salt] were taken and the reaction was started by addition of 167 µl of 450 µM H2O2 and the absorbance change was recorded at 734 nm for 5 min. The total antioxidant capacity was calculated using trolox (2.5 mM) as standard and values were expressed as mmol trolox equivalent L-1.
Modified bases: were estimated by Fpg- Endo enzyme treatment in combination with the comet assay based on Collin’s protocols (Collins et al., 1993). A homogenate (25% w/v) of fresh tissues was prepared in chilled homogenizing buffer (0.075 M NaCl containing 0.024 M EDTA, pH 7.2) in a Potter Elvehjem homogenizer with a single stroke. The nuclei were obtained by centrifugation at 700 g for 10 min at 4ºC and the pellet was gently resuspended in 3.0 ml of chilled homogenizing buffer. 75 μl of normal melting agarose (1% prepared in 0.1 M sodium phosphate buffer, pH 7.2, containing 0.9% NaCl) was quickly layered on end-frosted slide.
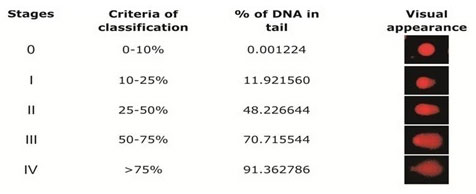
covered gently with another slide, and allowed to solidify. The slides were observed at 10X magnification with a Leica Optiphase microscope equipped with an excitation filter of 515-560 nm and barrier filter of 590 nm. A total of 100 cells were scored per tissue per animal (50 from each replicate slide). The nuclei were divided into five different categories on the basis of percentage of DNA in the tail using TriTek CometScoreTM Freeware v1.5 software. The nuclei having 0-10% of tail DNA were categorized under 0 stage, 10-25% tail DNA under stage I, 25-50% tail DNA under stage II, 50-75% tail DNA under stage III and the nuclei having tail DNA >75% were categorized under stage IV (Fig. 1). The results are expressed as DNA damage index, calculated as #0 + #1 + #2 + #3 + #4/ # of cell scored where # is the total number of nuclei counted (Figure 1).
Figure 1: Stages of DNA damage: The nuclei were divided into four stages on the basis of percentage of DNA in tail. The nuclei having 0-10% of DNA were categorised under 0 stage, the nuclei having tail DNA from 10-25% were categorised under stage I, 25-50% tail DNA conatining nuclei were categorised under stage II, 50-75% tail DNA containing nuclei were categorised under stage III, the nuclei having tail DNA >75% were categorised under stage IV.
Results are expressed as mean ± S.E. of six sets of observations taken on different days. Statistical analyses were performed using Sigma Stat Statistical software version 2.0. All the statistical analyses were performed using one-way analysis of variance with post hoc Bonferroni’s multiple comparison test applied across the treatment groups. Significance was based on P value < 0.05.
RESULTS AND DISCUSSION
Levels of malondialdehyde and 4-hydroxynonanal (MDA and 4HNE), the two major end products of peroxidative damage of lipids, were monitored in the rat tissues following MCP and QNP exposure either singly or in combination in rat tissues. The results showed that both 2 days and subchronic exposure of MCP and QNP showed significantly high accumulation of MDA and 4HNE in the liver and brain of rats. Two days of MCP and QNP exposure caused 258% and 220% increase in the liver MDA and 225% and 192% increase in the brain MDA of rats, respectively, while the 4HNE levels were increased by 310% and 317% in the liver and 161% and 151% increase in the brain of exposed rats, (Table 2). When the rats were given combined exposure of MCP and QNP (0.125 LD50 equivalent of each pesticide per day for two consecutive days), the hepatic MDA and 4HNE levels
were increased by 187% and 249%, while 132% and 128% increase was observed in the MDA and 4HNE levels, respectively in the brain, when compared with respective control. The co treatment of melatonin along with pesticide showed protective effects and the accumulation of MDA and 4HNE was markedly decreased in both the tissues when compared with corresponding tissues of only pesticide treated rats. The decrease in the hepatic MDA levels were 93%, 42% and 80% while 108%, 48% and 66% decrease was observed in brain of rats given co-treatment of melatonin with MCP, QNP and Mix respectively, when compared with only MCP, QNP and Mix treated rats. The decrease in the HNE levels in the liver and the brain ranged from 1% to 95% on melatonin co-treatment when compared with pesticide treated melatonin untreated tissues of rats (Table 2).
Subchronic exposure of MCP, QNP and their mixture also caused significantly marked accumulation of MDA and 4HNE in the liver and the brain of rats when compared with the control. The increase in MDA levels ranged from 23- 42% in the liver and 5- 28% in the brain while the increase observed in the 4HNE levels ranged from 383- 535% in the liver and 200- 404% in the brain of rat given 4.5 mg/Kg body weight of MCP, 5 mg/Kg body weigt of QNP and their mixture (2.25 mg/Kg body weight of MCP + 2.5 mg/Kg body weight of QNP orally for 60 days (Total MCP and QNP given was LD50 equivalent in 60 days) (Table 3). When the dose of pesticides was doubled i.e. total 2 LD50 equivalents of MCP, QNP and their mixture was given in 60 equal doses.
the accumulation of MDA and 4HNE was further increased in the liver and the brain of rats when compared with respective tissues of control rats. Melatonin co treatment showed protection against pesticide induced peroxidative damage of lipids and levels of peroxidation products, MDA and 4-HNE, were accumulated in the liver and the brain of rats when compared with melatonin untreated group. Melatonin co treatment caused 0- 15% decrease in the MDA levels in the liver and 1- 15% in the brain of rats receiving LD50 equivalents of pesticides; 3-17% in the liver and 7-12% in the brain of rats receiving 2 LD50 equivalents of pesticides either singly or in mixture in equal doses for 60 days. Melatonin co treated rats showed 93- 289% decrease in the 4HNE levels in the liver and 39- 189% decrease in the brain of rats and 0- 85% decrease in the liver and 30-54% decrease in the brain of rats receiving 2 LD50 equivalent of pesticides in equal doses in 60.
Table 2. Effect of oral exposure of MCP (4.5 mg/Kg b.w.) and QNP (5 mg/Kg b.w.) single and in mixture on the levels of MDA and 4HNE in the liver and the brain of rats and evaluation of protective effects of intraperitoneal dose of melatonin (5mg/Kg b.w.)
| Con | Con +MT | MCP | MCP +MT | QNP | QNP + MT | Mix | Mix + MT | |
| MDA | ||||||||
| Liver | 20.0 ± 0.9 | 18.8 ± 0.6* | 71.5 ± 2.1*** | 53.0 ± 1.5*** | 64..0 ± 0.9*** | 55.5 ± 1.3*** | 57.3 ± 0.9*** | 41.3 ± 0.9*** |
| Brain | 19.3 ± 1.1 | 18.0 ± 0.4* | 62.8 ± 1.8*** | 41.8 ± 1.3*** | 56.3 ± 0.9*** | 47.0 ± 1.2*** | 44.8 ± 3.4*** | 32.0 ± 2.2*** |
| 4HNE | ||||||||
| Liver | 15.0 ± 1.3 | 13.0 ± 1.3* | 61.5 ± 4.3*** | 53.0 ± 1.1*** | 62.5 ± 2.8*** | 48.3 ± 1.7*** | 52.3 ± 1.3*** | 45.3 ± 1.3*** |
| Brain | 23.0 ± 0.9 | 21.0 ± 0.9* | 60.0 ± 1.1*** | 48.8 ± 0.6*** | 57.8 ± 1.6*** | 57.5 ± 1.8*** | 52.5 ± 1.0*** | 46.8 ± 0.9*** |
days, respectively, when compared with only pesticide treated group (Table 4)
Values of MDA and 4HNE are expressed as nmoles g-1 tissue.Results are expressed as mean ± SE of six set of observations take on different days.Rats were given 0.25 LD50 equivalent of MCP or QNP or mixture of MCP + QNP (0.125 LD50 equivalent of each) dissolved in 0.4 ml corn oil, orally for two consecutive days. Another group of rats was given co-treatment of melatonin (5 mg/Kg body weight intraperitoneally).*P < 0.05, **P < 0.01, ***P < 0.001and ≠P > 0.05 when compared with respective control.Abbreviations: Con, Control; MT, Melatonin, MCP, Monocrotophos; QNP, Quinalphos; Mix, Mixture; MDA, malondialdehyde; 4HNE, 4-hydroxynonenal.
Table 3. Effect of 60 days of oral exposure of LD50 equivalents of MCP (18 mg/Kg b.w.) and QNP (20 mg/Kg b.w.) single and in mixture on the levels of MDA and 4HNE in the liver and brain of rats and evaluation of protective effects of intraperitoneal dose of melatonin (5 mg/Kg b.w.)
| Con | Con + MT | MCP | MCP + MT | QNP | QNP + MT | Mix | Mix + MT | |
| MDA | ||||||||
| Liver | 24.1 ± 1.1 | 22.8 ± 0.6* | 34.2 ± 1.8** | 31.0 ± 1.1** | 30.9 ± 0.8** | 31.2 ± 1.1** | 29.7 ± 1.4* | 28.4 ± 0.6*** |
| Brain | 22.4 ± 1.6 | 20.2 ± 0.2* | 27.6 ± 0.5* | 26.2 ± 0.4* | 28.7 ± 0.7* | 25.3 ± 0.3* | 23.5 ± 0.5≠ | 23.3 ± 0.3≠ |
| 4HNE | ||||||||
| Liver | 20.8 ± 5.2 | 18.0 ± 3.2≠ | 100.4 ± 20.8* | 82.8 ± 15.2*** | 118.8 ± 0.4** | 66.8 ± 10.0** | 132.0 ±10.0** | 72.0 ± 8.0** |
| Brain | 21.2 ± 6.8 | 34.4 ± 2.4* | 63.2 ± 4.4*** | 25.2 ± 3.6≠ | 70.4 ± 6.8** | 31.2 ± 13.6* | 106.8 ± 6.8*** | 24.12 ± 4.4≠ |
Values of MDA and 4HNE are expressed as nmoles g-1 tissue. Results are expressed as mean ± SE of six set of observations take on different days. Rats were given 1/60 LD50 equivalent of MCP or QNP or mixture of MCP + QNP (1/120 LD50 equivalent of each) dissolved in 0.4 ml corn oil, orally for sixty consecutive days (total pesticide received by each animal was LD50 equivalents in 60 days). Another group of rats was given co-treatment of melatonin (5 mg/Kg body weight intraperitoneally per day for sixty consecutive days) along with 1/60 LD50 equivalent of MCP, QNP or their mixture.*P < 0.05, **P < 0.01,***P < 0.001and ≠P > 0.05 when compared with respective control.Abbreviations: Con, Control; MT, Melatonin, MCP, Monocrotophos; QNP, Quinalphos; Mix, Mixture MDA, malondialdehyde; 4HNE, 4-hydroxynonenal.
Table 4. Effect of 60 days of oral exposure of LD50 equivalents of MCP (36 mg/Kg b.w.) and QNP (40 mg/Kg b.w.) single and in mixture on the levels of MDA and 4HNE in the liver and brain of rats and evaluation of protective effects of intraperitoneal dose of melatonin (5 mg/Kg b.w.)
| Con | Con + MT | MCP | MCP + MT | QNP | QNP + MT | Mix | Mix + MT | |
| MDA | ||||||||
| Liver | 22.5 ± 0.2 | 18.8 ± 1.3* | 38.0 ± 1.2*** | 34.2 ± 1.7** | 36.3 ± 1.1*** | 32.5 ± 0.7*** | 32.4 ± 0.6*** | 31.7 ± 1.6*** |
| Brain | 19.2 ± 1.1 | 16.7 ± 0.5* | 30.5 ± 0.6*** | 29.1 ± 0.3*** | 29.2 ± 0.4*** | 27.0 ± 0.4*** | 27.1 ± 0.4** | 24.8 ± 0.6** |
| 4HNE | ||||||||
| Liver | 22.4 ± 3.2 | 20.8 ± 0.8* | 75.0 ± 8.4** | 77.6 ± 6.7** | 64.3 ± 3.2*** | 63.8 ± 3.8*** | 62.3 ± 6.7** | 43.2 ± 7.7** |
| Brain | 21.6 ± 2.8 | 19.6 ± 1.2* | 60.9 ± 6.9** | 50.2 ± 6.5** | 49.5 ± 6.2*** | 43.0 ± 1.8** | 46.5 ± 5.5*** | 34.8 ± 2.5** |
Values of MDA and 4HNE are expressed as nmoles g-1 tissue.
Results are expressed as mean ± SE of six set of observations take on different days. Rats were given 1/30 LD50 equivalent of MCP or QNP or mixture of MCP + QNP (1/60 LD50 equivalent of each) dissolved in 0.4 ml corn oil, orally for sixty consecutive days (total pesticide received by each animal was 2LD50 equivalents in 60 days). Another group of rats was given co-treatment of melatonin (5 mg/Kg body weight intraperitoneally per day for sixty consecutive days) along with 1/60 LD50 equivalent of MCP, QNP or their mixture. < 0.05, **P < 0.01, ***P < 0.001and ≠P > 0.05 when compared with respective control.
Abbreviations: Con, Control; MT, Melatonin, MCP, Monocrotophos; QNP, Quinalphos; Mix, Mixture, MDA, malondialdehyde; 4HNE, 4-hydroxynonenal.
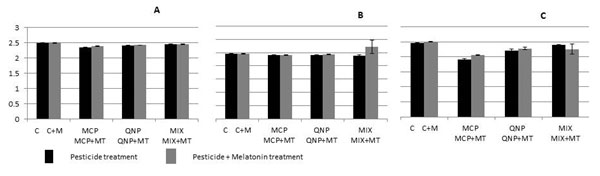
The total antioxidant capacity (TAC) measured in serum of rats was marginally decreased on two days exposure or subchronic exposure of MCP or QNP, either alone or in combination. The decrease in TAC was 6%, 4% and 2% in the serum of rats receiving acute exposure of MCP, QNP and their mixture, respectively, when compared with control (Fig. 2A). In the group given subchronic LD50 equivalents of pesticides, TAC was reduced to 3%, 2% and 11%, while the group receiving 2 LD50 equivalents of pesticides the decrease observed was reduced to 22%, 11% and 3% in the MCP, QNP and mixture treated group, respectively, when compared with control (Fig. 2B and C). Melatonin co-treatment although tend to reduce the pesticide induced alterations in the serum TAC of rats but the effect was very marginal ranging from 0.4 – 1.3% in acute treatment and 0.4 – 7.3% in the chronic LD50 group and 3.6 – 7.3% in chronic 2LD50 group when compared with melatonin untreated group (Fig. 2).
Figure 2: Effect of oral acute (2 days) (A) and subchronic (60 days) exposure LD50 (MCP: 18 mg/Kg, QNP: 20 mg/Kg)(B), 2 LD50 (MCP: 36 mg/Kg, QNP: 40 mg/Kg) (C) of MCP and QNP, single and in combination on total antioxidant capacity in rat serum and evaluation of protective effect of intraperitoneal exposure of melatonin (5 mg/Kg). aP < 0.05, bP < 0.01, cP < 0.001 and d P > 0.05. Abbreviations: C, Control; MT, Melatonin, MCP, Monocrotophos; QNP, Quinalphos; Mix, Mixture.
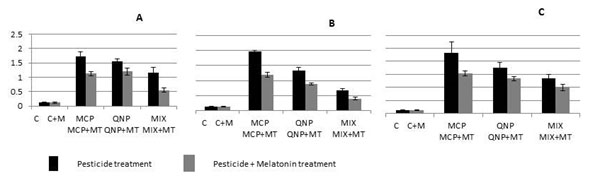
The results of the present study showed that MCP and QNP exposure either singly or in mixture caused drastic increase in the rate of generation of superoxide anion (O2•–) in the lymphocytes of rats. The increase in the level of O2•– was 14.3-, 13- and 9.8- folds in the rats given acute exposure of MCP, QNP and their mixture, respectively, while chronic exposure of LD50 equivalents caused 15.1-, 10.3- and 5.2- folds increase and exposure of 2 LD50 equivalents caused 17.8-, 13.5- and 10.3-folds increase in the rats receiving MCP, QNP and mixture, respectively (Fig. 3). Melatonin co treatment tend to ameliorate the effect of pesticide exposure; 4.9-, 3- and 5.2- folds decrease was observed in the levels of O2•– in the group given two days exposure of MCP, QNP and mixture, respectively (Fig. 3A). In the group receiving melatonin co treatment along with chronic exposure of LD50 equivalents of MCP, QNP and mixture, the increase in the levels of O2•– was 5.9-, 3.5- and 2.1-folds, respectively, while 2LD50 equivalents of MCP, QNP and mixture exposure caused 6-, 3.2- and 2.6- fold decrease, respectively, when compared with only pesticide treated melatonin untreated group (Fig. 3B and 3C).
Figure 3: Effect of oral acute (2 days) (A) and subchronic (60 days) exposure LD50 (MCP: 18 mg/Kg, QNP: 20 mg/Kg) (B), 2 LD50 (MCP: 36 mg/Kg, QNP: 40 mg/Kg) (C) of MCP and QNP, single and in combination on superoxide anion generation in rat lymphocytes and evaluation of protective effect of intraperitonal exposure of melatonin (5 mg/Kg). The concentration of superoxide anion is expressed as nmole O2˙-/ 106 cells/min.35 a P<0.05, b P<0.01, c P<0.001, d P>0.05. Abbreviations: C, Control; MT, Melatonin, MCP, Monocrotophos; QNP, Quinalphos; Mix, Mixture.
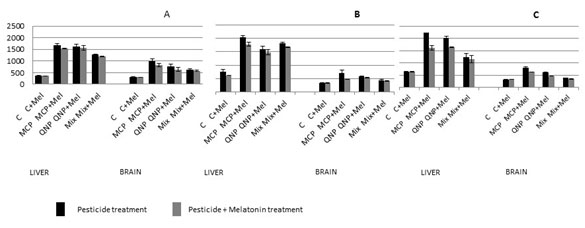
The results of present study clearly showed that the levels of hydrogen peroxide were significantly increased on exposure with MCP and QNP either singly or in combination in the rat tissues when compared with control (Fig. 4). The exposure of 4.5 mg/Kg body weight of MCP for two consecutive days caused 370% increase in the liver and 229% in the brain of rats when compared with control while 5 mg/Kg body weight of QNP exposure caused 357% and 155% increase in the liver and brain, respectively, when compared with control. When the rats were exposed with the mixture of these pesticides, the increase in the levels of hydrogen peroxide were 237% and 106% in the liver and the brain, respectively, when compared with control (Fig. 4A).
Chronic exposure of LD50 and 2 LD50 equivalents of MCP and QNP in 60 days, also significantly increased the levels of H2O2 in the liver and the brain of rats. The increase observed in the liver was 170%, 112% and 140%; while brain showed 118%, 75% and 35% increase when exposed with LD50 equivalents of MCP, QNP and their mixture respectively, in 60 equal doses in 60 days (Fig. 4B). On doubling the dose, the levels of hydrogen peroxide were further increased. Recovery ranged from 4- 18% in the group given 2 days exposure and 7-89% in the group receiving subchronic exposure of pesticides when compared with melatonin untreated group (Fig. 4C).
Figure 4: Effect of oral acute (2 days) (A) and subchronic (60 days) exposure LD50 (MCP: 18 mg/Kg, QNP: 20 mg/Kg) (B), 2 LD50 (C) of MCP and QNP, single and in combination on the levels of H2O2 in the liver and the brain of rats and evaluation of protective effect of intraperitoneal exposure of melatonin (5 mg/Kg). Results are expressed as µmol H2O2 formed/ml preparation.a P<0.05, b P<0.01,c P<0.001, d P>0.05. Abbreviations: C, Control; MT, Melatonin, MCP, Monocrotophos; QNP, Quinalphos; Mix, Mixture
The oxidative damage of purines and pyrimidines was studied by the modified comet assay with the use of Fpg and Endo III which remove the damaged purines and pyrimidines, respectively, and create strand breaks at abasic sites. The results showed that 2 days exposure of 0.25 LD50 equivalents of MCP and QNP either singly or in mixture caused extensive DNA damage and the damage index was increased 233%, 200% and 96% in the liver, 317%, 278% and 144% in the brain and 419%, 313% and 169% in the lymphocytes in buffer treated slides of rats, respectively. When the slides were treated with Fpg or Endo III significantly marked increase in damage index was observed in the liver, brain and lymphocytes of same group of rats, respectively (Table 5) when compared with control or when compared with buffer-treated slides.
The increase observed on Fpg-treatment was 870.96%, 754.83% and 790.32% in the liver, 569%, 508% and 394% in the brain and 565%, 415, and 271% in the lymphocytes of MCP, QNP and Mix treated rats, respectively, when compared with control while Endo III treatment caused 852%, 652.38% and 490.47% increase in the liver, 471%, 371% and 204% increase in the brain and 473%, 362% and 189% in the lymphocytes of the same group of animals, respectively, when compared with control. The results of the present study showed that melatonin co-treatment decreased the damaging effects of pesticides and the DNA damage index was decreased in all the tissues tested when compared with only pesticide treated group. Melatonin co-treatment also caused significantly marked decrease in the damage index in the Fpg and Endo III treated liver, brain and lymphocytes when compared with only MCP, QNP and mix treated tissues (Table 5).
Subchronic treatment of LD50 and 2LD50 equivalents of MCP, QNP and their mixture also caused significantly marked increase in the DNA damage index in the liver, brain and lymphocytes of rats when compared with control. The increase in DNA damage index observed was 232%, 164% and 78% in the liver, 308%, 262% and 181% in the brain and 280%, 208% and 128% in the lymphocytes of rats equivalents of LD50 MCP, QNP and their mixture, respectively, when compared with control (Table 6). The group receiving 2LD50 equivalents of these pesticides, the DNA damage index was increased to 215%, 136% and 54% in the liver, 330%, 233% and 250% in the brain and 219%, 156% and 113% in the lymphocytes of MCP, QNP and their mixture treated group, respectively, when compared with control (Table 7). The DNA damage index was further increased on treatment with Fpg or Endo in slides of all the tissues of the rats of both the groups when compared with buffer-treated slides.
In the liver Fpg treated slides showed 1210%, 1030% and 795% increase, brain showed 887%, 807% and 613% increase, the lymphocytes showed 631%, 569% and 400% increase while Endo treatment showed 892%, 785% and 534.61% increase in the liver, 597%, 523% and 346% increase in the brain and 940%, 788% and 484% increase in the lymphocytes on MCP, QNP and their mixture treatment, respectively, when compared with control (Table 6). The other group of rats receiving 2LD50 equivalents of pesticide treatment showed further increase in the DNA damage index when compared with respective controls (Table 7). Melatonin co treatment showed protective effects against pesticide-induced DNA damage and caused significantly marked decrease in the DNA damage index in all the tissues when compared with only pesticide treated group in case of both the doses of subchronic exposure.
Table 5. Effect of 2 days of MCP (4.5 mg/Kg b.w.) and QNP (5 mg/Kg b.w.) single and in combination on oxidative DNA damage in rat tissues and lymphocytes and protective effects of intraperitoneal dose of melatonin (5 mg/Kg b.w.)
| Tissue | Treat | Con | Con + MT | MCP | MCP + MT | QNP | QNP +MT | Mix | Mix + MT |
| Liver | Buffer | 0.24±0.02 | 0.25±0.01≠ | 0.80±0.01*** | 0.64±0.01*** | 0.72±0.04*** | 0.54±0.03*** | 0.47±0.03*** | 0.37±0.03** |
| Lysis | 0.24±0.01 | 0.18±0.01*** | 1.48±0.02*** | 1.21±0.03*** | 1.10±0.07*** | 0.89±0.09*** | 0.88±0.06*** | 0.70±0.07*** | |
| FPG | 0.31±0.01 | 0.20≠±0.02 | 3.01±0.04*** | 2.00±0.05* | 2.65±0.05*** | 1.70±0.02≠ | 2.76±0.12*** | 1.52±0.11≠ | |
| Endo | 0.21±0.01 | 0.17±0.02≠ | 2.00±0.01*** | 1.13±0.14** | 1.58±0.04*** | 1.03±0.10** | 1.24±0.04*** | 0.89±0.07** | |
| Brain | Buffer | 0.18±0.02 | 0.15±0.02≠ | 0.75±0.03*** | 0.58±0.02*** | 0.68±0.02*** | 0.60±0.03*** | 0.44±0.03*** | 0.36±0.03*** |
| Lysis | 0.26±0.02 | 0.21±0.01≠ | 1.28±0.04*** | 0.96±0.04*** | 1.05±0.07*** | 0.84±0.09*** | 0.83±0.09*** | 0.64±0.07** | |
| FPG | 0.48±0.06 | 0.38±0.08≠ | 3.21±0.07*** | 2.68±0.06*** | 2.92±0.09*** | 1.92±0.14*** | 2.37±0.10*** | 1.33±0.08*** | |
| Endo | 0.51±0.09 | 0.50±0.02≠ | 2.91±0.09*** | 1.51±0.07*** | 2.40±0.09*** | 1.38±0.07*** | 1.55±0.14*** | 0.95±0.03** | |
| Lymp | Buffer | 0.16±0.02 | 0.15±0.01≠ | 0.83±0.03*** | 0.57±0.01*** | 0.66±0.04*** | 0.48±0.03*** | 0.43±0.03*** | 0.34±0.03*** |
| Lysis | 0.19±0.02 | 0.16±0.02≠ | 0.89±0.06*** | 0.67±0.05*** | 0.75±0.03*** | 0.56±0.03*** | 0.42±0.04** | 0.34±0.05* | |
| FPG | 0.48±0.06 | 0.39±0.07≠ | 3.19±0.22*** | 2.11±0.05*** | 2.47±0.09*** | 1.86±0.08*** | 1.78±0.12*** | 1.34±0.03*** | |
| Endo | 0.45±0.06 | 0.37±0.08≠ | 2.58±0.05*** | 2.07±0.01*** | 2.08±0.07*** | 1.69±0.07*** | 1.30±0.14** | 0.73±0.08* | |
Table 6. Effect of 60 days exposure of MCP (18 mg/Kg b.w.) and QNP (20 mg/Kg b.w.) single and in combination on oxidative DNA damage in rat tissues and lymphocytes and protective effects of intraperitoneal dose of melatonin (5 mg/Kg b.w.)
| Tissues | Treatment | Con | Con + MT | MCP | MCP + MT | QNP | QNP +MT | Mix | Mix + MT |
| Liver | Buffer | 0.36±0.03 | 0.31±0.03≠ | 1.03±0.05*** | 0.79±0.02*** | 0.95±0.04*** | 0.66±0.02*** | 0.64±0.04*** | 0.54±0.03** |
| Lysis | 0.44±0.02 | 0.32±0.02* | 1.62±0.15*** | 1.18±0.05*** | 1.33±0.08*** | 0.92±0.07*** | 1.06±0.07*** | 0.75±0.04*** | |
| FPG | 0.20±0.01 | 0.18±0.03≠ | 2.62±0.04*** | 1.80±0.02*** | 2.26±0.08*** | 1.75±0.07*** | 1.80±0.10*** | 1.19±0.07*** | |
| Endo | 0.26±0.01 | 0.20±0.02≠ | 2.58±0.05*** | 1.72±0.03* | 2.30±0.06*** | 1.39±0.03# | 1.65±0.06≠ | 0.84±0.04** | |
| Brain | Buffer | 0.26±0.01 | 0.20±0.01≠ | 1.06±0.05*** | 0.80±0.03*** | 0.94±0.02*** | 0.75±0.04*** | 0.73±0.05*** | 0.55±0.02*** |
| Lysis | 0.33±0.02 | 0.27±0.02≠ | 1.22±0.08*** | 0.88±0.04*** | 1.16±0.04*** | 0.92±0.05*** | 0.92±0.06*** | 0.83±0.05*** | |
| FPG | 0.30±0.02 | 0.21±0.02* | 2.96±0.07*** | 2.42±0.06*** | 2.72±0.09*** | 1.74±0.04*** | 2.14±0.07*** | 1.00±0.06*** | |
| Endo | 0.37±0.02 | 0.28±0.02* | 2.58±0.05*** | 1.72±0.04*** | 2.30±0.06*** | 1.39±0.03*** | 1.65±0.06*** | 0.84±0.04*** | |
| Lymp | Buffer | 0.25±0.01 | 0.20±0.01* | 0.95±0.02*** | 0.62±0.01*** | 0.77±0.02*** | 0.58±0.05*** | 0.57±0.02*** | 0.42±0.04** |
| Lysis | 0.26±0.02 | 0.23±0.01* | 1.14±0.05*** | 0.86±0.05*** | 0.96±0.03*** | 0.78±0.03*** | 0.62±0.04*** | 0.44±0.05* | |
| FPG | 0.35±0.02 | 0.28±0.02* | 2.56±0.04*** | 1.89±0.04*** | 2.34±0.03*** | 1.68±0.03*** | 1.75±0.05*** | 1.26±0.05*** | |
| Endo | 0.25±0.01 | 0.20±0.02≠ | 2.60±0.05*** | 1.87±0.06*** | 2.22±0.04*** | 1.38±0.11*** | 1.46±0.10*** | 0.94±0.10*** |
Values of DNA damage are expressed as damage index calculated as #0 + #1 + #2 + #3 + #4/ # of cell scored where # is the total number of nuclei counted.
Results are expressed as mean ± SE of six set of observations take on different days. Rats were given 1/60 LD50 equivalent of MCP or QNP or mixture of MCP + QNP (1/120 LD50 equivalent of each) dissolved in 0.4 ml corn oil, orally for sixty consecutive days (total pesticide received by each animal was LD50 equivalents in 60 days). Another group of rats was given co-treatment of melatonin (5 mg/Kg body weight intraperitoneally per day for sixty consecutive days) along with 1/60 LD50 equivalent of MCP, QNP or their mixture.
*cdcomparison of MCP + Melatonin with MCP, efcomparison of QNP +Melatonin with QNP and ghcomparison of Mix + Melatonin with Mixture treated group.
*P < 0.05, **P < 0.01, ***P < 0.001and ≠P > 0.05 when compared with respective control.
Abbreviations: Con, Control; MT, Melatonin, MCP, Monocrotophos; QNP, Quinalphos; Mix, Mixture; Lymp, Lymphocytes.
Table 7. Effect of 60 days exposure of MCP (36 mg/Kg b.w.) and QNP (40 mg/Kg b.w.) single and in combination on
oxidative DNA damage in rat tissues and lymphocytes and protective effects of intraperitoneal dose of melatonin (5 mg/Kg b.w.)
| Tissue | Treat | Con | Con + MT | MCP | MCP + MT | QNP | QNP +MT | Mix | Mix + MT |
| Liver | Buffer | 0.39±0.03 | 0.36±0.02≠ | 1.23±0.04*** | 0.96±0.01***,cd*** | 0.92±0.03*** | 0.68±0.06**,ef* | 0.60±0.02*** | 0.48±0.03*,gh** |
| Lysis | 1.16±0.03 | 1.02±0.06≠ | 1.82±0.07*** | 1.44±0.03*,cd** | 1.39±0.09≠ | 1.02±0.05≠,ef** | 1.09±0.07≠ | 0.82±0.05**,gh* | |
| FPG | 0.17±0.03 | 0.12±0.02≠ | 2.92±0.08*** | 2.22±0.05***,cd*** | 2.51±0.06*** | 2.00±0.08***,ef** | 2.08±0.10*** | 1.64±0.07***,gh* | |
| Endo | 0.26±0.01 | 0.20±0.02≠ | 2.58±0.05*** | 1.72±0.03***,cd*** | 2.30±0.06*** | 1.39±0.03*,ef** | 1.65±0.06* | 0.84±0.04≠,gh* | |
| Brain | Buffer | 0.30±0.02 | 0.25±0.01≠ | 1.29±0.05*** | 1.14±0.04***,cd* | 1.00±0.06*** | 0.83±0.05***,ef≠ | 1.05±0.03*** | 0.88±0.03***,gh** |
| Lysis | 0.60±0.05 | 0.46±0.07≠ | 1.29±0.05*** | 1.14±0.05***,cd≠ | 1.16±0.02*** | 0.93±0.04***,ef** | 0.99±0.01*** | 0.77±0.04***,gh** | |
| FPG | 1.26±0.08 | 1.02±0.08≠ | 3.11±0.07*** | 1.75±0.03***,cd*** | 2.33±0.08*** | 1.31±0.05≠,ef*** | 2.62±0.05*** | 1.52±0.05*,gh*** | |
| Endo | 0.99±0.04 | 0.75±0.06* | 2.82±0.08*** | 1.63±0.02***,cd*** | 2.74±0.08*** | 1.53±0.07***,ef*** | 2.27±0.09*** | 1.35±0.08**,gh*** | |
| Lymp | Buffer | 0.32±0.01 | 0.10±0.02*** | 1.02±0.03*** | 0.92±0.04***,cd≠ | 0.82±0.04*** | 0.68±0.04***,ef* | 0.68±0.04*** | 0.51±0.03**,gh* |
| Lysis | 0.42±0.03 | 0.34±0.03≠ | 1.23±0.04*** | 0.98±0.08***,cd* | 1.10±0.02*** | 0.92±0.04***,ef** | 0.74±0.04*** | 0.55±0.03*,gh** | |
| FPG | 0.44±0.04 | 0.36±0.04≠ | 2.56±0.04*** | 2.16±0.04***,cd** | 2.54±0.02*** | 2.05±0.03***,ef*** | 2.12±0.04*** | 1.84±0.02***,gh*** | |
| Endo | 0.45±0.04 | 0.31±0.04≠ | 2.61±0.04*** | 1.98±0.07***,cd*** | 2.27±0.06*** | 1.62±0.04***,ef*** | 1.83±0.04*** | 1.17±0.05***,gh*** | |
Values of DNA damage are expressed as damage index calculated as #0 + #1 + #2 + #3 + #4/ # of cell scored where # is the total number of nuclei counted. Results are expressed as mean ± SE of six set of observations take on different days.
Rats were given 1/30 LD50 equivalent of MCP or QNP or mixture of MCP + QNP (1/60 LD50 equivalent of each) dissolved in 0.4 ml corn oil, orally for sixty consecutive days (total pesticide received by each animal was LD50 equivalents in 60 days). Another group of rats was given co-treatment of melatonin (5 mg/Kg body weight intraperitoneally per day for sixty consecutive days) along with 1/30 LD50 equivalent of MCP, QNP or their mixture.
cd omparison of MCP + Melatonin with MCP, efcomparison of QNP +Melatonin with QNP and ghcomparison of Mix + Melatonin with Mixture treated group.
*P < 0.05, **P < 0.01***, P < 0.001and ≠P > 0.05 when compared with respective control.
Abbreviations: Con, Control; MT, Melatonin, MCP, Monocrotophos; QNP, Quinalphos; Mix, Mixture; Lymp, Lymphocytes.
Generation of reactive oxygen species (ROS) is inevitable in aerobic organisms. The ROS including superoxide anion, hydroxyl radicals, hydrogen peroxide, and others, stem from endogenous sources through cellular metabolism and exogenous sources mediated by environmental exposure of chemicals, pollutants, radiations, cigarette smoke, pesticides and related neurotoxins etc. Nuclear and mitochondrial genomes are under continuous assault by environmentally and endogenous derived ROS, including the formation and accumulation of mutagenic, toxic and/ or genome destabilizing DNA lesions. In most cases, DNA damage from ROS-generating agents is mediated by Fenton-chemistry giving rise to the formation of chronic and persistent damage, including nucleotide base modification, apurinic/ apyrimidic sites, single and double strand breaks, and DNA crosslinks which can be measured by variety of direct and indirect assays including the comet assay (Collins et al., 2001; Azqueta et al., 2009).
Many attempts have been made to establish the mechanism of OP pesticide-induced DNA damage but the outcome of most of the studies have been inconsistent. The present study was carried out to monitor the extent of oxidative damage of DNA bases in rat tissues and lymphocytes on exposure with MCP and QNP. The levels of ROS, total antioxidant capacity and accumulation of lipid peroxidation end products was also monitored in tissues of rats exposed with MCP and QNP in order to establish a correlation if any, between oxidative stress and DNA damage, which could give a clear idea of the mechanism involved in the OP pesticides-induced DNA damage. Previous studies from our laboratory have established that chlorpyrifos, methyl parathion and malathion, the most commonly used OP pesticides, induce oxidative stress in rat lymphocytes and also cause oxidative DNA damage by oxidation of purines and pyrimidines (Ojha and Srivastava, 2014).
Moore et al., 2010 have also demonstrated oxidative stress, DNA damage and cytotoxicity induced by malathion in human liver carcinoma (HepG2) cells (Moore et al., 2010). In order to elucidate mechanism of selected OP pesticide induced DNA damage, the Fpg and Endo III enzymes are included in the comet assay which can measure oxidized purines and pyrimidines, respectively. The study was carried out using rats given acute as well subchronic exposure of MCP and QNP, single and in combination, and monitoring DNA damage in tissues and lymphocytes of exposed rats. The prophylactic potential of melatonin was monitored by its co treatment with pesticides followed by estimation of levels of ROS and DNA damage.
Results of the present study clearly showed that the levels of ROS are significantly increased in tissues and lymphocytes of rats on exposure with MCP and QNP either single or in combination. The results showed that the MCP exposure caused more pronounced increase in the levels of ROS than QNP exposure to the rats. When combined exposure of both the pesticides was given, the ROS levels were lower than either the MCP or QNP exposed group. The increase in the levels of O2•– was higher in the rats given 2 LD50 equivalent of pesticide in 60 days while the increase in H2O2 levels was more in the rats given acute exposure of MCP or QNP either single or in combination.
Co treatment of melatonin has reduced the pesticide-induced increase in the levels of ROS. The results showed that both these pesticides generated oxidative stress in tissues of exposed rats which in turn caused extensive damage to lipids and accumulation of lipid peroxidation products. Increase in lipid peroxidation in response to OP pesticide exposure has been reported by many workers (Rastogi et al., 2009; Mecdad et al., 2011). Other OP pesticides have also been reported to decrease the levels of non-enzymatic antioxidants (Ojha and Srivastava, 2012).
Brain showed higher accumulation than liver in group given chronic exposure of MCP and QNP which seems justified as the distribution of antioxidants is not uniform throughout the body. Because of the low levels of antioxidant enzymes and glutathione, high concentration of iron and readily oxidizable substances such as polyunsaturad fatty acids and catecholamines and high rate of oxidative metabolic activity, the central nervous system is particularly susceptible to damaging effects of ROS. The decrease in levels of GSH and disturbance in glutathione homeostasis in rat liver and brain exposed with MCP and QNP has already been reported earlier (Mishra and Srivastava, 2015). Chlorpyrifos exposure has caused cortical damage in wistar albino rats, manifested due to oxidative stress as observed via increased nitric oxide production, lipid peroxidation and inducible nitric oxide synthase expression.
Further it was observed that there was a decrease in glutathione content and in the activities of glutathione peroxidae, glutathione reductase, catalase and superoxide dismutase in the cortical tissue (Albasher et al., 2020). Results of the present study showed that oral exposure of MCP and QNP either single or in mixture caused extensive DNA damage in rat liver, brain and lymphocytes, measured by single cell gel electrophoresis. DNA oxidation is known to be the most common type of DNA damage to human and other species. The role of ROS in production of DNA single and double strand breaks and oxidative damage to DNA bases is well known (Azqueta et al., 2009). The damaged purines and pyrimidines bases were identified by modified comet assay using lesion specific bacterial repair enzymes, Fpg, which acts on damaged purines and Endo III which removes damaged pyrimidines, and convert base damage to breaks.
The increase in number of breaks on Fpg-Endo treatment, is directly proportional to the number of oxidized bases. Results of the present study showed that the DNA damage index was markedly increased in Fpg-Endo treated slides of the liver, brain and lymphocytes in MCP or QNP treated group when compared with buffer treated slides of corresponding tissues. It was observed that Fpg treatment caused higher increase in DNA damage index indicating that oxidation of purines is more than oxidation of pyrimidines, by these pesticides. In the present study, the difference in DNA damage index in the presence and absence of Fpg and Endo III enzymes suggest that oxidative stress is responsible for OP pesticides induced DNA damage. The results also showed that rat tissues given acute exposure of these pesticides showed more damage than the rats given low level exposure of these pesticides for longer duration.
Melatonin co treatment showed protection against oxidative injuries and the DNA damage was lowered in these groups when compared with melatonin untreated group. There have been several investigations in in vivo and in vitro on the correlation between toxicant induced oxidative stress and DNA damage. The OP pesticides, chlorpyrifos, methyl parathion and malathion, singly and in combination cause oxidative stress and oxidation of purine and pyrimidine bases in rat lymphocytes, in vitro (Ojha and Srivastava, 2014). Other studies reported on oxidative stress and DNA damage in response to exposure with OP pesticides include methyl parathion in spermatozoa of male mouse (Rahman et al., 2002), monocrotophos in rat tissues, malathion on human liver carcinoma cells (Moore et al., 2010), chlorpyrifos in rat tissues and lymphocytes (Rahman et al., 2002; Mehta et al., 2008), fenitrothion in aquatic organism Fingerlings, Oreochromis niloticus L.(Zeid and Khalil, 2014), and several other OP pesticides (Lu et al., 2016).
Malathion has been widely studied for its ability to cause oxidative stress in human subjects and subsequently cause toxicity in various organs. Antioxidants have proved to be very effective in decreasing lipid peroxidation and oxidative stress. Natural products that have effectively reduced damage in biological system include aged garlic extract, Aloe Vera, caffeic acid, grape seed extract and curcumin (Badr, 2020). Not only in mammals the organophosphate pesticides have shown to induce toxicity in Chlorella pyrenoidosa. The pesticides that were evaluated for their toxic effects were acephate (ACE), trichlofor (TRI) and glyphosate (GIY). The possible mechanism of toxicity in this study could be affect on photosynthesis and subsequent oxidative damage to C.pyrenoidosa cells (Tao et al., 2020).
Melatonin also prevents the damage caused by OP pesticides such as diazinon and reduces the levels of trace and major elements (Sarbia et al., 2009; Cemek et al., 2010). Melatonin prevented the oxidative stress in the periodontal tissue of the rats receiving radiotherapy for the treatment of periodontitis (Kose et al., 2017). Melatonin also posesses the ability to protect the biological system such as the renal tissues against the oxidative damage caused by the carcinogens such as arsenic, 2-nitropropane, carbon tetrachloride etc (Gultekin and Hicyilmaz, 2007). Melatonin has recently been evaluated for its ability to reduce oxidative stress caused by a carcinogen dimethyl benz (a) anthracene (DMBA) thereby further validating its antioxidant properties (Muqbil et al., 2020).
CONCLUSION
The present study clearly demonstrates the ability of monocrotophos and quinalphos to generate oxidative stress. This oxidative stress leads to the formation of oxidized pyrimidines and purines thereby damaging the integrity of the genome. The protective effects of melatonin against the exposure of these pesticides indicate its ability to be used as a suitable therapeutic agent. Hence the use of low doses of melatonin as a dietary supplement in agriculture and household can save the non-target organisms from the harmful effects of these pesticides.
ACKNOWLEDGEMENTS
The financial support of Department of Science and Technology, New Delhi, India, in the form of FIST grant to the school, in the form of individual research project to Prof. Nalini Srivastava [Grant no: No. SR/SO/BB-58/2009] and in the form of INSPIRE Fellowship to Vibhuti Mishra is thankfully acknowledged.
Conflict of Interest: The Authors declare no conflict of interest.
REFERENCES
Albasher, G., Alsaleh, A.S., Alkubaisi, N., Alfarraj, S., Alkahtari, S., Farhood, M., Alotibi, N. and Almeer R. (2020). Red Beetroot Extract Abrogatus Chlorpyrifos-Induced Cortical Damage in Rats. Oxidative Medicine and Cellular Longevity, pp.2963020.
Ali S. J. (2020). Monocrotophos, an organophosphorus insecticide, induces cortical and trabecular bone loss in Swiss albino mice. Chemico-biological interactions, 329: pp. 109112.
Azqueta, A., Lorenzo, Y. and Collins, A.R. (2009). In vitro comet assay for DNA repair: a warning concerning application to cultured cells. Mutagenesis, 24: pp.379-381.
Hacışevki, A. and Baba, B. (2018). An Overview of Melatonin as an Antioxidant Molecule: A Biochemical Approach, Melatonin – Molecular Biology, Clinical and Pharmaceutical Approaches, IntechOpen, DOI: 10.5772/intechopen.79421.
Badr, A.M. (2020). Organophosphate toxicity: updates of malathion potential toxic effects in mammals and potential treatments. Environmental Science Pollution Research 27: pp.26036-26057.
Cadet, J., Douki, T., Gasparutto, D. and Ravanat, J.L. (2003). Oxidative damage to DNA: formation, measurement and biochemical features. Mutation Research, 531: pp. 5-23.
Cemek, M., EminBuryukben, A., Yurumen, Y., Yavuz, Y., Aslan, A., Büyükben A and Aymelek, F. (2010) Tissue trace and major element levels in organophosphate insecticide fenthion (Lebaycid) toxicity in rats: prophylactic and therapeutic effect of exogenous melatonin. Ecotoxicology and Environmental Safety, 73: pp. 206-212.
Cohen, H.J., Chovaniec, M.E. and Davies, W.A. (1980). Activation of the guinea pig granulocyte NAD(P)H dependent superoxide generating enzyme: localization in a plasma membrane enriched particle and kinetics of activation. Blood, 55: pp. 355-363.
Collins, A.R., Duthie, S.J. and Dobson, V.L. (1993). Direct enzymatic detection of endogenous oxidative base damage in human lymphocyte DNA. Carcinogenesis, 14: pp. 1733-1735.
Collins, A.R., Dusinska, M., Horvathova, E., Munro, E., Savio, M. and Stetina, R. (2001). Interindividual differences in repair of base oxidation, measured in vitro with the comet assay. Mutagenesis, 16: pp. 297-301.
Cooke, M.S., Evans, M.D., Dizdaroglu, M., Lunec, J. (2003). Oxidative DNA damage: mechanisms, mutation and diseases. FASEB Journal, 17: pp. 1195-1214.
Collins, A., Vettorazzi, A., Azqueta, A. (2020). The role of the enzyme- modified comet assay in in vivo studies. Toxicology Letters, 327: pp. 58-68.
Costa, L.G. (2018). Organophosphorus Compounds at 80: Some Old and New Issues. Toxicological Sciences, 162(1): pp. 24–35.
Eid, R.A. (2017). Apoptosis of rat renal cells by organophosphate pesticide, quinalphos: Ultrastructural study. Saudi Journal of Kidney Diseases and Transplantation, 28: pp. 725-36
Farkhondeh, T., Mehrpour, O., Forouzanfar, F., Roshanravan, B., and Samarghandian, S. (2020). Oxidative stress and mitochondrial dysfunction in organophosphate pesticide-induced neurotoxicity and its amelioration: a review. Environmental science and pollution research international, 27(20): pp. 24799–24814.
Fischer, T.W., Slominski, A., Zmijewski, M.A., Reiter, R.J. and Paus, R. (2008). Melatonin as a major skin protectant: From free radical scavenging to DNA damage repair. Experimental Dermatology, 17: pp. 713-730.
Gaines, T.B. (1969). Acute toxicity of pesticides. Toxicology and Applied Pharmacology, 14: pp. 515–534.
Greeshma, K.P., Maiyam, K.H., Paul, L and Pushpalatha E. (2019). Biochemical effects of organophosphorous pesticides, Quinalphos on fresh water fish, Oreochromis niloticus (L). Journal of Advanced Laboratory Research in Biology, 10(3): pp. 95-99.
Gultekin, F. and Hicyilmaz, H. (2007). Renal deterioration caused by carcinogens as a consequence of free radical mediated tissue damage: a review of the protective action of melatonin. Archives of Toxicology, 81:pp. 675–681. http:// biology.mit.edu/sites/default/files/Rat Brain Dissection.pdf
Jacobson, S.O., Cassel, G.E. and Person, S.A. (1999). Increased levels of nitrogen oxides and lipid peroxidation in the rat brain after soman induced seizures. Archives of Toxicology, 73: pp. 269-273.
Kaur, R. and Goyal, D. (2019). Toxicity and degradation of the insecticide monocrotophos. Environmental Chemistry Letters, 17: pp. 1299–1324.
Köse, O., Arabaci, T., Kizildag, A., Erdemci, B., Özkal Eminoğlu, D., Gedikli, S., Özkanlar, S., Zihni, M., Albayrak, M., Kara, A. and Kermen, E. (2017). Melatonin prevents radiation-induced oxidative stress and periodontal tissue breakdown in irradiated rats with experimental periodontitis. Journal of Periodontal Research, 52(3): pp. 438-446.
Laksmidewi, A. A. A. P, Putri, Ni. L. P. D. S, Adnyana, I. M. O and Widyadharma, I. P. E. (2020). Cognitive Disorders with High Beta Amyloid Levels in Farmers using Organophosphate Pesticides. Biomedical and Pharmacology Journal, 13(1).
Liao, W., McNutt, M.A. and Zhu, W. (2009). The comet assay: A sensitive method for detecting DNA damage in individual cells. Methods, 48: 46-53.
Lukaszewicz-Hussain, A. (2010). Role of oxidative stress in organophosphate insecticide toxicity – Short review, Pesticide Biochemistry and Physiology, 98: pp. 145–150.
Lu, Y.C., Feng, S.J., Zhang, J.J., Luo, F., Zhang, S. and Yang, H. (2016). Genome-wide identification of DNA methylation provides insights into the association of gene expression in rice exposed to pesticide atrazine. Scientific Reports, 6:pp. 18985.
Martins, P.N. and Neuhaus, P. (2007). Surgical anatomy of the liver, hepatic vasculature and bile ducts in the rat. Liver International, 27: pp. 384-392.
Mecdad, A.A., Ahmed, M.H., Elhalwagy, M.E.A. and Afify, M.M.M. (2011). A study on oxidative stress biomarkers and immunomodulatory effects of pesticides in pesticide sprayers. Egyptian Journal of Forensic Sciences, 1:pp. 93-99.
Mehta, A., Verma, R.S. and Srivastava, N. (2008). Oxidative DNA damage induced by chlorpyrifos in rat tissues. Environmental and Molecular Mutagenesis, 49: pp. 426-433.
Moore, P.D., Yedjou, C.G. and Tchounwou, P.B. (2010). Malathion-induced oxidative stress,
cytotoxicity and genotoxicity in human liver carcinoma (HepG2) cells. Environmental Toxicology, 25: pp. 221-226.
Mishra, V. and Srivastava, N. (2015). Organophosphate pesticides-induced changes in redox status of rat tissues and protective effects of antioxidant vitamins. Environmental Toxicology, 30: pp. 472-482.
Mishra, V., Sharma, S., Khatri, S. and Srivastava, N. (2015). Evaluation of genotoxicity of
monocrotophos and quinalphos in rats and protective effects of melatonin. Integrative Pharmacology Toxicology and Gentoxicology, 1(1): pp. 33-42.
Muqbil, I., Fatima, S., Azmi, A. S., Alsharidah, A. S., Khan, S. A., Aljaser, F., and Banu, N. (2020). Restraint stress abates the antioxidant potential of melatonin on dimethyl benz (a) anthracene (DMBA) induced carcinogenesis. Medical oncology (Northwood, London, England), 37(10): pp.96.
Ojha, A., Srivastava, N. (2012). Redox imbalance in rat tissues exposed with organophosphate pesticides and therapeutic potential of antioxidant vitamins. Ecotoxicology and Environmental Safety, 75: pp. 230-241.
Ojha, A., Srivastava, N. (2014). In vitro studies on organophosphate pesticides induced
oxidative DNA damage in rat lymphocytes. Mutation Research, 761: pp. 10-17.
Ojha, A., Yaduvanshi, S.K., Pant, S.C., Lomash, V., Srivastava, N. (2013). Evaluation of DNA damage and cytotoxicity induced by three commonly used organophosphate pesticides individually and in mixture, in rat tissues. Environmental Toxicology, 28: pp. 543-552.
Phatak, A.G. (1978). Various methods of lymphocyte separation and their relevance with the formation of non-immune rosettes. Journal of Immunological Methods, 20: pp. 109-115.
Pick, E. (1986). Microassays for superoxide and hydrogen peroxide production and nitroblue
tetrazolium reduction using an enzyme immunoassay microplate reader. Methods in Enzymology, 132: pp. 407-421.
Pick, E. and Keisari, Y. (1981). Superoxide anion and hydrogen peroxide production by chemically elicited peritoneal macrophages: induction by multiple non-pregnanthagocytic stimuli. Cellular Immunology, 59: pp. 301-318.
Phillipis, H.J. (1973). Dye Exclusion Test for Cell Viability, In: PF Krusa, MJ Patterson (Eds), Tissue Culture: Methods and Applications, Academic Press,New York, pp. 406-408.
Poetsch, A. R. (2020). The genomics of oxidative DNA damage, repair, and resulting mutagenesis. Computational and structural biotechnology journal, 18: pp. 207–219.
Rahman, M.F., Mahboob, M., Danadevi, K., Saleha Banu, B. and Grover, P. (2002). Assessment of genotoxic effects of chloropyriphos and acephate by the comet assay in mice leucocytes. Mutation Reseach, 516: pp.139 – 147.
Raizada, R.B., Srivastava, M.K., Singh, R.P., Kaushal, R.A., Gupta, K.P. and Dikshit, T.S. (1993). Acute and subchronic oral toxicity of technical quinalphos in rats. Veterinary and Human Toxicology, 35:pp.223–225.
Rao, M.V. and Purohit, A.R. (2011). Neuroprotection by melatonin on mercury induced toxicity in the rat brain. Pharmacology and Pharmacy, 2: pp.375-385.
Rastogi, S.K., Satyanarayan, P.V.V., Ravishankar, D. and Tripathi, S. (2009). A study on oxidative stress and antioxidant status of agricultural workers exposed to organophosphorous insecticides during spraying. Indian Journal of Occupational and Environmental medicine, 13: pp.131-134.
Reiter, R.J., Tan, D.X., Mayo, J.C., Sainz, R.M., Leon, J. and Czarnocki, Z. (2003). Melatonin as an antioxidant: biochemical mechanisms and pathophysiological implications in humans. Acta Biochimica Polonica, 50: pp.1129-1146.
Rice- Evans, C. and Miller, N.J. (1994). Total antioxidant status in plasma and body fluids. Methods in Enzymology, 234: pp. 279-293.
Sabarwal, A., Kumar, K. and Singh, R.P. (2018). Hazardous effects of chemical pesticides on human health-Cancer and other associated disorders. Environmental Toxicology and Pharmacology, 63: pp 103-114.
Sarbia, L., Maurer, I. and Bustos, O. (2009). Melatonin prevent damage elicited by the
organophosphorous pesticide diazonin on mouse sperm DNA. Ecotoxicology Environmental Safety, 72: pp. 663-668.
Soltaninejad, K. and Abdollahi, M. (2009). Current opinion on the science of organophosphate pesticides and toxic stress: A systemic review. Medical Science Monitor, 15: RA 75-90.
Suke, S.G., Kumar, A., Ahmed, R.S., Chakraborti, A., Tripathi, A.K., Mediratta, P.K. and Banerjee, B.D. (2006). Protective effect of melatonin against propoxur-induced oxidative stress and suppression of humoral immune response in rats. Indian Journal of Experimental Biology, 44: pp. 312-315.
Tao, M., Bian, Z., Zhang, J., Wang, T. and Shen, H. (2020). Quantitative evaluation and the toxicity mechanism of synergism within three organophosphorous pesticide mixtures to Chlorella pyrenoidosa. Environmental Science: Processes and Impacts, 22: pp.2095-2103.
Taparia, N., Mathur, P. and Shahani, L. (2014). Toxic action of quinalphos 25% EC (Flash), an organophosphate insecticide in induction of skeletal malformations in the embryos of Gallus domesticus. World Journal of Pharmaceutical Sciences. 3: pp. 2078-2088.
Tuck, M.K., Chan, D.W., Chia, D., Godwin, A.K., Grizzle, Krueger, K.E., Rom, W., Sanda M., Sorbara, L., Stass, S., Wang, W., Brenner, D.E. (2009). Standard operating procedures for serum and plasma collection: early detection research network consensus statement standard operating procedure integration working group. Journal of Proteome Research, 8: pp. 113-117.
Yaduvanshi, S.K., Ojha, A., Pant, S.C., Lomash, V. and Srivastava, N. (2010). Monocrotophos induced lipid peroxidation and oxidative DNA damage in rat tissues. Pesticide Biochemistry and Physiology, 97: pp. 214-222.
Zeid, E.H.A. and Khalil, A.L.S.A. (2014). Effects of acute Fenitrothion insecticide exposure on DNA damage and oxidative stress biomarkers and health of Nile Tilapia Fingerlings, Oreochromis niloticus L. World Journal of Fish and Marine Sciences. 6: pp. 361-370

