1Department of Agrarian Policy and Development Forecasting, Agroindustrial Complex,Federal Scientific Center
for Agrarian Economy and Social Development of Rural Areas, All-Russian Research
Institute for Agricultural Economics, Moscow, Russia.
2 Belgorod Agrarian University, Belgorod, Russia.
Article Publishing History
Received: 25/10/2021
Accepted After Revision: 28/12/2021
The agrarian policy pursued in Russia is primarily aimed at ensuring food security, the main components of which are the economic and physical availability of food to the population. However, the indicators approved in the regulatory legal acts on food security monitoring do not contribute to its objective assessment. They can be used to assess the overall state of food security. A more in-depth analysis is needed for a more objective assessment of the economic availability of food to the population of the Russian Federation, which requires, among other things, changes in the methods of calculating food independence, taking into account the share of household disposable resources used to purchase food.
It is also necessary to take into account the energy value of food, the quality of food consumed, etc. To do this, it is necessary to significantly expand the information base on the food consumed, including taking into account its quality and energy value. The paper attempts, based on the available analytical data, to assess the economic availability of food for households depending on their income, as well as in the context of socio-demographic groups, to identify the main factors constraining bringing the level of food consumption to rational norms.
Economic Accessibility of Food, Food Independence, Food Security, the Purchasing Power of the Population.
Kolesnikov A.I, Nasedkina T.I, Reshetnyak L.A, Gruzdova L.N, Chernykh A.I, Zolotarev S.N. The Need for Production Volumes of Main Agricultural Products as an Integral Part of the Russian Agrarian Policy. Biosc.Biotech.Res.Comm. 2021;14(4).
Kolesnikov A.I, Nasedkina T.I, Reshetnyak L.A, Gruzdova L.N, Chernykh A.I, Zolotarev S.N. The Need for Production Volumes of Main Agricultural Products as an Integral Part of the Russian Agrarian Policy. Biosc.Biotech.Res.Comm. 2021;14(4). Available from: <a href=”https://bit.ly/3DytI5Z“>https://bit.ly/3DytI5Z</a>
Copyright © Kolesnikov et al., This is an open access article distributed under the terms of the Creative Commons Attribution License (CC-BY) https://creativecommns.org/licenses/by/4.0/, which permits unrestricted use distribution and reproduction in any medium, provide the original author and source are credited.
https://bbrc.in/wp-content/uploads/2021/07/BBRC_Vol_14_No_04_2021-82.pdfINTRODUCTION
The conducted agri-food policy contributed to an increase in the gross harvest of the main crops. For 2010-2020, gross grain collections increased from 94.2 to 133.5 million tons, sunflower seeds from 5.3 to 13.3 million tons, fruits and berries from 2.1 to 3.7 million tons, vegetables of protected and open ground from 11 to 13.9 million tons. The gross harvest of potatoes and sugar beet are unstable, but at the same time tend to increase. The production of livestock products, which is especially important for ensuring the Doctrine of Food Security, is also increasing at a less dynamic pace. From 2010 to 2020, milk production increased from 31.5 to 32.2 million tons, and the production of livestock and poultry for slaughter (in slaughter weight) from 7.2 to 11 million tons, marketable eggs from 40.8 to 48.4 billion units, which is still not enough to ensure food security indicators (Rosstat 2021).
MATERIAL AND METHODS
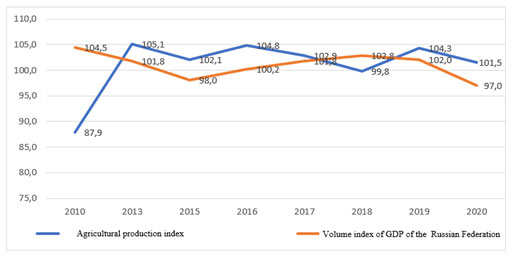
In 2020, farms of all categories produced gross agricultural output of 6.1 trillion rubles, including 3.3 trillion rubles in crop production, 2.8 trillion rubles in animal husbandry (Table 1). The volume of gross output produced in farms of all categories in 2020 increased by 5.3%, including in crop production by 7.2%, in animal husbandry by 3.2%. Even though the volume index of GDP amounted to 97% and has a downward trend, this indicator in agriculture, although unstable, exceeds the average for the economy. The volume index of agricultural production was 1.5% in 2020 (Figure 1). As before, a significant share of agricultural products is produced by large-scale agricultural organizations, which have undoubted advantages in the formation of their production capacity, produced on an industrial scale.
RESULTS AND DISCUSSION
Table 1. Agricultural products in farms of all categories of the Russian Federation, billion rubles
| Years | ||||||||
| 2010 | 2013 | 2015 | 2016 | 2017 | 2018 | 2019 | 20201) | |
| Agricultural products | 2,462.2 |
3,458.3 |
4,794.6 | 5,112.3 | 5,109.5 | 5,348.8 | 5,801.4 | 6,110.8 |
| crop production | 1,090.2 | 1,730.2 | 2,487.3 | 2,710.3 | 2,599.7 | 2,756.1 | 3,056.4 | 3,276.9 |
| animal husbandry | 1,372.0 | 1,728.1 | 2,307.3 | 2,402.0 | 2,509.8 | 2,592.7 | 2,745.0 | 2,833.9 |
Source: According to Rosstat (2021)
Figure 1: Volume index of Russia’s GDP and agriculture
The share of agricultural organizations in the gross output of agriculture in (2020) amounted to 58.3%, households 27.4%, farms 14.3% (Table 2), while agricultural organizations produced only 44.8% gross production in 2010, households 48.0%, farms 7.2%.
Table 2. Gross agricultural output by category of farms (in actual prices; as a percentage of the total)
| 2000 | 2010 | 2018 | 2019 | 2020 | |
| Farms of all categories | 100 | 100 | 100 | 100 | 100 |
| including: | |||||
| agricultural organizations | 45.2 | 44.8 | 56.5 | 57.7 | 58.3 |
| households | 51.6 | 48.0 | 31.0 | 28.6 | 27.4 |
| peasant farm enterprises 1) | 3.2 | 7.2 | 12.5 | 13.7 | 14.3 |
Source: According to Rosstat (2021)
We believe that at this stage, comprehensive support was needed for farms that can use small fields more efficiently, and in the future will increase the volume of agricultural production, transforming into industrial agricultural organizations. Therewith, farms and agricultural organizations would replace the production volumes previously produced by households of the population. Such a measure will contribute to increasing the volume of resources used, including labor. The main producers of grain, sugar beet, sunflower seeds, livestock and poultry for slaughter, milk, and eggs are agricultural organizations (Altukhov, Drokin and Zhuravlev 2015).
They are also increasing the production of vegetables. The traditional types of products produced in the households of the population are potatoes, vegetables, fruits and berries, livestock and poultry, milk, and wool. It should be noted that the share and volumes of these types of products in the households of the population are decreasing for several reasons. At the same time, for these types of products, in dynamics, there is an increase in the share of manufactured products in farms and agricultural organizations. The share of potato production in households decreased by 26% in the 2000s. The share of potato production in agricultural organizations increased by 13.4% and by 12.6% in farm enterprises (Table 3) (Altukhov et al 2015).
Table 3. Change in the share of production of the main types of agricultural
products by categories of farms for 2000-2020, %
| Households | Agricultural organizations | Peasant farm enterprises | |
| Grain (in weight after completion) | -0.1 | -21 | 21.1 |
| Sugar beet | -0.5 | -2.2 | 2.7 |
| Sunflower seeds | -0.9 | -19.6 | 20.5 |
| Potato | -26 | 13.4 | 12.6 |
| Vegetables | -24.6 | 5.6 | 19 |
| Fruits and berries | -19.9 | 11.4 | 8.5 |
| Cattle and poultry for slaughter (slaughter weight) | -41.8 | 40.5 | 1.3 |
| Milk | -15.2 | 8.2 | 7 |
| Eggs | -10.8 | 10 | 0.8 |
| Wool (in physical weight) | -12.5 | -20.2 | 32.7 |
Source: Calculated according to Rosstat data (2021)
The share of vegetable production in households decreased by 24.6%, while in agricultural organizations it increased by 5.6%, and in farms by 19%. The share of fruit and berry production in households decreased by 19.9%, while in agricultural organizations it increased by 11.4%, and in farms by 8.5%. An increased in the share of production of basic types of products in agricultural organizations and farms occured due to a decrease in the share of production in households of the population. As can be seen from the above material, the change in the types of products is uneven.
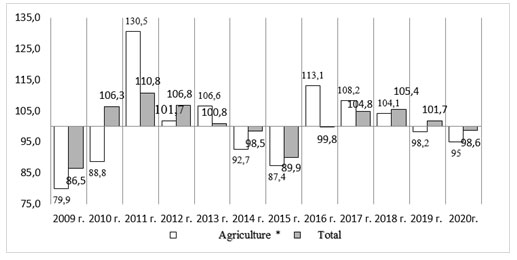
The investment component of the development of agricultural production, which does not contribute to the active increase in the production of agricultural products and food, is of concern (Altukhov et al. 2015). The index of investments in fixed assets of agricultural organizations showed negative trends (Figure 2). By the end of 2020, investments in the industry decreased by 5.0% compared to the previous year, while the Ministry of Agriculture planned an increase of 1.1% following the State Program. This threatens the technological development of agricultural production (Kolesnikov 2019).
Figure 2: Volume index of investments in all types of economic activity, including
agriculture for2009-2020, compared to the previous year, %
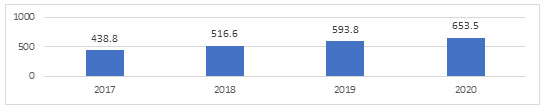
Despite this, positive trends in the development of agricultural production should be noted. The number of high-performance jobs continues to increase. In (2020), there were more than 635 thousand of them (Figure 3), which, according to preliminary estimates, is about 14% of the total number of jobs in agriculture. In this direction, it was necessary to do serious work related to both an increase in the intensity of production and an increase in the incomes of agricultural workers. Together, this would increase the purchasing power of the rural population, and would also contribute to an increase in the level of food independence and economic accessibility of food (Kolesnikov 2019).
Figure 3: The number of high-performance jobs in agriculture, thousand units
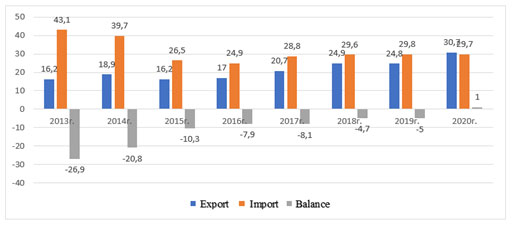
According to the Federal Center for the Development of Exports of Agricultural Products of the Ministry of Agriculture of Russia (Agroexport) in 2020, the balance of foreign trade in food products and agricultural raw materials became positive for the first time and amounted to 1 US Dollars Billion (Figure 4). The main buyers of agricultural products were: China – 4.0 US Dollars Billion, the EU – 3.3 US Dollars Billion, Turkey – 3.1 US Dollars Billion, Kazakhstan – 2.1 US Dollars Billion, Egypt – 2.0 US Dollars Billion, the Republic of Korea – 1.8 US Dollars Billion. In the structure of exports, 34% were cereals, 17.0% fish and seafood, 16% fat-and-oil products, 15% food and processing industry products (Kolesnikov 2019).
Figure 4: Dynamics of foreign trade in food products and agricultural
raw materials (except textile), US Dollars Billion
It should be understood that the successfully developed market situation in the world food market should not become a reason for abstracting from issues related to increasing the volume of food exports, taking into account the implementation of the indicators of the Food Security Doctrine. Here it was necessary to make efforts to increase the production of agricultural products, as well as to increase the share of the sale of food with high added value. It was also necessary to increase the volume of export products with high conversion rates.
Special attention should be paid to this aspect. This was also due to the adoption by several developed countries of programs to significantly reduce the use of hydrocarbons, the transition to a green economy, which would negatively affect the raw exports of hydrocarbons and reduce the total volume of export revenue. Based on the above, it was necessary to increase the volume of production of agricultural products of high processing, improve its quality, enter new markets for food (Altukhov, Drokin and Zhuravlev 2015; Kolesnikov, Akupiyan and Andreeva 2017).
Moreover, the profit of agricultural organizations has increased by 2 times over the past 4 years (Table 4). This should contribute to the technical and technological modernization of agricultural production and increase the volume of agricultural production. However,agricultural organizations are dependent on the supply of imported fixed assets in terms of modernization of production and its innovative development. In 2019, agricultural organizations of Russia spent 242.8 billion rubles on the purchase of imported fixed assets, which is almost comparable to the amount of profit received (Ushachev, Serkov and Maslova 2019).
Table 4. Profit from the results of the activities of agricultural organizations
| 2017 | 2018 | 2019 | 2020 | |
| Share of profitable organizations, % | 81.0 | 79.7 | 78.9 | 80.8 |
| Profit (loss before taxation), billion rubles | 270.1 | 349.8 | 298.2 | 542.3 |
Source: according to Rosstat (2021)
The consumption of basic foodstuffs by the population does not yet meet rational standards. First of all, this applies to vegetables and melons, fruits and berries, milk and dairy products, for which consumption in 2019 amounted to 77.1%, 62%, and 72% of the recommended rational norms, respectively (Table 5). This problem was not so much agrarian as macroeconomic. The consumption of individual foods remains low. The dynamics of consumption and production of basic foodstuffs are different.
The production of meat and meat products increased by almost 2.5 times from 2000 to 2019, while consumption increased by 1.7 times, egg production increased by 33.8%, and consumption by 24.5%, sugar production increased by 17.7%, and consumption by 11.4%, vegetable oil production increased by 4.4 times, and consumption by 41.4%. Thus, an increase in production volumes for these products can meet the growing needs of the population. The situation was different with milk production. Its production volumes decreased by 3.4%, and consumption increased by 8.3% (Ushachev et al 2019).
A similar situation was developing for vegetables and fruits: production volumes for vegetables increased by 28.1%, and consumption by 36.7%, and production volumes for fruits increased by 36.1%, and consumption by 93.6%. It is necessary to increase production volumes to meet the needs of the population for these types of products. A non-standard situation is developing for potatoes and bread products. Potato production volumes decreased by 33.5%, and consumption by 18.3%. Production decreased by 11.9% for bread and bread products, and consumption by 0.9%. That is, it is necessary to increase production for these types of products (Ushachev et al 2019).
Table 5. Dynamics of production and consumption of basic foodstuffs in the Russian Federation
| Recommended rational rate of food consumption, kg | Consumption per 1 person, year, kg
2019 |
Ratio of actual consumption to the rational norm, % | Consumption in 2019 in % to 2000 | Production 2020 in % to 2000 | |
| Meat and meat products in terms of meat | 73 | 76 | 104.1 | 168.9 | 248.9 |
| Milk and dairy products in terms of milk | 325 | 234 | 72.0 | 108.3 | 96.6 |
| Eggs and egg products – pieces*) | 260 | 285 | 109.6 | 124.5 | 133.8 |
| Sugar | 24 | 39 | 162.5 | 111.4 | 117.7 |
| Vegetable oil | 12 | 14.0 | 116.7 | 141.4 | 434.0 |
| Potato | 90 | 89 | 98.9 | 81.7 | 66.5 |
| Vegetables and food melons | 140 | 108 | 77.1 | 136.7 | 128.1 |
| Fruits and berries | 100 | 62 | 62.0 | 193.6 | 136.1 |
| Bread products | 96 | 116 | 120.8 | 99.1 | 88.1 |
Source: Calculated according to Rosstat data (2021)
However, it was provided that the population will have effective demand and trends in the consumption of basic foodstuffs will change for the better, and rational consumption of basic foodstuffs will not be revised upwards (Kolesnikov 2019). Meanwhile, it is important to understand and take into account the deficit of consumption of basic foodstuffs in the context of decile groups. The number of products that are consumed according to rational norms increases with a boost in income in the context of decile groups (Table 6).
Only the consumption of sugar and confectionery is deficient in the first and second decile groups. The consumption of sugar and confectionery, meat and meat products were deficient in the third group. The deficient consumption of bread was added in the fourth group, fish and fish products – in the fifth and sixth groups. The consumption of bread becomes deficient in the seventh and tenth groups. To meet the needs for basic foodstuffs in the context of decile groups, it was necessary to take into account the shortage of funds, which must be eliminated to meet the needs of the population according to rational nutrition standards (Table 7), (Ushachev et al 2019).
Table 6. Deficit of consumption of basic foodstuffs by decile groups in 2019,
on average per consumer per year, kg
| First | Second | Third | Fourth | Fifth | Sixth | Seventh | Eighth | Ninth | Tenth | |
| Bread and bread products | -7.1 | -4.8 | -2.8 | 2.0 | 4.2 | 1.2 | -1.0 | 2.0 | 3.1 | -3.8 |
| Potato | -39.7 | -36.3 | -33.0 | -29.7 | -30.0 | -31.6 | -31.6 | -28.8 | -29.2 | -30.5 |
| Vegetables and melons | -72.0 | -57.2 | -49.5 | -39.8 | -36.1 | -31.0 | -27.1 | -22.7 | -14.5 | -14.0 |
| Fruits and berries | -57.1 | -45.9 | -37.7 | -32.0 | -27.0 | -21.0 | -17.0 | -7.8 | -2.7 | 0.7 |
| Meat and meat products | -14.1 | -1.0 | 6.8 | 10.9 | 18.5 | 20.7 | 25.0 | 32.9 | 38.7 | 35.8 |
| Milk and dairy products | -151.9 | -116.2 | -92.4 | -70.8 | -35.0 | -52.9 | -43.3 | -20.4 | -7.7 | -0.7 |
| Eggs, pcs. | -85 | -61 | -47 | -36 | -25 | -22 | -20 | -2 | 17 | 20 |
| Fish and fish products | -8.2 | -5.1 | -3.0 | -1.5 | 0.8 | 0.8 | 1.2 | 4.2 | 5.4 | 6.0 |
| Sugar and confectionery | 0.8 | 3.7 | 5.0 | 7.1 | 7.8 | 8.8 | 8.2 | 9.4 | 11.0 | 7.5 |
| Vegetable oil and other fats | -2.9 | -2.3 | -1.8 | -1.4 | -1.0 | -1.1 | -1.4 | -1.1 | -0.7 | -0.9 |
Source: Calculated according to Rosstat data (2021)
In general, actual consumption exceeds rational norms in the Russian Federation for most types of food. The exception is meat and meat products, milk and dairy products, vegetables, fruits, and berries. Russians consume more than the norm for other types of food (Table 8).
Table 7. Shortage of funds for the purchase of basic foodstuffs by decile groups per year, rub
| First | Second | Third | Fourth | Fifth | Sixth | Seventh | Eighth | Ninth | Tenth | |
| Bread and bread products | -600.20 | -404.28 | -231.58 | 0.00 | 0.00 | 0.00 | -83.53 | 0.00 | 0.00 | -318.65 |
| Potato | -1,156.38 | -1,057.39 | -961.16 | -866.69 | -875.70 | -920.85 | -919.89 | -840.66 | -851.24 | -890.04 |
| Vegetables and melons | -1,901.02 | -1,509.81 | -1,306.03 | -1,051.86 | -952.93 | -819.26 | -715.21 | -598.40 | -382.81 | -368.55 |
| Fruits and berries | -6,061.67 | -4,880.28 | -4,009.45 | -3,399.36 | -2,869.49 | -2,229.44 | -1,811.35 | -832.15 | -290.70 | 0.00 |
| Meat and meat products | -5,107.63 | -357.43 | 0.00 | 0.00 | 0.00 | 0.00 | 0.00 | 0.00 | 0.00 | 0.00 |
| Milk and dairy products | -9,010.71 | -6,895.65 | -5,479.98 | -4,200.27 | -2,077.33 | -3,135.48 | -2,568.67 | -1,212.20 | -458.54 | -44.07 |
| Eggs, pcs. | -661.99 | -476.31 | -365.55 | -280.23 | -197.73 | -174.99 | -155.87 | -14.98 | 0.00 | 0.00 |
| Fish and fish products | -1,487.39 | -916.08 | -545.78 | -270.53 | 0.00 | 0.00 | 0.00 | 0.00 | 0.00 | 0.00 |
| Sugar and confectionery | 0.00 | 0.00 | 0.00 | 0.00 | 0.00 | 0.00 | 0.00 | 0.00 | 0.00 | 375.92 |
| Vegetable oil and other fats | -358.83 | -282.11 | -218.77 | -169.67 | -123.57 | -140.81 | -177.04 | -134.06 | -81.21 | -117.19 |
| Shortage of funds for the purchase of basic foodstuffs, rubles per year | 26,345.81 | 16,779.34 | 13,118.30 | 10,237.61 | 7,096.74 | 7,420.83 | 6,431.56 | 3,632.45 | 2,064.51 | 1,362.58 |
Source: Calculated according to Rosstat data (2021)
It was necessary to pay attention to the increase in the production of livestock products, as well as vegetables, fruits, and berries. Based on the above analytical material, the Russian Federation produces poultry meat and pig meat in sufficient volume, and it approaches rational consumption standards in terms of the production of cattle meat (Kolesnikov et al., 2017).
Milk production was of concern. When consuming 325 kg per year according to rational consumption standards, it is necessary to produce at least 47.7 million tons of milk instead of 32.2 (Table 9). The shortage of food consumption is distributed unevenly across the federal districts of the Russian Federation, which is largely due to different natural and climatic conditions for the production of crops. Based on production and consumption, the deficit of livestock products in federal districts is calculated (Ushachev et al 2019).
Table 8. Consumption of basic foodstuffs per capita, kg
| Meat and meat products (without by-products of second category and raw fat) | Milk and dairy products | Eggs and egg products | Sugar and confectionery | Vegetable oil | Potato | Vegetables and food melons | Fruits and berries | Bread products | ||
| Rational norms | ||||||||||
| 73 | 325 | 260 | 24 | 12 | 90 | 140 | 100 | 96 | ||
| WHO nutrition standards | ||||||||||
| 78 | 405 | 291 | 47 | 9.1 | 117 | 139 | 146-219 | 117 | ||
| Actual consumption | ||||||||||
| RF | 70 | 234 | 285 | 39 | 14.0 | 89 | 108 | 62 | 116 | |
| CFD | 78 | 219 | 289 | 43 | 15.4 | 88 | 102 | 61 | 117 | |
| NWFD | 72 | 262 | 298 | 39 | 11.9 | 75 | 94 | 62 | 99 | |
| SFD | 67 | 218 | 308 | 42 | 14.7 | 77 | 143 | 77 | 121 | |
| NCFD | 58 | 239 | 230 | 42 | 13.6 | 89 | 171 | 66 | 124 | |
| PFD | 65 | 267 | 288 | 37 | 14.8 | 98 | 99 | 58 | 114 | |
| UFD | 66 | 206 | 295 | 37 | 13.4 | 92 | 93 | 66 | 118 | |
| SFD | 66 | 238 | 278 | 34 | 11.8 | 93 | 92 | 50 | 122 | |
| FEDD | 72 | 199 | 254 | 35 | 12.1 | 94 | 95 | 62 | 114 | |
Source: Compiled by the author according to Rosstat (2021)
Table 9. Production and consumption of livestock products, thousand tons
| Population, million people | Production, 2020. | Consumption according to rational norms | |||||||
| Pig meat, thousand tons | Poultry meat, thousand. | Cattle meat, thousand tons. | Milk, thousand tons | Pig meat, thousand tons | Poultry meat, thousand. | Cattle meat, thousand tons. | Milk, thousand tons | ||
| RF | 146.7 | 4,281.6 | 5,016.3 | 1,633.7 | 32,225.5 | 2,640.6 | 4,547.7 | 2,934 | 47,677.5 |
| CFD | 39.4 | 2,209.1 | 1,857.7 | 318.2 | 6,253.9 | 709.2 | 1,221.4 | 788 | 12,805 |
| NWFD | 14.0 | 358.9 | 407.3 | 49.3 | 2,000.8 | 252 | 434 | 280 | 4550 |
| SFD | 16.5 | 249.8 | 393.1 | 262.7 | 3,774 | 297 | 511.5 | 330 | 5,362.5 |
| NCFD | 9.9 | 64.7 | 433.3 | 154.9 | 2,743.9 | 178.2 | 306.9 | 198 | 3,217.5 |
| PFD | 29.3 | 699.6 | 1,144.9 | 459.4 | 9,987.6 | 527.4 | 908.3 | 586 | 9,522.5 |
| UFD | 12.4 | 250 | 378.6 | 83.4 | 1,998.3 | 223.2 | 384.4 | 248 | 4,030 |
| SFD | 17.1 | 379.4 | 366.1 | 228.6 | 4,493.3 | 307.8 | 530.1 | 342 | 5,557.5 |
| FEDD | 8.2 | 70.1 | 35.2 | 77.2 | 973.6 | 147.6 | 254.2 | 164 | 2,665 |
Source: Calculated according to Rosstat data (2021)
Additional volumes of grain production have been calculated. In general, in the Russian Federation – 7.7 million tons, including CFD – 3.2 million tons, NWFD – 1.3 million tons, UFD – 1.0 million tons, FEDD – 1.1 million tons. It was necessary to additionally use about 2.7 million hectares of grain and leguminous crops for the production of these volumes of grain. Moreover, it was additionally necessary to use the areas under perennial grasses and forage crops. The calculations made assume taking into account the rational norms of consumption of the main types of meat and milk, without the possibility of exceeding them (Table 10) (Ushachev et al 2019).
Table 10. Shortage of livestock products and the necessary acreage for the production of grain crops
| Pig meat, thousand tons | Poultry meat, thousand | The meat of cattle, thousand | Milk, thousand tons | Additional grain production, thousand | The yield of grain and leguminous crops, c/ha | Additional acreage, thousand hectares | |
| RF | – | – | -1,300.3 | -15,452.00 | 7,717.11 | 28.6 | -2,698.29 |
| CFD | – | – | -469.8 | -6,551.10 | 3,204.56 | 44.7 | -716.904 |
| NWFD | – | -26.70 | -230.7 | -2,549.20 | 1,303.69 | 38.2 | -341.28 |
| SFD | -47.20 | -118.40 | -67.3 | -1,588.50 | 918.915 | 35.1 | -261.799 |
| NCFD | -113.50 | – | -43.1 | -473.60 | 489.478 | 30.2 | -162.079 |
| PFD | – | – | -126.6 | 104.45 | 24.6 | -42.4593 | |
| UFD | – | -5.80 | -164.6 | -2,031.70 | 1,013.17 | 13.8 | -734.182 |
| SFD | – | -164.00 | -113.4 | -1,064.20 | 656.796 | 17.1 | -384.091 |
| FEDD | -77.50 | -219.00 | -86.8 | -1,691.40 | 1,110.86 | 21.9 | -507.243 |
Source: Calculated according to Rosstat data (2021)
In addition to the shortage of meat and milk, the population of Russia was experiencing a lack of consumption of vegetables, fruits, and berries. All federal districts, except for the Southern Federal District, the North Caucasian Federal District, and the Privolzhsky Federal District, were experiencing a deficit in melons and gourds. There was no shortage in the production of vegetables, grapes, and stone crops in the Southern Federal District and the North Caucasus Federal District. For the production of seed crops, there is no shortage only in the North Caucasus Federal District (Table 11, 12).
To meet the internal needs of the population for food according to rational norms at the national level, in all variants of the forecast, the production of pig and poultry meat can be left at the current level. Therewith, the demand for pig meat is 2.4-2.7 million tons, and for poultry meat 4.2-4.7 million tons. (Table 13). The production of cattle meat should be increased from 1.6 to 2.7-3.0 million tons. The production of melon food crops should also be increased from 1.5 million tons to 2.0-2.2 million tons (Kolesnikov 2019).
Table 11. Production and consumption of vegetables, fruits, and berries, thousand tons
| Melon food crops | Vegetables of open and protected ground | Grape plantations | Drupaceous (plum, cherry, sweet cherry, apricot, peach, and other stone fruits) | Pomaceous (apple, pear, quince, etc.) | Berry plantation (wild strawberries, strawberries, raspberries, currants, gooseberries, and other berries) | |
| Production | ||||||
| RF | 15,843.1 | 138,639.66 | 6,819.08 | 6,017.49 | 23,416.49 | 6,952.61 |
| CFD | 340.6 | 25,512.78 | 56.5 | 861.78 | 4,812.73 | 1,524.8 |
| NWFD | 0.14 | 5,135.96 | 7.61 | 176.38 | 790.87 | 477.52 |
| SFD | 6,871.97 | 40,717.93 | 3,703.48 | 1,673.17 | 5,911.17 | 1,123.08 |
| NCFD | 2,264.8 | 22,671.26 | 2,844.47 | 1,360.72 | 6,969.18 | 188.14 |
| PFD | 6,119.97 | 26,427.58 | 176.41 | 1,386.73 | 3,813.29 | 1,993.69 |
| UFD | 24.3 | 5,668.54 | 11.63 | 251.94 | 625.38 | 674.56 |
| SFD | 116.39 | 9,247.23 | 6.7 | 238.13 | 432.46 | 736.18 |
| FEDD | 104.94 | 3,258.38 | 12.29 | 68.63 | 61.41 | 234.63 |
| Consumption | ||||||
| RF | 22,005 | 183,375 | 8,802 | 11,736 | 85,086 | 10,269 |
| CFD | 5,910 | 49,250 | 2,364 | 3,152 | 22,852 | 2,758 |
| NWFD | 2,100 | 17,500 | 840 | 1,120 | 8,120 | 980 |
| SFD | 2,475 | 20,625 | 990 | 1,320 | 9,570 | 1,155 |
| NCFD | 1,485 | 12,375 | 594 | 792 | 5,742 | 693 |
| PFD | 4,395 | 36,625 | 1,758 | 2,344 | 16,994 | 2,051 |
| UFD | 1,860 | 15,500 | 744 | 992 | 7,192 | 868 |
| SFD | 2,565 | 21,375 | 1,026 | 1,368 | 9,918 | 1,197 |
| FEDD | 1,230 | 10,250 | 492 | 656 | 4,756 | 574 |
Source: Calculated according to Rosstat data (2021)
Table 12. Deficit of production of vegetables, fruits, and berries, thousand tons
| Melon food crops | Vegetables of open and protected ground | Grape plantations | Drupaceous (plum, cherry, sweet cherry, apricot, peach, and other stone fruits) | Pomaceous (apple, pear, quince, etc.) | Berry plantation (wild strawberries, strawberries, raspberries, currants, gooseberries, and other berries) | |
| RF | -6,161.90 | -44,735.34 | -1,982.92 | -5,718.51 | -61,669.51 | -3,316.39 |
| CFD | -5,569.40 | -23,737.22 | -2,307.50 | -2,290.22 | -18,039.27 | -1,233.20 |
| NWFD | -2,099.86 | -12,364.04 | -832.39 | -943.62 | -7,329.13 | -502.48 |
| SFD | 4,396.97 | 20,092.93 | 2,713.48 | 353.17 | -3,658.83 | -31.92 |
| NCFD | 779.80 | 10,296.26 | 2,250.47 | 568.72 | 1,227.18 | -504.86 |
| PFD | 1,724.97 | -10,197.42 | -1,581.59 | -957.27 | -13,180.71 | -57.31 |
| UFD | -1,835.70 | -9,831.46 | -732.37 | -740.06 | -6,566.62 | -193.44 |
| SFD | -2,448.61 | -12,127.77 | -1,019.30 | -1,129.87 | -9,485.54 | -460.82 |
| FEDD | -1,125.06 | -6,991.62 | -479.71 | -587.37 | -4,694.59 | -339.37 |
Source: Calculated according to Rosstat data (2021)
Table 13. Production of basic foodstuffs for domestic consumption by the population in the Russian Federation in (2036)
| Recommended rational rate of food consumption, kg | Production volumes, million tons, billion pcs. | It is necessary to produce currently, million tons, billion pieces. | It is necessary to produce in 2036 (option), million tons, billion pieces. | |||
| High 150.1 | Average 143.0 | Low 134.3 | ||||
| Pig meat | 18 | 4.3 | 2.6 | 2.7 | 2.5 | 2.4 |
| Poultry meat | 31 | 5.0 | 4.6 | 4.7 | 4.5 | 4.2 |
| Cattle meat | 20 | 1.6 | 2.9 | 3.0 | 2.8 | 2.7 |
| Milk | 325 | 32.2 | 47.7 | 48.7 | 46.3 | 43.9 |
| Eggs and egg products | 260 | 45.1 | 38.0 | 39.0 | 37.2 | 34.9 |
| Sugar | 24 | 7.3 | 3.5 | 3.6 | 3.4 | 3.2 |
| Vegetable oil | 12 | 4.6[1] | 1.7 | 1.8 | 1.7 | 1.6 |
| Potato | 90 | 19.6 | 13.1 | 13.5 | 12.9 | 12.1 |
| Melon food crops | 15 | 1.5 | 2.2 | 2.2 | 2.1 | 2.0 |
| Vegetables of open and protected ground | 125 | 13.9 | 18.3 | 18.7 | 17.8 | 16.8 |
| Grape | 6 | 0.7 | 0.9 | 0.9 | 0.9 | 0.8 |
| Drupaceous | 8 | 0.6 | 1.2 | 1.2 | 1.2 | 1.1 |
| Pomaceous | 58 | 2.3 | 8.5 | 8.7 | 8.3 | 7.8 |
| Berries | 7 | 0.7 | 1.0 | 1.0 | 1.0 | 0.9 |
| Bread products | 96 | 7.4[2] | 14.0 | 14.4 | 13.7 | 12.9 |
| Grain for domestic consumption | – | 78.5 | 86.2 | 87.9 | 83.6 | 79.3 |
In the future, vegetable growing of protected and open ground will require close attention. The population of the Russian Federation is experiencing a significant shortage in vegetable production, so the production of vegetables on the open and protected ground needs to be increased from 13.9 to 16.8-18.7 million tons. It will also require a slight increase in the production of grapes and stonecrops, reserves for the placement of which are available in the North Caucasus Federal District and the Southern Federal District. It will also require an increase in the production of seed crops from 8.5 to 8.7 million tons (Ushachev et al 2019).
In addition, bringing the volume of meat and milk production will contribute to an increase in domestic grain consumption from 78.5 million tons to 79.3-87.9 million tons. Such an increase can be compensated either by the growth of grain production without a decrease in export volumes or without a significant increase in production volumes due to a decrease in export volumes. Increasing the volume of production of basic types of food is necessary to form 100% of the economic availability of food to the population of the Russian Federation (Ushachev et al. 2019).
CONCLUSION
The findings of the present study suggests that the development of agriculture is characterized by significant, but insufficient success in solving the problem of ensuring food security, therefore, the further development of agricultural production will require significant efforts and state support related to the development of agricultural production in the following areas: increasing the use of domestic scientific and technological potential; an increase in state support for the production of basic foodstuffs; the growth in the volume of exports of agricultural products of high processing; development of rural territories from the standpoint of social and engineering infrastructure, creation of favorable conditions for life in rural areas; stimulating an increase in wages in agricultural organizations in proportion to the growth of labor productivity; the introduction of digital technologies.
REFERENCES
Altukhov, AI, Drokin, VV and Zhuravlev, AS (2015). Food security and import substitution are the main strategic objectives of modern agricultural policy Economy of Regions No 3 Pages 256-266.
Kolesnikov, AV (2019). Assessment of the purchasing power of the population AIC: economics, management No 9 Pages 73-84.
Kolesnikov, AV, Akupiyan, OS and Andreeva, IG (2017). Food security: questions of theory and practice Belgorod State University Scientific Bulletin Vol 23(272) No 14 Pages 61-74.
Rosstat (2021). Indicators characterizing import substitution in Russia Available: https://rosstat.gov.ru/folder/11188 (accessed 30.08.2021)
Ushachev, IG, Serkov, AF, Maslova, VV, et al. (2019). Actual directions of improving the agrarian policy of Russia AIC: economics, management No 3 Pages 4-16.

