1Department of Electronics and Communication Engineering,
2Department of Computer Science and Engineering,
1, 2 Sathyabama Institute of Science and Technology. Chennai, India.
Corresponding author email: srilatha169@gmail.com
Article Publishing History
Received: 12/06/2019
Accepted After Revision: 16/09/2019
Ovarian tumour is the most widely recognized reason for death among gynecological malignancies. There are various sorts of clinical and nonclinical highlights that are utilized to examine and break down the contrasts among kindhearted and dangerous ovarian tumors. Computer Aided Diagnosis (CAD) frameworks of high precision are being created as an underlying test for ovarian tumor order rather than biopsy, which is the present highest quality level indicative test. The system uses the K-means clustering for segmentation and the classification methodology is done by the KSVM (Kernel Support Vector Machine) and PSO (Particle Swarm Optimization) classification approach. This automatic framework consists of four steps: preprocessing, segmentation, feature extraction and feature selection, classification, finally, the parameter values of the KSVM (Kernel Support Vector Machine) classifier are dynamically optimized using the PSO (Particle Swarm Optimization) optimization algorithm. It is a bio-inspired optimization algorithm, and PSO optimizers to get the best out of the classification accuracy. An efficient ovarian tumour segmentation, feature extraction and selection by using PSO and classification is offered in this work by combining different Kernel SVM Classifier which provides accurately identify and classify the ovarian tumor in MR image.
Ovarian Tumor detection, Magnetic Resonance Imaging (MRI), PSO (Particle Swarm Optimization) optimizer, KSVM (Kernel Support Vector Machine).
Srilatha K, Ulagamuthalvi V. Support Vector Machine and Particle Swarm Optimization Based Classification of Ovarian Tumour. Biosc.Biotech.Res.Comm. 2019;12(3).
Srilatha K, Ulagamuthalvi V. Support Vector Machine and Particle Swarm Optimization Based Classification of Ovarian Tumour. Biosc.Biotech.Res.Comm. 2019;12(3). Available from: https://bit.ly/2KXzogt
Copyright © Srilatha and Ulagamuthalvi, This is an open access article distributed under the terms of the Creative Commons Attribution License (CC-BY) https://creativecommns.org/licenses/by/4.0/, which permits unrestricted use distribution and reproduction in any medium, provide the original author and source are credited.
Introduction
Cancer is made up of irregular cells that grow although body does not want them. When cancer cells is in the body change and grow out of control. In mostly tumours, the abnormal cells mature to form a mass. If cancer cells grows in the body long enough and also nearby areas. They extent to other parts of the body or metastasis. Ovarian tumour is very dangerous killer for women which are not specific sign indications of cancer and typically it identify in the last stage. All the cases are being diagnosed at final stage because of poor identification practices (Pathak, 2015). In the ovarian tumour mass prediction plays key role, it can be diagnosed from the ultrasound image that tumour mass is benign lesion or malignant lesion or metastatic. The MR image in medical application and other several fields is enormous. It has a number of benefits medical imaging modalities over other. There are different mode of inputs are obtainable for diagnostics like Computed Tomography, Ultrasound imaging, Magnetic Resonance Imaging, Positron Emission Tomography. From all this input methods the proposed system are focused on ultrasound imaging for the reason that it has some advantages like it is noninvasive, competency of forming real time images, accurate, portable and not hurtful to human being (Acharya 2013). Ovarian malignancy is a striking general well being concern, which, disregarding its rare rate, remains the deadliest type of gynecological harm. As indicated by the WHO, every year an evaluated aggregate of two lakh and fifty thousand instances of ovarian malignant growth will be analyzed and a lakh and fifty thousand patients will capitulate to this sickness, speaking to the seventh most basic type of malignant growth and the eighth driving reason for disease related demise among ladies overall at all (Michael-Antony Lisio, 2019). So, in this proposed system have used medical images which are low cost in nature and easily accessible.
Methods and Materials
In this proposed method, the process has taken in test part and training part as shown in Fig.1.Improvement of an efficient diagnosing the Ovarian cancer in the good time may help surgeons. MatLab has used to develop the proposed method. The input image or data to the proposed system is an MR Ovarian image. This system consists of four stages namely i) Pre-processing ii) Segmentation iii) Feature Extraction and Feature Selection using Particle swarm optimization (PSO) and vi) Kernel SVM classification (Quadratic SVM kernel, Linear SVM Kernel, Polygonal SVM Kernel, Radial basis function (RBF) SVM kernel).The input MR Ovarian image is preprocessed in both the test and training parts. Preprocessing is executed to boost the image value for further processing. For all that purpose, the first stage taken is removal of noise. Noise is removed by using adaptive median filtering method to remove the noise element and increase the image intensity. The next stage going on in preprocessing step is normalizing the background (Galdames, 2012). This has been completed by a threshold based edge detection with canny technique. The following stage is segmentation. Now, a novel K means clustering algorithm is proposed to segment the tumor (RajKumar, 2013).
Different label formation is acquired from the clustered output. After the labeled output, region of interest (ROI) which tumor part is segmented. Since the ovarian tumor segmented outputs, the features are taken out (Islam, 2013) by using texture extraction technique named by way of gray level co-occurrence matrix (GLCM) method. Up to now, all the procedure would be common for both the part such as training and testing part. The extracted features gray level co-occurrence matrix (GLCM) will be made as training feature matrix and keep back as feature vectors in the training part. In this proposed system shown in Figure.1, the Ovarian MRI have taken to assess the upgrading of the proposed method. The datasets are consisted of 50 Ovarian MRI images, out of which 87% of the MR ovarian images are used for training part, and the whole thing of the 50 images are used for testing part. To pick the greatest feature vector or feature selection from the trained feature matrix an optimization technique known as Particle swarm optimization (PSO) is proposed. This will increase the performance of classification. In the testing part, all complete processes such as preprocessing, clustering, and segmentation are brought about as same as the training part by proposed method. After, the segmented output, it is needed for the classifier to detect the Ovarian MRI as normal or abnormal. As a result of this Kernel SVM classification, the classification performance is enriched.
Pre-processing of Ovarian MRI
Ovarian MRIs are corrupted through the process of imaging because of image communication and image digitization by noise. However, there are lots of filters which have used for filtering the images, more or less of them corrupt the miniature information of the image and nearly conventional filters will process the image smoothing and therefore, toughen the edges of the image (Pan, M.S, Tang, J.T, Yang, X.L, 2011).
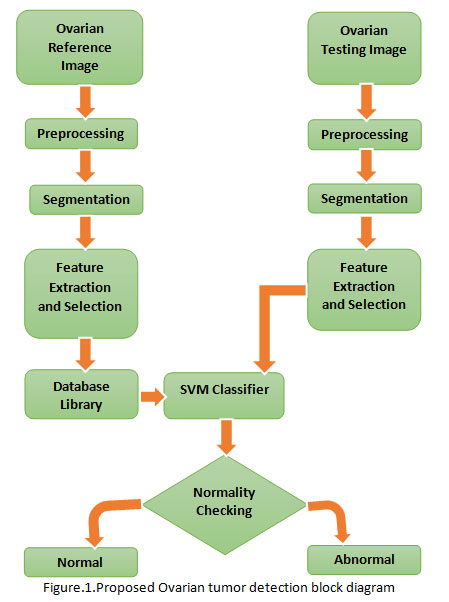 |
Figure 1: Proposed Ovarian tumor detection block diagram |
From now, the proposed pre-processing stages namely De-noising image computed with the equ. (1). Where, Let Wxy signifies the set of coordinates in a rectangular sub image window of size k × l centered at point (x,y). The second step in preprocessing is to eliminate normalize the background at the preprocessing phase itself, meanwhile it may upset the segmentation outcome. At this time, canny edge detection method is used to identify edge from MRI ovarian equ. (2).
f(x,y)=Median {gr(u,v)} (u,v)ϵ Wx,y (1)
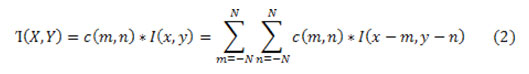
where c (m,n)-Convolution kernel, I(x, y) – Original image, ’I'(X,Y) – Filtered image,2N +1- convolution kernel size.
Segmentation
When the image is preprocessed by filtering, the noise is removed. This will be often beneficial to extract the pixels which are related. The maximum area of linked pixel is called connected component which are partition the image into segments (Ulagamuthalvi .V, 2017).
The number of clusters k with principal cluster centroid was selected ri=1,2,.m. Separation of the input data points into k clusters with assigning each statistic point Qj to the neighboring cluster centroid ri using the designated distance measure,
![]()
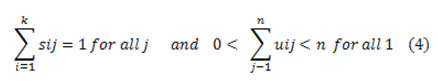
where Q = {q1, q2, . . .qn} is the input data. Govern a cluster assignment matrix Si representing the separation of the data with the Binary bias value of the jth data to the ith cluster as it were S = |sij|, where sij in {0,1}for all i, j
Recomputed the centroid using the association values by
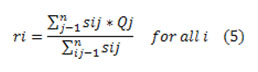
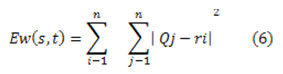
Separation of the input data points into k clusters with assigning every one data point xj to the neighboring cluster centroid ri using the designated distance measure and The k-means clustering technique optimizes function Ew (s, t) then
Feature Extraction
The transformation of an image into its set of features is registered by feature extraction. It is very challenging to train the classifier with all the feature extracted MR image. Hereafter it is essential to select the appropriate features from the feature extracted MR image. Numerous methods have proposed for feature extraction, feature based on wavelet transform, Gabor features, principal component analysis (PCA), minimum noise fraction transform, decision boundary feature extraction, discriminant analysis and nonparametric weighted feature Y. Zhang et al [16]. Here the texture features are analyzed by using gray level co-occurrence matrix (GLCM) procedure.
The co-occurrence matrix P (i, j | t, d) compute the co-occurrence of pixels with grey values i and j at a confident distance t and in a confident direction d. Constructed on the number of strong suit pixels in all variation, The gray level co-occurrence matrix (GLCM) technique is a method of eliminating second order values constancy elements. However, the performance of a certain GLCM built on aspect, on upper of the location the constancy features; based on the quantity of gray levels applied. The following representations are: μ be the mean of P. μx, μy, σx and σy had the means and standard deviations of Px and Py. G has the co-occurrence matrix size. Now the amount of columns and rows of co-occurrence matrix is identical. The following GLCM features are detached in research work: Mean, Standard Deviation, entropy, Variance, Skewness, Kurtosis, Inverse distinction moment (IDM), Contrast, Correlation, Energy, homogeneity. Let i and j are the coefficients of GLCM, M i, j is the element in the GLCM at the coordinates i and j and N is the dimension of the GLCM.
Particle swarm optimization (PSO)
In the feature extraction phase, numbers of more texture patterns are takeout which leads to computations requisite for classification is improved. Hereafter it is essential to choose the features that are fit for classification.Particle Swarm Optimization (PSO) is a recent swarm intelligent algorithm after GA and Ant Colony Algorithm. It has been a significant part of transformative calculation, generally utilized in neural system preparing, non-direct programming, multi-target enhancement and other areas. For the PSO, every particle has its individual position and speed, and there is wellness esteem which choice by the wellness work. PSO calculation utilizes the speed position model.There are N-measurement search space, M particles, the particle position is Yi = {Yi1 , Yi2 ,…….Yin} ,speed is Vi , we change the present speed and position as follows: ω – idleness weight, w1, w2 – increasing speed factor, r1, r2 -irregular number somewhere in the range of 0 and 1.
Vi(t+1)=ωVi(t0+w1r1*Pibest(t)-Yi(t)+w2r2*(Pgbest(t)-Yi(t) (7)
Yi(t+1)=Yi(t)+Vi(t+1) (8)
From the capacity and we can see that the particles can pass judgment on the flight speed and position without anyone else’s input understanding, then they additionally affected by social. Searching for the harmony among character and social may locate the better arrangement, improve the inquiry execution.The presentation of dormancy factor ω is to adjust the worldwide and neighborhood search capacity, huge idleness weight because solid worldwide hunt capacity. c1 c2 alter the progression σ, when molecule fly to the worldwide best particles and individual best particles. Excessively little, the molecule might be far from the objective zone; Too huge, the particle will all of a sudden traveled to the objective region, over the ideal arrangement. At present, there is no particular criteria lead us how to pick the dormancy weight and increasing speed. Individuals regularly utilize the experience esteem, c1=c2=2, w=0.923.CLERC concluded that c1=c2=2.05 and a few scientists think about that c1=c2 ought to have various qualities.
Particle Swarm Algorithm
Training set = {initial training samples};
Arbitrarily generate number of candidate discriminatory patterns Pi ;
Find the pattern to the search grid in the order of the generation;
Generate number of particle agents randomly uniformly in the search grid, where each particle agent is located in one grid.
WHILE ( iteration < Max no of iteration)
/** Use PCO algorithm to credit the pheromone to the pattern and attributes **/
FOR j = 1 to (no of contestant patterns)
Update the pheromone of the pattern designated by the particle agents; or else, reduction the pheromone in
the pattern;
FOR k = 1 to no of features in each pattern
Update the pheromone of all feature trails by accumulative pheromone in the trails followed by agent_i (proportionate to the fitness value) and reducing pheromone in the other trails
END FOR_LOOP(k)
END FOR_LOOP(j)
/** Use the enhanced PSO algorithm to modify the movement of the particle agent in this iteration. */
FOR l = 1 to (no of particle agents)
Update the pattern and feature pheromones using equation (7) and (8).
IF pattern fitness value of present position < their neighbors’ pattern fitness significance
Move to the neighbor’s pattern;
IF the fitness value of the feature(s) in the previous position is (or are) greater than the novel position
Substitute those lower fitness features with the higher fitness feature from previous position;
ELSE
Leave of absence the features of the novel pattern as it is.
ELSE
Stopover in the existing pattern position;
END FOR_LOOP (l)
END WHILE
Classification
Support vector machine (SVM) classifier is a powerful and clear-cut learning technique. It is categorized into two types: linear SVM and non-linear vector SVM. In Linear SVMs, training points have support vectors which describe the hyper-plane. In Non-linear SVMs, arranged a splitting hyper-plane in the typical space and classify peaks in that space. The kernel plays the important role on dot invention in the feature selection (Zhang, 2012). It has great speculation properties. It can be effectively prepared, and performs well on nonlinear data. It performs well with numerous highlights and furthermore with less number of preparing tests. It searches for the hyperplane as a choice surface which isolates the 2 classes with greatest edge. Subsequently, the isolating hyperplane will be situated opposite to the briefest line isolating the raised bodies of the preparation highlights for each class, and it will be found halfway along this line. So as to group the nonlinear information, portions can be used to outline input information to a high-dimensional space. Polynomial kernel, Linear kernel of order 1, 2, and 3, and the RBF portion are generally utilized.
Kernel SVM classifier (Quadratic SVM kernel, Linear SVM Kernel, Polygonal SVM Kernel, Radial basis function (RBF) SVM kernel) gets the input from the features extracted via the Gray Level Co-occurrence Matrix technique. In this work, normal and ovarian image is chosen. SVM classification is used for classification the image into abnormal and normal in which subject is denoted through vectors (C. Cortes and V. Vapnik, 1995).
Linear Kernel SVM classifier contains in defining the function.
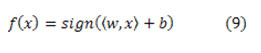
The kernel is a function which simulates the prediction of the initial data in a feature vector using higher dimension Φ: Κn → S. In this new space the data are measured as linearly separable. To put on this, the dot product 〈xi,xj〉 is substituted by the function:
![]()
Then and there the new function used to classify the data equation (11)
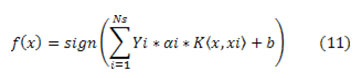
Kernels are generally used equ (12) and (13)
Polynomial kernel: (,)=(〈x.〉+1)*P (12)
RBF kernel: (,)= −|−|2/22 (13)
Results and Discussion
One instance of intense ovarian malignancy and benign tumor was collected. Non-enhanced and Noisy Ovarian tumor Magnetic Resonance Image (512×512) are used in the detection of all data of malignant and benign shown in Figure.2.(a). The MR ovarian image in original form by a tumor and various operations of proposed algorithm is shown in Fig.2. Four phases were there in the proposed method. A First step involves of suppression of noise using by median filtering which increase the efficiency of the image shown in Figure.2.(c). The second step, normalized by global thresholding technique shown in Fig.2.(b). In, the third step k-means clustering procedure used to extract the tumor region shown in Figure.2.(e). In, the fourth step gray level co-occurrence matrix (GLCM) used to extract thirteen texture for ovarian. Therefore, the resulting features in the Kernel SVM classifier are trained, that automatically check whether the MR Ovarian image is normal or abnormal (Malignant, Benign) shown in Figure.2.(f). Four classifiers namely Quadratic SVM kernel, Linear SVM Kernel, Polygonal SVM Kernel, Radial basis function (RBF) SVM kernel have been developed to classify normal and abnormal ovarian. The spatial area based surface highlights GLCM are taken out from Ovarian MRI and are put away as highlight spaces. These element spaces are given to contribution of preparing the Kernel SVM. The classifier exactness is improved because of the streamlining of highlights choice utilizing PSO in which figuring the new position of each particle is registering clearly from the blend of its particular best position and the global most prominent position. The PSO figuring beats all of the estimations under scrutiny on various benchmark limits. It is for the most part propelled the accuracy in location of ovarian tumor and request of ovarian generous and threatening development.
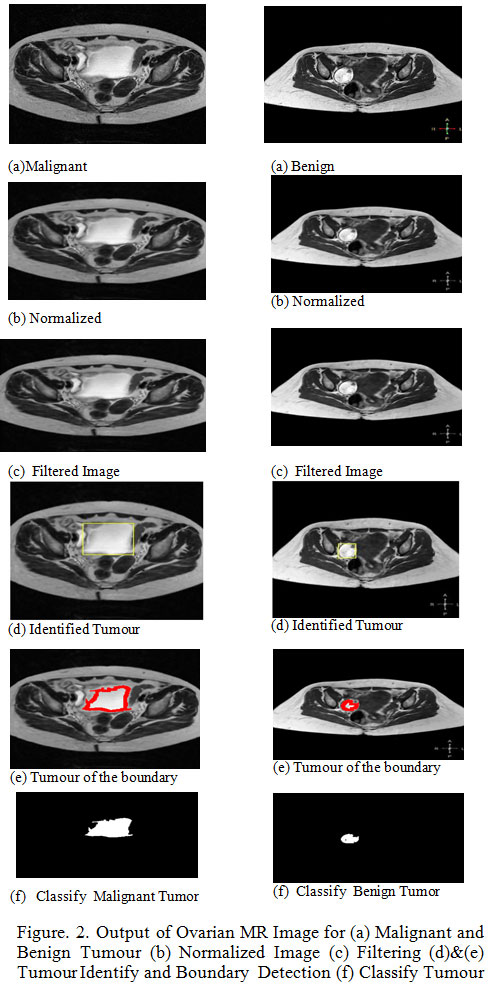 |
Figure 2: Output of Ovarian MR Image for (a) Malignant and Benign Tumour (b) Normalized Image (c) Filtering (d)&(e) Tumour Identify and Boundary Detection (f) Classify Tumour |
Conclusion
Automatic computer aided detection system helps in detecting ovarian cancer has been developed in proposed system. This system aids to surgeon to identify malignant, benign on Ovarian MRI images and diagnosis accurate computable results. An efficient ovarian tumor segmentation, feature extraction and selection by using PSO and classification is proposed in this work by combining different Kernel SVM Classifier. The preprocessing of ovarian MRI gives encouraging outcomes. The spatial domain based texture features GLCM are taken out from Ovarian MRI and are stored as feature spaces. These feature spaces are provided to input of training the Kernel SVM. The classifier accuracy is enhanced due to the optimization of features selection using PSO in which calculation the new position of every particle is computing straightforwardly from the mix of its specific best position and the global greatest position. The PSO calculation beats every one of the calculations under investigation on numerous benchmark capacities. It generally helped to advance the precision in location and order of ovarian benign and malignant growth.
References
Acharya UR , F Molinari, SV Sree, G Swapna, L Saba, S Guerriero, JS Suri, (2015), Ovarian tissue characterization in ultrasound: a review, Technology in cancer research & treatment Vol.14(3) 251–261.
Acharya UR, Sree SV, Saba L, Molinari F, Guerriero S, Suri JS, (2013), Ovarian tumor characterization and classification using ultrasound-a new online paradigm. J Digit Imaging. 26(3) pp-544-553.
Cortes C and V. Vapnik, (1995), Support-vector networks,” Machine Learning, vol. 20, no. 3, pp. 273–297.
Galdames, F.J.; Jaillet, F.; Perez, C.A., (2012) An accurate skull stripping method based on simplex meshes and histogram analysis for magnetic resonance images. J. Neurosci. Methods 206, 103–119.
Haralick, R.M.; Shanmugan, K.; Dinstein, L., (1973) Textural features for image classification. IEEE Trans. Syst. Man Cybern. Vol.3,pp- 610–621.
Huang, M.; Yang,W, Wu, Y.; Jiang, J., Chen,W., Feng, Q, (2014), Brain tumor segmentation based on local independent projection-based classification. IEEE Trans. Biomed. Eng. 61, pp-2633–2645.
Islam, A.; Reza, S.M.; Iftekharuddin, K.M., (2013), Multifractal texture estimation for detection and segmentation of brain tumors. IEEE Trans. Biomed. Eng. 60, 3204–3215.
Kennedy,J R. Eberhart, (1995), PSO optimization, in: Proceeding of IEEE International Conference Neural Networks, vol. IV, pp. 1941–1948.
Khazendar S, Sayasneh A, Al-Assam H, Du H, Kaijser J, Ferrara L, Timmerman D, Jassim S,Bourne Tclose, (2015), Automated characterisation of ultrasound images of ovarian tumours: the diagnostic accuracy of a support vector machine and image processing with a local binary pattern operator., Facts, Views and Vision in ObGyn, Vol: 7, Pages: 7-15.
Kumar,R., R.S.; Niranjana, G.,(2013), Image segmentation and classification of MRI brain tumor based on cellular automata and neural networks. IJREAT Int. J. Res. Eng. Adv. Technol. 1(1), pp-1–7.
Materka, A., Strzelecki, M., (1998), Texture analysis methods—a review. Technical University of Lodz, Institute of Electronics. COST B11 report, Brussels.
Michael-Antony Lisio, Lili Fu, Alicia Goyeneche, Zu-hua Gao and Carlos Telleria,( 2019), High-Grade Serous Ovarian Cancer: Basic Sciences, Clinical and Therapeutic Standpoints” International Journal of Molecular Sciences, 20, 952.
Moradi, P and M. Gholampour,(2016), A hybrid particle swarm optimization for feature subset selection by integrating a novel local search strategy, Applied Soft Computing, Vol.43,pp- 117–130.
Pan, M.S.; Tang, J.-T.; Yang, X.-L., (2011), An adaptive median filter algorithm based on B-spline function. Int. J. Autom. Comput. 8(1), pp-92–99.
Pathak H, Vrushali Kulkarni, (2015), Identification of Ovarian mass through Ultrasound Images using Machine Learning Techniques. IEEE International conference on research computational intelligence and communication networks (ICRCICN),pp-137-140.
Reza Akbari, Koorush Ziarati, (2011), A rank based particle swarm optimization algorithm with dynamic adaptation. Journal of Computational and Applied Mathematics Vol.235 ,pp.2694–2714.
Tiwari, V., (2012), Face recognition based on cuckoo search algorithm. Indian J. Comput. Sci. Eng. (IJCSE) Vol.3(3), pp-401–405.
Ulagamuthalvi V., Kulanthaivel G., (2017), An novel approach for segmentation using brain images. International Conference on Control, Instrumentation, Communication and Computational Technologies (ICCICCT ),pp-234-238.IEEE.
Yanni Su, Yuanyuan Wang, Jing Jiao and Yi Guo, (2011), Automatic Detection and Classification of Breast Tumors in Ultrasonic Images Using Texture and Morphological Features The Open Medical Informatics Journal, 5, (Suppl 1-M3) pp-26-37.
Zhang Y and L. Wu, (2012) An MR brain images classifier via principal Component analysis and kernel support Vector machine Progress in Electromagnetics Research, Vol. 130, pp-369-388.
Zhang, H X. Song, and H.Wang,( (2007).) Feature gene selection based on binary particle swarm optimization and support vector machine, Computers and Applied Chemistry, vol. 24, no. 9,pp.1159–1162.

