1Department of Botany, The Maharaja Sayajirao University of Baroda, Vadodara, India
2Department of forest Genetics and Plant Physiology, Swedish University of Agricultural Sciences, Umea, Sweden
Corresponding author email: mehtadisha661@gmail.com
Article Publishing History
Received: 27/10/2020
Accepted After Revision: 17/12/2020
The study of biofilm formation has importance in a broad scale of industrial applications such as health and cosmetics products, food, water, paper mills, medical health and pharmaceuticals. Manual process for the optimization of different salts for growth of bacteria is labour intensive work and has low precision. In this study, we have used design expert software for biofilm yield optimization of a strain of Chroococcidiopsis cubana. C. cubana was exposed on outer surface of the monuments due to adverse environmental conditions and formed the blackish biofilm on it. This biofilm was grown in culture media and their DNA was extracted for strain confirmation. Strain was confirmed by 16s rRNA gene sequence using Sanger sequencing. The response surface method was used to optimize the concentration of two main components NaNO3 and K2HPO4 among various salts of BG 11 media. Response surface methodology (RSM) was studied by ANOVA coefficient estimation using F – test with very low probability value. The obtained goodness of fit was significant (R2 = 0.99). Estimation of coefficient was used for calculation of t and p – values and decided their significancy. The model having p value less than 0.05 was considered for optimization. Desirability of optimization was resolved from contour plot having concentration of NaNO3 = 13 and K2HPO4 = 6.50 for optimum biofilm yield. Using these parameters, the in vitro model of Chroococcidiopsis cubana resulted in a yield of 20 g/l biofilm in 10 days, hence can be successfully employed for in vitro cyanobacterial biofilm yield of Chroococcidiopsis cubana.
ANOVA, Endolithic Biofilm, Response Surface Method, 16s rRNA Gene Sequences
Mehta D, Sivan P, Shah D. Statistical in vitro Model for Upscaling Biofilm of Chroococcidiopsis cubana by Media Optimization and its Protocol for DNA Extraction. Biosc.Biotech.Res.Comm. 2020;13(4).
Mehta D, Sivan P, Shah D. Statistical in vitro Model for Upscaling Biofilm of Chroococcidiopsis cubana by Media Optimization and its Protocol for DNA Extraction. Biosc.Biotech.Res.Comm. 2020;13(4). Available from: <a href=”https://bit.ly/383rk9D”>https://bit.ly/383rk9D</a>
Copyright © Mehta et al., This is an Open Access Article distributed under the Terms of the Creative Commons Attribution License (CC-BY) https://creativecommons.org/licenses/by/4.0/, which permits unrestricted use distribution and reproduction in any medium, provide the original author and source are credited.
INTRODUCTION
Biofilm is defined as sessile microorganisms growing on solid surface and embedded in matrix of extracellular polymeric substances (Garrett et al., 2008). These microorganisms include several bacteria like Esherichia coli, Pseudomonas aeruginosa, Staphylococcus aureus etc as well as some blue green algae like Noctoc sp., Phormidium sp., Microspora sp., Chroococcidiopsis sp. etc (Hancock 2013; Ljaljevic-Grbic et al., 2010; Miller et al., 2009). Chroococcidiopsis sp., a blue-green alga, has desiccation tolerance due to the thick polysaccharide sheath on the outer surface of the cells (Knowles & Castenholz, 2008). In some species such sheaths have the ability to self-recognise the surfaces. Due to this, cells auto-aggregate mostly at the bottom of the broth culture flask. Hence, exopolysaccharides are also known as auto-agglutinins. This is the first stage in the whole process of biofilm formation (Trunk et al., 2018).
The study of biofilm formation has importance in a broad scale of industrial application such as health and cosmetics products, food, water, paper mills, medical health and pharmaceutical (Molobela & Ilunga, 2012). In vitro production of biofilm is a laborious and cumbersome task. Hence, it is necessary to optimise some components for enhanced biofilm yield through reliable and successfully working statistical tool like response surface methodology (RSM) (Bratchell, 1989; Lundstedt et al, 1998; Mirhosseini & Tan, 2009; Khuri & Mukhopadhyay, 2010). Growth rates and yield of the species dependent on the concentration level of NaNO3 and K2HPO4 (Rippka et al., 1988). In the present work, Chroococcidiopsis sp. was isolated from biofilm and obtained pure culture by streak plate method. Central composite design (CCD) of RSM has been applied to obtain the optimized concentration of two main salts components NaNO3 and K2HPO4 of BG 11 media for in vitro biofilm yield. DNA was extracted from biofilm and was amplified using 16s rRNA marker for strain confirmation.
MATERIAL AND METHODS
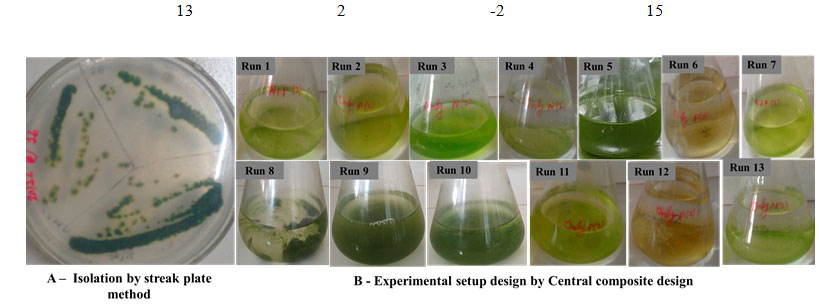
Isolation of Microorganism: Surface biofilm of the endolithic Chroococcidiopsis sp. was collected during post monsoon period from the dome of the Arts Faculty building (MSU campus) Vadodara, India (Fig. 1A). The biofilm was immersed in petri plate having sterile distilled water and kept for 24h. Clump of biofilm was segregated with the help of needle and isolated by streak plate method in agar (Rippka et al., 1988). Culture was maintained on agar plate and sub cultured every two weeks.
Growth medium : BG 11 medium as described by Rippka et al., (1988) having pH 7.2 was prepared as control. A 250 ml Erlenmeyer flask containing 100 ml of media was inoculated and incubated at 27 – 30 ⁰C temperature in 2500 Lux white light for 14h and 2h rotatory shaker at 100 RPM for 10 days. The biofilm was separated by centrifuging at 4000 RPM for 10 mins. Supernatant was discarded and yield of biofilm was measured. The same procedure was repeated for all the experimental flasks.
Experimental design for optimization : CCD was selected to optimize the concentration of NaNO3 and K2HPO4 for enhancing the yield of Chroococcidiopsis sp. The experiment was designed by the Design Expert 7.0.2 (stat-ease, USA). The range of the variables of NaNO3 and K2HPO4 were selected from preliminary study. The lowest and highest values of the variables have mentioned in table 1. Central composite design with 22 factorial gives 4 star points and axial points having 5 replicate at the centre as central point leading to 13 runs were engaged for the optimization of the concentration (Bradley, 2007). For statistical calculation, the variables were coded by equation 1:

xi is the dimensionless value of variable 1, x1 is real value of variable 1, x0 is centre point value of x1 and x is step change.
CCD is second order level design. In this design, the dependent variable gives information about interaction between factors in their relation to the dependent variable. 2nd order polynomial equation 2:
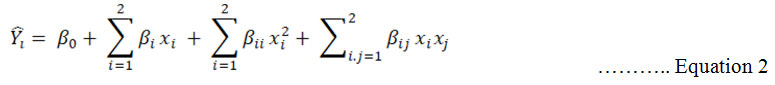
![]() denoted predicted response, xi and xj input variables, β0 intercept term, βi linear effect, βii squared effect and βij interaction term. Design expert software was performed for solving the regression equation and analysis of the response surface contour plot (Zheng et al., 2008).
denoted predicted response, xi and xj input variables, β0 intercept term, βi linear effect, βii squared effect and βij interaction term. Design expert software was performed for solving the regression equation and analysis of the response surface contour plot (Zheng et al., 2008).
Table 1. Range and Levels of variables
| Variables | Range and Levels | |||||
| -2 | -1 | 0 | 1 | 2 | ||
| X1 | K2HPO4 (g/l) | 5 | 7 | 9 | 11 | 13 |
| X2 | NaNO3 (g/l) | 10 | 13 | 16 | 19 | 22 |
Identification of strain by 16s rRNA gene sequences: DNA was isolated from biofilm cells using the protocol followed by Tillet and Neilan, (2000) with some minor modifications. Add 50 µl of TER buffer (10 Mm Tris HCl, pH 7.4; 1 mM EDTA pH 8; 100 µg/ml RNase A) into tube containing cell pellets. 750 µl freshly prepared XS buffer (1% Potassium ethyl Xanthogenate, 100 mM Tris HCl pH 7.4, 20 mM EDTA pH 8; 1% SDS; 800 mM ammonium acetate) and 10 µl RNase A were added and mixed by pipetting. After proper mixing, the solution tube was incubated at 70 ⁰C for 60 min. After incubation, tube was kept on ice for 30 min. Cell debris was removed by centrifugation at 14,000 rpm for 10 min. DNA was precipitated in supernatant by adding chilled ethanol. The DNA pellet was obtained by centrifuging at 12,000 rpm for 10 min. DNA pellet was washed with 70% ethanol and air dried. Then, TE buffer was added (Tris HCl 10 mM and EDTA 1 mM) to dissolve the pellet.
Amplification process was carried out by primers DNM1 F 5’GAAAGCCTGACGGAGCAATA 3’ and DNM1 R 5’ CGGGACTTAACCCAACATCT 3’. PCR reaction mixture (20 µl) was prepared by mixing 10 µl Dream Taq master mix, 0.5 µl forward and reverse primers from 1:10 stock, 1 µl template DNA and 8 µl MilliQ water. 35 PCR cycles were performed, initial denaturation at 94 ºC for 4mins, denaturation at 94º C for 30 secs, elongation at 55 ºC for 45 secs, extension at 72 ºC for 2 min and final extension 7mins at 72 ºC. DNA purification was carried out by GeneJET Gel Extraction (Thermo scientific). The purified DNA amplicon was subjected to Sanger sequencing. The identity of the strain was confirmed by BLAST analysis of obtained sequences with NCBI database (https://blast.ncbi.nlm.nih.gov).
RESULT AND DISCUSSION
Isolation, Biofilm yield and Strain confirmation of Chroococcidiopsis sp. by 16s rRNA gene sequences: Chroococcidiopsis sp. isolation was done through streak plate method and individual colonies were observed on agar plates (Fig 1A). The BLAST analysis of sequence data revealed the identity of the isolated organism as C. cubana. The sequence was deposited in NCBI GenBank data base with accession number MN950976. The biofilm yield of single colony grown in control and experimental flasks for 10 days were recorded (Table 2). Except run 4, the biofilm yield of all experimental flasks were significantly higher than of control.
Table 2. Experimental design with experimental yield (at 10thday)
| Runs | X1 (B) | X2 (A) | Biofilm yield(g/l) |
| 1 | -2 | 0 | 10 |
| 2 | 2 | 0 | 18 |
| 3 | 0 | 0 | 20 |
| 4 | -1 | 1 | 05 |
| 5 | 0 | 0 | 20 |
| 6 | 0 | 2 | 10 |
| 7 | -1 | -1 | 16 |
| 8 | 0 | 0 | 20 |
| 9 | 0 | 0 | 20 |
| 10 | 0 | 0 | 20 |
| 11 | 1 | 1 | 19 |
| 12 | 1 | -1 | 12 |
| 13 | 2 | -2 | 15 |
Figure 1: Isolation and experimental set up of CCD in lab
ANOVA for Response surface model: The effect of two independent variables were studied on one dependent response. The results of the second order response surface model for increase yield based on analysis of variance (ANOVA) is given in table 3. Regression equation of yield having empirical function of test variables in coded unit is shown in equation 3:

Where ![]() is the predicted yield, X1 is K2HPO4 and X2 is NaNO3 ANOVA uses F – statistic to test the equality of means. F – test had very low probability value [(Prob>F) < 0.0001]. Hence, this model was highly significant for this experiment (Zheng et al., 2008). Goodness of fit of model was determined by determination coefficient (R2). Determination coefficient, (R2) value was 0.99 owing to which 99 % sample variation was qualified the variables, only 1% of the total variance could not be explained by this model. Adjusted determination coefficient also had similar value. Hence, the significance of the model was confirmed at required confidence level. Standard deviation (SD) was 0.47. Smaller the value of standard deviation, more precise the data. Because larger value of SD increases the acceptable range within the deviation. Coefficient of variation or pure error was 2.95%. Pure error is lower than 5% so it was acceptable (Box et al., 1978). Moreover, adequate precision had a value of 48.72. Adequate precision measures the signal to noise ratio. A ratio greater than 4 is desirable (Ahmadkhanjha et al., 2015). Because the model has a high signal so it’s more reliable for optimization.
is the predicted yield, X1 is K2HPO4 and X2 is NaNO3 ANOVA uses F – statistic to test the equality of means. F – test had very low probability value [(Prob>F) < 0.0001]. Hence, this model was highly significant for this experiment (Zheng et al., 2008). Goodness of fit of model was determined by determination coefficient (R2). Determination coefficient, (R2) value was 0.99 owing to which 99 % sample variation was qualified the variables, only 1% of the total variance could not be explained by this model. Adjusted determination coefficient also had similar value. Hence, the significance of the model was confirmed at required confidence level. Standard deviation (SD) was 0.47. Smaller the value of standard deviation, more precise the data. Because larger value of SD increases the acceptable range within the deviation. Coefficient of variation or pure error was 2.95%. Pure error is lower than 5% so it was acceptable (Box et al., 1978). Moreover, adequate precision had a value of 48.72. Adequate precision measures the signal to noise ratio. A ratio greater than 4 is desirable (Ahmadkhanjha et al., 2015). Because the model has a high signal so it’s more reliable for optimization.
Table 3. ANOVA for response surface quadratic model
| Source | Sum of Square | Degree of freedom | Mean Square | F – value | Probe>F (p value) |
| Model | 300.79 | 5 | 60.16 | 277.10 | <0.0001 |
| Residual | 1.52 | 7 | 0.22 | ||
| Lack of fit | 1.52 | 3 | 0.51 | ||
| Pure error | 0.00 | 4 | 0.00 | ||
| Total | 302.31 | 12 |
Standard deviation. = 0.47; Coefficient of variation = 2.95%; Mean = 15.77; R2 = 0.99; Adj. R2 = 0.99; Pred. R2 = 0.96
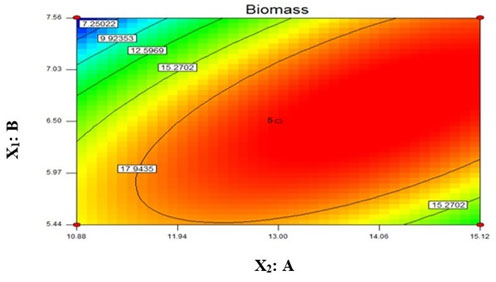
Coefficient estimation for model: The significance of coefficient was determined by t value and p value. Both these values were computed and mentioned in Table 4. Higher the value of t – test and smaller the p value, the results are more significant (Lee & Wang, 1997). Our model intercept had large t value suggesting this model is highly significant. In model, variable X1 had small p value as compare to variable X2. Hence variable A was more significant than variable B in this model. The 2D contour plot represents graphical view of the regression equation (Wang et al., 2007). It had shown the effect of both the variables on yield of biofilm. Based on centre point of the contour plot, the obtained value of variable A (NaNO3) and variable B (K2HPO4) were 13 and 6.5 respectively (Fig 2). Hence, both these values were found to be optimal for biofilm yield in 10 days. For optimization, the Design Expert 7.0.2 software suggested 0.95 and 1 as the two desirability standards. In current study, we proceeded for desirability 1 obtained value for A (NaNO3) = 13 from lower limit 10 and upper limit 15 and value for B (K2HPO4) = 6.5 from lower limit 5 and upper limit 8. It was given 20 g/l yield in 10 days.
Table 4. Coefficient estimation of model
| Factor | Coefficient | Std. error | Computed t – value | Computed p – value |
| Intercept | 20 | 0.21 | 95.23 | 0.003 |
| A | 2.66 | 0.16 | 16.625 | 0.019 |
| B | -1.38 | 0.16 | -8.625 | 0.036 |
| AB | 4.50 | 0.23 | 19.57 | 0.016 |
| A2 | -3.06 | 0.18 | -17.0 | 0.018 |
| B2 | -3.81 | 0.18 | -21.0 | 0.015 |
Figure 2: 2D contour plot for in vitro biofilm yield of Chroococcidiopsis cubana
CONCLUSION
From the above results, it was concluded that variables A (NaNO3 = 13 g/l) and B (K2HPO4 = 6.5 g/l) were giving similar results in experimental design data and for desirability of optimization. Hence, these values of the variables were used for upscaling the biofilm yield. The optimized model was successfully employed for in vitro cyanobacterial biofilm yield of Chroococcidiopsis cubana.
ACKNOWLEDGEMENTS
The authors (DM and DS) wish to acknowledge Research and Consultancy Cell (RCC) Project sanction no. RCC/Dir./2018/56/7 of the M. S. University of Baroda for research grant. The authors are also thankful to plant anatomy lab (Dr. K. S. Rajput) for providing necessary facilities to carry out the molecular study.
Conflict of interest: There is no conflict of interest
REFERENCES
Ahmadkhaniha D, Sohi MH, Zarei-Hanzaki A, Bayazid SM & Saba M (2015) Taguchi optimization of process parameters in friction stir processing of pure Mg. Journal of Magnesium and Alloys 3: 168-172.
Box GE, Hunter WH & Hunter S (1978) Statistics for experimenters (Vol. 664). John Wiley and sons, New York.
Bradley N (2007) The response surface methodology. Master of Science thesis. Department of Mathematical Sciences. Indiana University of South Bend
Bratchell N (1989) Multivariate response surface modelling by principal components analysis. Journal of Chemometrics 3: 579-588.
Garrett TR, Bhakoo M & Zhang Z (2008) Bacterial adhesion and biofilms on surfaces. Progress in Natural Science 18: 1049-1056.
Hancock RE (2013) Bacterial biofilm development as a multicellular adaptation: antibiotic resistance and new therapeutic strategies. Current opinion in microbiology 16: 580-589.
Khuri AI & Mukhopadhyay S (2010) Response surface methodology. Wiley Interdisciplinary Reviews: Computational Statistics 2: 128-149.
Knowles EJ & Castenholz RW (2008) Effect of exogenous extracellular polysaccharides on the desiccation and freezing tolerance of rock-inhabiting phototrophic microorganisms. FEMS microbiology ecology 66: 261-270.
Lee, C.L. and Wang, W.L., 1997. Biological statistics. Science Press, Beijing. Levin L, Herrmann C, Papinutti VL (2008). Optimization of lignocellulolytic enzyme production by the white-rot fungus Trametes trogii in solid-state fermentation using response surface methodology. Biochemical Engineering Journal 39, pp.207-214.
Ljaljevic-Grbic M, Vukojevic J, Subakov-Simic G, Krizmanic J & Stupar M (2010) Biofilm forming cyanobacteria, algae and fungi on two historic monuments in Belgrade, Serbia. Archives of Biological Sciences 62: 625-631.
Lundstedt T, Seifert E, Abramo L, Thelin B, Nyström Å, Pettersen J & Bergman R (1998) Experimental design and optimization. Chemometrics and intelligent laboratory systems 42: 3-40.
Miller AZ, Laiz L, Dionısio A, Macedo MF & Saiz-Jimenez C (2009) Growth of phototrophic biofilms from limestone monuments under laboratory conditions. International biodeterioration & biodegradation 30: 1-8.
Mirhosseini H & Tan CP (2009) Response surface methodology and multivariate analysis of equilibrium headspace concentration of orange beverage emulsion as function of emulsion composition and structure. Food Chemistry 115: 324-333.
Molobela IP & Ilunga FM (2012) Impact of bacterial biofilms: the importance of quantitative biofilm studies. Annals of microbiology 62: 461-467.
Rippka R (1988) Isolation and purification of cyanobacteria. Methods in enzymology 167: 3-27.
Tillett D & Neilan BA (2000) Xanthogenate nucleic acid isolation from cultured and environmental cyanobacteria. Journal of Phycology 36: 251-258.
Trunk T, Khalil HS & Leo JC (2018) Bacterial autoaggregation. AIMS microbiology 4: 140 -164.
Wang JP, Chen YZ, Ge XW & Yu HQ (2007) Optimization of coagulation–flocculation process for a paper-recycling wastewater treatment using response surface methodology. Colloids and Surfaces A: Physicochemical and Engineering Aspects 302: 204-210.
Zheng ZM, Hu QL, Hao J, Xu F, Guo NN, Sun Y & Liu DH (2008) Statistical optimization of culture conditions for 1, 3-propanediol by Klebsiella pneumoniae AC 15 via central composite design, Bioresource Technology 99: 1052-1056.

