Ajay Kumar1![]() , Rama Sushil2 and Arvind Kumar Tiwari3
, Rama Sushil2 and Arvind Kumar Tiwari3
1-2Department of Computer Science & Engineering, DIT University Dehradun India
3Department of Computer Science & Engineering, KNIT Sultanpur, U.P. India
Corresponding author Email: kumarajay7th@gmail.com
Article Publishing History
Received: 05/06/2019
Accepted After Revision: 29/08/2019
Across the world, any cancer becomes a calamity for a person who is suffering from it, mainly women are facing a real challenge when it comes to breast cancer. Breast cancer can be diagnosed at an early stage to overcome the consequences at a later stage. In the field of Computer Science, Machine Learning (ML) techniques are competent enough to diagnose the stages of cancer. ML techniques work upon the data which are collected from hospitals of suspected patients. There are various ML techniques which can build a model in order to diagnose cancer on the basis of finding accuracy level. In this paper, we have discussed the significance of accuracy level for predicting the cancer. In previous works, it has been observed that 100% accuracy is found on data analysis by some researchers. Although 100% accuracy must have given perfect prediction but it is observed that prediction was not so, sometimes it gives incorrect prediction also. So, prediction technique is scaled up with inclusion of more parameters precision, recall, F1- measure, Receiver Operating Characteristics (ROC) area and Area Under Curve (AUC) score.
Accuracy, AUC, Cancer, F1-measure, Machine Learning, Precision, Recall, ROC
Kumar A, Sushil R, Tiwari A. K. Significance of Accuracy Levels in Cancer Prediction using Machine Learning Techniques. Biosc.Biotech.Res.Comm. 2019;12(3).
Kumar A, Sushil R, Tiwari A. K. Significance of Accuracy Levels in Cancer Prediction using Machine Learning Techniques. Biosc.Biotech.Res.Comm. 2019;12(3). Available from: https://bit.ly/2lCISF1
Copyright © Kumar et al., This is an open access article distributed under the terms of the Creative Commons Attribution License (CC-BY) https://creativecommns.org/licenses/by/4.0/, which permits unrestricted use distribution and reproduction in any medium, provide the original author and source are credited.
Introduction
Human body is made up of billions of cells and when cells start growing, becomes lumps and later on develops into tumor. Tumor is of two types: Malignant and Benign. Malignant is dangerous that causes another tumor and consequently cancer. Benign tumor usually does not cause cancer in short span of time. In this paper, there is a discussion of breast cancer which is due to internal or external disbalance of hormonal activities.
There are some traditional methods to diagnose and prognose the cancer but sometimes these methods take long time to diagnose. A Machine Learning is a field of Artificial Intelligence (AI) in computer science which can implement many computational intelligent techniques for the fast and accurate prediction of cancer. ML techniques can precisely predict different type of tumors. It motivated us to work on cancer prediction technique and working to find alternative parameters for better prediction.
This paper comprises of four sections. In section 1, Introduction of cancer has been described. Section 2 summarizes the previous related work. In section 3, study on various machine learning techniques have been presented. Section 4 presents the various vital parameters including accuracy for breast cancer prediction. In section 5, breast cancer prediction performance metrics is discussed. In section 6, experiments and results are shown and in the last section, conclusion and discussion are explained.
Ahmad et al. (2013) compared 3 ML techniques viz. Decision Tree (C4.5), ANN and SVM on Iranian Centre for Breast Cancer datasets of 1189 patient and found the accuracy as 93.6%, 94.7% and 95.7%. Ali et al. (2019) proposed a prediction model using “big data” to explore feature selection and cross-validation in omics file datasets. Further described anti-drug drug response modelling and predicting their phenotypic responses. Asri et al. (2016) compared different ML algorithms: SVM, C4.5, NB and kNN for WBCD dataset which has 699 instances and 11 integer-valued attributes. Among all algorithms, SVM gave the highest accuracy 97.13% with lowest error rate conducted in WEKA data mining tool.
Bevilacqua et al. (2006) used IDEST novel approach based on ANN for WBCD datasets and found 98.6% accuracy. Boughorbel et al. (2017) focused on another metric known as Matthews Correlation Coefficient (MCC) to handle imbalance data using SVM and Bayes classifier. Burt et al. (2018) diagnosed a breast cancer with deep learning network using a system Computer-aided detection and diagnosis (CAD). It mainly looks for images captured by MRI, X-rays and compared with human expertise like radiologists, clinicians etc. Bychkov et al. (2018) took a sample of 420 images of colorectal cancer and apply deep learning outperformed AUC 0.69 which is better than AUC 0.58 and AUC 0.57 preformed by human expert and whole -slide level respectively.
Chaurasia et al. (2014) explained data mining techniques to predict cancer when they applied RepTree (C4.5), RBF Network and Simple Logistics on 286 samples and found accuracy as 71.32%, 73.77% and 74.47% respectively. Coudray et al. (2018) used a model deep convolutional neural network (inception v3) on whole-slide images obtained from The Cancer Genome Atlas (TCGA) and obtained an improved AUC score from 0.733 to 0.856 in the detection of cancer subtype.
Elgedawy et al. (2017) applied 3 machine learning techniques: Naïve Bayes, SVM and RF. Out of them RF is the most appropriate and useful algorithm to give the best accuracy as 99.42% where SVM and NB produced 98.8% and 98.24% accuracy respectively.
Huang MW et al. (2017) used SVM ensemble classifier along with boosting method and RBF kernel based SVM to predict the accuracy in cancer dataset. In case of small-scale dataset, GA+RBF SVM ensembled with boosting method and produced 98.28% accuracy whereas in large dataset, RBF SVM ensembled with boosting method produced 99.52% accuracy.
Nguyen et al. (2013) shown experiments on two datasets WBCD (diagnosis) & WBCP (prognosis) from Wisconsin Breast Cancer Dataset and claimed for 99.8% and 99.7% accuracy.Pirooznia et al. (2007) compared many ML techniques and found 100% accuracy when they applied SVM-RFE on 84 sample which is a less size of data.
Sahu et al. (2012) proposed a novel approach using PSO along with SVM and k-NN ML techniques applied on the size of 87 sample and found 100% accuracy. Sivakami et al. (2015) proposed a hybrid technique DT-SVM to forecast cancer prediction for the dataset of 699 instances of WBCD repository and obtained accuracy as 91%. Steiner et al. (2018) shown a impact of deep learning assistance on lymph of breast cancer and found micro metastases in the images with a range from 0.02, 0.002, 0.018 and 0.0005. Lower the value of micro metastases like 0.0005, higher the accuracy in lymph node of breast cancer. Xiao et al. (2018) discussed a multi-model ensemble method based on deep learning to find the accuracy and effective of different classifier. The data were supplied in the form of gene expression. This method was tested on three public RNA-seq data sets.
Machine Learning Techniques
Machine Learning (ML) is a part of AI. ML is used to infer the knowledge from the behavior of data. There are many areas where ML can be applied. In this paper we are discussing the cancer related issues. So, ML uses the techniques to generalize the biological sample of a given datasets. Following popularly used ML techniques have been introduced briefly.
Decision Tree
A Decision Tree (AL-SALIHY et al. 2017, Yue et al. 2018, Ponnuraja et al. 2017) is a binary classifier used to take the decision on attributes of the dataset. It looks like the tree but it is an inverted tree.
Random Forest
A Random Forest (Okun et al. 2007, Nahid et al. 2017, Ghongade et al. 2018) is another classifier, based on decision tree, which is a next step when multiple decision tree resides together.
Support Vector Machine
Support Vector Machine (SVM) is a very effective classifier that classify the feature’s outcome in two categories with a hyperplane having distance between the samples. (Huang MW et al. 2017, Sweilam et al. 2010, Sewak et al. 2007)
k-Nearest Neighbor (kNN)
kNN (Pawlovsky 2017, Rodriguez et al. 2018, Meneses et al. 2019, Al-Hadidi et al. 2016) is an essential classifier which makes a group of similar patterns with dataset sample. In general, the value of k is randomly put from 1 to 5 or extends up to 11 depends on how many neighbors are needed for grouping. There are various distance measurement mathematical equations such as Euclidean, Manhattan, Minkowski, Chebyshev, Cosine Similarity, Cosine Distance to find the distance between the neighbor.
Naïve Bayes Classifier
This classifier is based on Bayes’ theorem (Maysanjaya et al. 2018, Rashmi et al. 2015, Soria et al. 2008) which takes into consideration of independent feature of the data. Dependent feature creates more correlation effect in prediction.
Significance of Level of Accuracy for Breast Cancer Prediction
There are many ML techniques for cancer diagnosis and prognosis. Many researchers have calculated the level of accuracy in percentage using different ML techniques such as Random Forest, SVM, Naïve Bayes, Decision Tree (Nguyen et al. 2013, Ahmad et al. 2013, Chaurasia et al. 2014, Sivakami et al. 2015, Elgedawy et al. 2017) for cancer prediction as shown below in table 1 for breast cancer datasets.
Table 1: ML Techniques’ Accuracy level for prediction of Breast Cancer
| Type of Cancer: Breast Cancer | |||
| S.No. | ML Technique | Sample | Accuracy |
| 1 | Random Forest | 699 | 99.82% |
| 2 | DT-SVM | 699 | 91% |
| 3 | Random Forest | 699 | 99.24% |
| SVM | 98.8% | ||
| Naïve Bayes | 98.24% | ||
| 4 | Decision Tree (C4.5) | 1189 | 93.6% |
| ANN | 94.7% | ||
| SVM | 95.7% | ||
| 5 | RepTree (C4.5) | 286 | 71.32% |
| Radial Basis Function Network | 73.77% | ||
| Simple Logistic | 74.47% | ||
On the basis of above results, it is not easy to say that a particular Machine Learning technique is fit suitably for the diagnosis of breast cancer for a particular dataset on the basis of level of accuracy only because 100% accuracy comes in underfit condition where drawn conclusion of cancer prediction can’t be correct.
Following table 2 (Pirooznia et al. 2007, Rajeshwari et al. 2011, Sahu et al. 2012, Gunavathi et al. 2014) shows 100% accuracy level using some other ensemble Machine Learning techniques on selected datasets where 100% accuracy is not predicting cancer correctly.
Table 2: Level of accuracy of ML Techniques for small data size
| S.No. | ML Technique | Types of Cancer | Sample | Accuracy |
| 1 | SVM-RFE | Breast Cancer | 84 | 100% |
| 2 | PSO-KNN | Breast Cancer | 97 | 100% |
| PSO-SVM |
On the basis of above results, it is not easy to say that a particular Machine Learning technique is fit suitably for the diagnosis of breast cancer for a particular dataset on the basis of level of accuracy
Table 3: Performance parameter metrics for dataset *BCWD11
| Algorithm | Confusion Matrix Components | Performance Parameters (*BCWD11) | ||||||||
| True Positive (TP) | True Negative (TN) | False Positive (FP) | False Negative (FN) | Accuracy | Precision | Recall | F-Measure | MCC | ROC Area | |
| Naïve Bayes | 436 | 235 | 22 | 6 | 95.99% | 96.2% | 96% | 96% | 0.914 | 98.6% |
| SVM (SMO) | 445 | 231 | 13 | 10 | 96.7% | 96.7% | 96.7% | 96.7% | 0.927 | 96.5% |
| KNN (IBK) | 443 | 222 | 15 | 19 | 95.13% | 95.1% | 95.1% | 95.1% | 0.892 | 94.5% |
| Decision Tree (J48) | 438 | 223 | 20 | 18 | 94.56% | 94.6% | 94.6% | 94.6% | 0.880 | 95.5% |
| Random Forest | 444 | 230 | 14 | 11 | 96.42% | 96.4% | 96.4% | 96.4% | 0.921 | 99% |
Table 4: Performance parameter metrics for dataset **WBCD32
| Algorithm | Confusion Matrix Components | Performance Parameters (**WBCD32) | ||||||||
| True Positive (TP) | True Negative (TN) | False Positive (FP) | False Negative (FN) | Accuracy | Precision | Recall | F-Measure | MCC | ROC Area | |
| Naïve Bayes | 190 | 337 | 22 | 20 | 92.61% | 92.6% | 92.6% | 92.6% | 0.842 | 97.6% |
| SVM (SMO) | 201 | 356 | 11 | 1 | 97.89% | 97.9% | 97.9% | 97.9% | 0.955 | 97.3% |
| KNN (IBK) | 200 | 347 | 12 | 10 | 96.13% | 96.1% | 96.1% | 96.1% | 0.917 | 95.6% |
| Decision Tree (J48) | 194 | 335 | 18 | 22 | 92.97% | 93% | 93% | 93% | 0.85 | 92.3% |
| Random Forest | 196 | 350 | 16 | 7 | 95.95% | 96% | 96% | 95.9% | 0.913 | 99.1% |
Breast Cancer Prediction Metrics
The basis of performance parameter metrics is confusion matrix and then metrics such as accuracy, precision, recall, f-measure, Mathew’s Correlation Coefficient (MCC), is calculated (Kourou et al. 2015, Baker 2003, Yang et al. 2017, Tilaki 2013).
Confusion Matrix
A Confusion matrix is a summary of prediction results on a classification problem. In it, the number of correct and incorrect predictions are summarized with count values and broken down by each class, the concept is shown in table 5.
Table 5: Confusion Matrix
| Actual | |||
| Valid | Not Valid | ||
| Predicted | Accept (Recurrence) | True Positive
(TP) |
False Positive (FP) |
| Reject
(No Recurrence) |
False Negative (FN) | True Negative (TN) | |
On the basis of above table, various metrics parameter has been defined below.
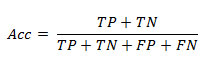
Accuracy (Barlow et al. 2004, Tharwat 2018) is the number of correct predictions divided by total number of predictions made. Mathematically accuracy (Acc) is given by the following formula.
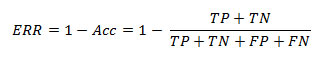
Sometimes accuracy yields the same value with respect to multiple classifiers and this makes more complication with Error Rate (ERR) or misclassification rate (Jensen et al. 2010, Barlow et al. 2004, Tharwat 2018). Error Rate can be calculated as below
Sometimes because of accuracy paradox, accuracy is not sufficient to find the best model. Improving the accuracy by reducing the error is not appropriate. Therefore, ROC Curve and AUC score are better option to use for prediction instead of using the only parameter accuracy.
In this paper other additional parameter such as ROC and AUC metrics have been calculated to find the actual best suitable fit model.
ROC and Area under Curve (AUC)
ROC (Baker 2003, Yang et al. 2017, Tilaki 2013) curve demonstrates the tradeoff between the true positive fraction and false positive fraction to evaluate the positivity. AUC (Yang et al. 2017, Tilaki 2013) is a measure of the model’s performance which is based on the ROC curve. This curve plots two parameters: True Positive Rate & False Positive Rate. Both the parameters are defined below.
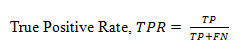
True Positive Rate
(TPR), termed as sensitivity also, is the fraction of positives correctly classified divided by total positives and is defined as below
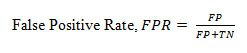
False Positive Rate
(FPR) is the fraction of negative incorrectly classified divided by total negatives and is defined as below
AUC is an effective and combined measure of TPR and FPR that describes the inherent validity of diagnostic tests (Kouruo et al. 2015). In below figure 1, FPR and TPR are represented by x-axis and y-axis respectively. The ROC indicates the curve of value ranging from 0 to 1 whereas AUC shows the area under curve. Dashed-line partitions True values and False value. True values lie above the dashed line and False values lie below the line.
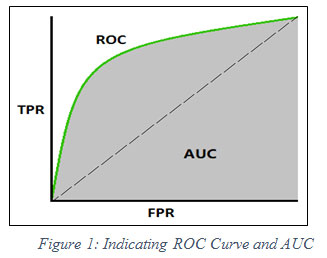 |
Figure 1: Indicating ROC Curve and AUC |
Results And Discussion
The experimental setup is designed under the environment of Windows 10 operating System, Python 3.x version and smart IDE Spyder which is a unit of Anaconda distribution. The dataset has been used from Wisconsin Breast Cancer Dataset having
10 major features in *BCWD11 and 30 major features in **WBCD32 (Kumar et al. 2019). The respective performance measurement metrics is calculated on the basis of confusion matrix given in table 3 & table 4 respectively.
On the basis of TPR and FPR, the ROC curve is plotted for all machine learning classifiers to obtain AUC score. The following graph is showing the AUC score in figure 3 below.
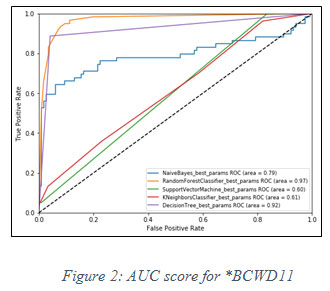 |
Figure 2: AUC score for *BCWD11 |
On the basis of fact that higher the value of AUC near to 1, the model is considered to be the best. In figure 2, it is observed that the best model for said dataset is Random Forest classifier, has the highest value of AUC i.e. 0.97.In similar fashion, another experiment has been performed for **WBCD32 and performance of Random Forest classifier is again observed as the best model for AUC score 0.98 shown in figure 3 below.
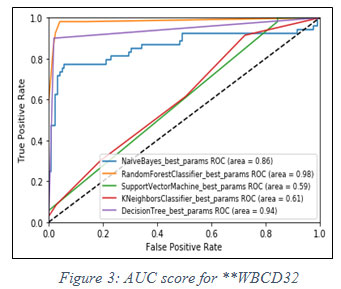 |
Figure 3: AUC score for **WBCD32 |
This paper discussed the confusion matrix and performance parameters useful for prediction. Parameters are accuracy, precision, F-measure, MCC and ROC area. Based on all the parameters, the outcome of this paper was to find out the AUC score whereas in previous works, only accuracy was calculated.
We focused to locate the best fit model for selected breast cancer dataset. In general, it is observed that only accuracy is used for cancer prediction. But accuracy does not give perfect prediction. It is identified that AUC score is significant to consider for correct prediction of breast cancer instead of the only parameter ‘accuracy’. Random Forest classifier found fit perfectly for the used dataset among all other four classifiers viz Naïve Bayes, SVM, kNN and Decision Tree. There are also few more considerable measurement metrics such as Youden’s index (YI), Discriminant power (DP), Balanced classification rate (BCR), Optimization precision (OP), Jaccard (or Tanimoto similarity coefficient), and many more. In future, we intend to do feature engineering for better prediction of breast cancer.
References
Ahmad LG. et al. (2013) Using Three Machine Learning Techniques for Predicting Breast Cancer Recurrence, Open Access, Journal of Health & Medical Informatics 2013, vol 4, issue 2. ISSN: 2157-7420, http://dx.doi.org/10.4172/2157-7420.1000124
Alam Z M, Rahman S M, and Rahman S M (2019) A Random Forest based predictor for medical data classification using feature ranking, ELSEVIER Informatics in Medicine Unlocked 15 (2019) 100180, doi: 10.1016/j.imu.2019.100180
Al-Hadidi MR, Alarabeyyat A, and Alhanahnah M. (2016) Breast cancer Detection using K-Nearest Neighbor Machine Learning Algorithm, 9th Intl conf Developments in eSystems Engineering (DeSE 2016), Liverpool, UK, Doi: 10.1109/dese.2016.8
Ali M, and Aittokallio T (2018) Machine Learning and Feature Selection for drug response prediction in precision oncology applications, SPRINGER Biophysical Reviews 11:31-39
AL-SALIHY N K., and IBRIKCI T (2017), Classifying Breast Cancer by using Decision Tree Algorithms, ACM Digital Library, Proceedings of 6th Intl. Conf. on Software and Computer Applications (ICSCA 2017), Feb 26-28, pp 144-148, Bangkok. DOI: http://dx.doi.org/10.1145/3056662.3056716
Asria H et al. (2016) Using Machine Learning Algorithms for Breast Cancer Risk Prediction and Diagnosis, ELSEVIER 6th Intl Sym Frontiers in Ambient and Mobile Systems (FAMS 2016), Procedia Computer Science 83 (2016) pp 1064 – 1069.
Baker S G (2003) The Central Role of Receiver Operating Characteristics (ROC) Curves in Evaluating Tests for the Early Detection of Cancer, J National Cancer Institute, vol 95, no.7, April 2, 2003.
Barlow W E et al (2015) Accuracy of Screening Mammography Interpretation by Characteristics of Radiologists, J Natl Cancer Inst. 2004 December 15, 96(24) : pp 1840 – 1850. Doi: 10.1093/jnci/djh333.
Berrar D and Flach P. (2011) Caveats and pitfalls of ROC analysis in clinical microarray research (and how to avoid them), J. Briefing in Bioinformatics, vol 13, no. 1, pp 83-97, March 2011, doi: 10.1093/bib/bbr008
Bevilacqua V. et al. (2006) A Novel Multi-Objective Genetic Algorithm Approach to Artificial Neural Network Topology Optimization: The Breast Cancer Classification Problem, 2006 International Joint Conference on Neural Networks Sheraton Vancouver Wall Centre Hotel, Vancouver, BC, Canada July 16-21, IEEE 2006, pp 1958-1965, ISBN 0780394909
Boughorbel S, Jarray F, and El-Anbari M (2017) Optimal classifier for imbalanced data using Matthews Correlation Coefficient metric, PLOS One 12(6): e0177678, China
Burt J R et al. (2018) Deep Learning beyond cats and dogs: recent advances in diagnosing breast cancer with deep learning networks, Br J Radiol 2018; 19:20170545,
Bychkov D et al. (2018) Deep Learning based tissue analysis predicts outcome in colorectal cancer, SCIENTIFIC REPORT Nature, 8:339, doi:10.1038/s41598-018-21758-3
Chaurasia V, and Pal S (2014) Data Mining Techniques: To Predict and Resolve Breast Cancer Survivability, Intl J Computer Science and Mobile Computing, Vol.3 Issue.1, January- 2014, pg. 10-22, ISSN 2320–088X
Coudray N et al. (2018) Classification and Mutation prediction from non-small cell lung cancer histopathology images using deep learning, Nature Medicine, vol 24, pp 1559-1567
Elgedawy M N (2017) Prediction of Breast Cancer using Random Forest, Support Vector Machines and Naïve Bayes, Intl J Engineering and Computer Science ISSN: 2319-7242 Volume 6 Issue 1 Jan. 2017, Page No. 19884-19889 Index Copernicus Value (2015): 58.10, DOI: 10.18535/ijecs/v6i1.07
Ghongade R.D., and Wakde D.G.(2018) Breast Cancer Diagnosis from Digital Mammograms using RF and RF-ELM, SPRINGER Proceedings of Intl. Conf. Recent Advancement on Computer and Communication, Singapore, Lecture Notes in Networks and Systems (LNNS), vol 34, pp 365 – 374, doi: 10.1007/978-981-10-8198-9_38
Gunavathi C, and Premalatha K (2014) A Comparative Analysis of Swarm Intelligence Techniques for Feature Selection in Cancer Classification, Hindawi Publishing Corporation The Scientific World Journal, Volume 2014, Article ID 693831, pp 1-12, ISSN 2356-6140,
Huang M W et al. (2017) SVM and SVM Ensembles in Breast Cancer Prediction, PloS one 12.1 (2017): e0161501. DOI: 10.1371/journal.pone.0161501, January 6, 2017
Jensen A. et al. (2010) Performance of diagnostic mammography differs in the United States and Denmark”, I.J. Cancer, 127 UICC Global Cancer Control, pp 1905-1912 (2010). Doi:10.1002/ijc25198
Kourou K. (2015) Machine Learning Applications in Cancer Prognosis and Prediction, ELSEVIER Computational and Structural Biotechnology Journal, 13 (2015) 8-17, doi: 10.1016/j.csbj.2014.11.005
Kumar A., Sushil R, and Tiwari A (2019) Comparative study of Classification Techniques for Breast Cancer Diagnosis, Published in Intl. J. Computer Science and Engineering (IJCSE), vol 7, Issue 1, Jan 2019, E-ISSN 2347 – 2693.
Maysanjaya I M D, Pradnyana I M A, and Putrama I M (2017) Classification of Breast Cancer using Wrapper and Naïve Bayes Algorithms, Intl conf. Mathematics and Natural Science (IConMNS 2017), Indonesia, J of Physics, IOP Conf. Series, 1040 (2018) 012017, doi: 10.1088/1742-6596/1040/1/012017
Meneses J S, Chavez Z R, and Rodriguez J G (2019) Compressed kNN: K-Nearest Neighbors with Data Compression”, MDPI Journal Entropy 2019, 21, 234, doi: 10.3390/e21030234.
Nahid AA, and Kong Y.(2017) Involvement of Machine Learning for Breast Cancer Image Classification: A Survey, Computational and Mathematical Methods in Medicine, HINDAWI, vol 2017, Article ID 3781951, pp 1-29, doi: 10.1155/2017/3781951
Nguyen C, Wang Y, and Nguyen H N (2013) Random forest classifier combined with feature selection for breast cancer diagnosis and prognostic, J. Biomedical Science and Engineering, 2013, 6, pp 551-560, DOI: http://dx.doi.org/10.4236/jbise.2013.65070
Okun O. and Priisalu H. (2007) Random Forest for Gene Expression Based Cancer Classification: Overlooked Issues, SPRINGER-Verlag Berlin Heidelberg LNCS 4478, pp. 483 – 490, doi:10.1007/978-3-540-72849-8_61
Pawlovsky A.P. (2017) A KNN method that uses a Non-Natural Evolutionary Algorithm for Component Selection, J. Fundamental and Applied Sciences (JFAS), 2017, 9(4S), pp 173-192, ISSN 1112-9867, doi: http://dx.doi.org/10.4314/jfas.v9i4s.10
Ponnuraja C et al. (2017) Decision Tree Classification and Model Evaluation for Breast Cancer Survivability: A Data Mining Approach, Biomedical & Pharmacology Journal, vol. 10(1), pp 281- 289, March 2017, doi: 10.13005/bpj/1107
Pirooznia M. et al. (2008) A comparative study of different machine learning methods on microarray gene expression data, BMC Genomics, Open Access BioMed Central, 2008, International Conference on Bioinformatics & Computational Biology (BIOCOMP’07) Las Vegas, NV, USA. 25-28 June 2007, DOI: 10.1186/1471-2164-9-S1-S13
Rajeswari P., and Reena G. S. (2011) Human Liver Cancer Classification using Microarray Gene Expression Data, International Journal of Computer Applications (0975 – 8887) Volume 34– No.6, November 2011, pp 25-37
Rashmi GD, Lekha A, and Bawane N (2015) Analysis of efficiency of classification and prediction algorithms (Naïve Bayes) for Breast Cancer Dataset, Intl conf. Emerging Research on Electronics, Computer Science and Technology (ICERECT 2015), Mandya, Karnataka India, doi: 10.1109/erect.2015.7498997
Rodriguez V., Sharma K., and Walker D. (2018)., Breast Cancer Prediction with K-Nearest Neighbor Algorithm using Different Distance Measurements, Software Engineering Project (SWEN 670), University of Maryland, University College, USA, Dec 2018, doi: 10.13140/RG.2.2.20288.79361
Sahu B., and Mishra D. (2012) A Novel Feature Selection Algorithm using Particle Swarm Optimization for Cancer Microarray Data, International Conference on Modeling Optimization and Computing (ICMOC-2012), ELSEVIER Procedia Engineering 38 (2012 ) pp 27 – 31.
Sewak M. et al.(2007) SVM Approach to Breast Cancer Classification, IEEE 2nd Intl conf. Multi-Symposium on Computer and Computational Sciences (IMSCCS 2007), Iowa City, USA, Aug 13-15, 2007, doi: 10.1109/IMSCCS.2007.46
Sivakami K (2015) Mining Big Data: Breast Cancer Prediction using DT – SVM Hybrid Model, Intl J Scientific Engineering and Applied Science (IJSEAS), Volume-1, Issue-5, August 2015, pp 418-429, ISSN: 2395-3470
Steiner D F et al. (2018) Impact of Deep Learning Assistance on the Histopathologic Review of Lymph Nodes for Metastatic Breast Cancer, Am J Surg Pathol, vol 42, no. 12, pp 1636-1646
Soria D et al. (2015) A Comparison of three different methods for Classification of Breast Cancer data, IEEE 7th Intl Conf. Machine Learning and Applications (ICMLA), San Diego, USA, Dec 11-13, 2008, ISBN 978-0-7695-3495-4, DOI: 10.1109/ICMLA.2008.97,
Sweilam NH., Tharwat A.A., and Moniem N.K.A. (2010) Support Vector Machine for Diagnosis Cancer Disease: A Comparative Study, ELSEVIER Egyptian Informatics Journal, Cairo University (2010) 11, pp 81-92, doi: 10.1016/j.eij.2010.10.005.
Tharwat A (2018) Classification Assessment Methods, Elsevier Saudi Computer Society, Applied Computing Informatics, 2018, doi:10.1016/j.aci.2018.08.003.
Tilaki H K (2013) Receiver Operating Characteristics (ROC) Curve Analysis for Medical Diagnostic Test Evaluation, Caspian J Intern Med 2013, 4(2), pp 627-635
Xiao Y et al. (2018) A deep learning based multi-model ensemble method for cancer prediction, Comp Methods and Programs in Biomedicine, doi: 10.1016/j.cmpb.2017.09.005
Yang C H et al (2017) Interaction of MRE11 and Clinicopathologic Characteristics in Recurrence of Breast Cancer: Individual and Cumulated Receiver Operating Characteristics Analyses, Hindawi BioMed Research International, vol 2017, Article ID 2563910, 9 pages, doi: 10.1155/2017/2563910
Yue W. et al. (2018) Machine Learning with Applications in Breast Cancer Diagnosis and Prognosis, Journal Designs, 2(2), 13, May 2018, doi: 10.3390/designs2020013.

