1Fisheries and Aquaculture Extn. Laboratory, Department of Zoology, University of Kalyani, Kalyani, Nadia, West Bengal, India
2Parasitology and Microbiology Research Laboratory, Department of Zoology, University of Burdwan, Burdwan, India
3Fisheries Laboratory, Regional Research Station, New Alluvial Zone, Bidhan Chandra KrishiViswavidyalaya, Gayeshpur, Nadia, West Bengal, India. PIN-741234
Corresponding author email: drsubhendudatta@rediffmail.com
Article Publishing History
Received: 14/04/2020
Accepted After Revision: 26/06/2020
The primary concern of the fish culture is nutrient budget of the particular ecosystem. Nitrogen is the chief macronutrient of aquatic system and biological nitrogen transformation in the aquaculture pond is dominated by ammonifying, nitrifying and denitrifying bacteria. The first step of nitrification is mediated by Ammonia Oxidizing Bacteria (AOB) and the functional response of AOB is influenced by substrate availability. Livestock manures are enriched with essential nutrient elements having pronounced effect in increasing organic contact of the soil sediment in aquaculture pond. So, input of organic manure such as poultry litter provides major source of macronutrients and also produces more substrate for AOB by enhanced degradation of organic matter. Although excess input of organic matter may produce deleterious effect due to accumulation of toxic nitrogen species such as ammonia and nitrite. Greater abundance of AOB is beneficial for subsequent transformation of ammonia into valuable by-products. So, the present study was conducted to establish a cost effective scientific protocol for administration of poultry litter in fish pond with special reference to the abundance of AOB. Weekly application of poultry litter at a dose of 50 Kg ha-1 day-1 with bimonthly lime application at a dose of 37.5 Kg ha-1 month-1 was found to be beneficial for fish ponds. The study also explained the impact of the abundance of AOB on absolute growth rate of fish.
Ammonia oxidizing bacteria, absolute growth rate, poultry litter and fish growth
Paul I, Panigrahi A. K, Chatterjee S, Datta S. Response of Differential Application Frequency of Poultry Litter on Mineralization Potential in Fish Culture Tanks with Special Reference to the Abundance of Ammonia Oxidizing Bacteria and Fish Growth. Biosc.Biotech.Res.Comm. 2020;13(2).
Paul I, Panigrahi A. K, Chatterjee S, Datta S. Response of Differential Application Frequency of Poultry Litter on Mineralization Potential in Fish Culture Tanks with Special Reference to the Abundance of Ammonia Oxidizing Bacteria and Fish Growth. Biosc.Biotech.Res.Comm. 2020;13(2). Available from: https://bit.ly/2BFU5N0
Copyright © Paul et al., This is an open access article distributed under the terms of the Creative Commons Attribution License (CC-BY) https://creativecommns.org/licenses/by/4.0/, which permits unrestricted use distribution and reproduction in any medium, provide the original author and source are credited.
INTRODUCTION
Nitrogen is the prime regulating nutrient of aquaculture pond which greatly influences the productivity of aquatic ecosystem. Availability of nitrogen in aquatic system depends upon the nitrogen mineralization. Nitrification is the crucial step of nitrogen mineralization for nitrogen cycling in aquatic environment (Lu et al., 2015). Bacterial dynamics regulate the chemical transformation of organic nitrogen into simpler one through ammonification, nitrification and denitrification. In the first step of nitrification, ammonia-oxidizing bacteria (AOB) plays the pivotal role for oxidation of ammonia to nitrite which is subsequently, oxidized to nitrate by nitrite-oxidising bacteria (NOB) (Kim et al., 2005; Abeliovich, 2006; Kumari et al., 2011; Daims et al., 2016, Ghosh et al 2019).
Ammonia accumulation beyond the threshold level is detrimental to aquatic life depending on the pH of the water body (Hargreaves, 1998). In the aquatic environment, ammonia can be utilized by phytoplankton directly or it can be oxidized by ammonia-oxidizing microorganisms (Ebeling et al., 2006) to be transformed into valuable by-product. Very low proportion of nitrifiers (AOB and NOB) leads to nitrogen toxicity in the system (Jiao et al., 2009). Aquaculture ponds in which inorganic fertilisers are applied for rapid solubilisation have inadequacy in essential nutrients and may exerts untoward effects on soil structure, composition, micro-flora, macro-flora and many other characteristics of the pond ecosystems (Jana et al., 2001b). However, organic manures are rich in both macro and micro nutrients that enrich the organic matter content of pond soil (Jana et al., 2001a) and incorporation of animal wastes in the aquatic system increase trophic status of ponds there by enhance fish production (Orhibhabor and Ansa, 2006). A minor portion of livestock manure applied to the aquaculture pond can be directly consumed by fish, and the remaining portion release nutrients enhance the growth of photosynthetic organisms (Little and Edwards, 1999) as the excreta is enriched with nutrient of recovered 72-79% of Nitrogen (N), 82-92% of Potassium (K) and 61-87% of Phosphorus (P) in feed given to animals (Singh et al., 2014 Ghosh et al 2019).
The litter is very useful fertilizer for the fish farming ponds as it is loaded with crucial nutrients such as nitrogen, phosphorus, potassium (Gupta et al., 2012) and different trace elements, such as Cu, Zn and As (Bolan, 2010). Digestive tracts of poultry birds are short and therefore 80% of chicken manure may remain as undigested feed-stuff (Chen, 1981) which may contain about 20-30% total protein (Pudadera et al., 1986). Intensification of the macronutrients may lead to stressed condition to aquatic lives with deterioration of water and sediment qualities. Hence, organic manure should be applied in fish ponds at proper doses to promote fish production (Jhingran, 1995) because application of excess nitrogen in the form of fertilizer may have adverse effects on water quality by the accumulation of toxic nitrogenous compounds such as ammonia and nitrite. That can be controlled by maintaining the optimal environment for the proliferation of nitrifying bacteria which will cause removal of the ammonium nitrogen (Shan and Obbard, 2003). Although fish cultures under the practice of integrated poultry-fish farming system are recommended to be safe for human consumption (Oribhabor and Ansa, 2006). Poultry litter input at a dose of 50 kg ha-1 day-1 keeps the system conducive for fish farming (Tamuli, 2006). Magnitude of the abundance of bacteria highly depends on the time taken for mineralization of the applied organic matter. Taking this into consideration, the present study was carried out to find out a rational and scientific protocol for application of poultry litter in fish ponds.
The present investigation was carried out on Labeo bata). It was selected for the present study because of its wide acceptability in India due to its good taste, satisfactory growth rate, omnivorous feeding habit, very well growth rate in shallow waters (Ghosh et al., 2019) and availability of artificially propagated seed. The experiment was conducted to ascertain the optimal mode of application of poultry litter (daily, weekly and monthly) with a dose of 50 kg ha-1 day-1 to obtain maximum abundance of AOB thereby enhancing the nitrogen cycling and growth rate of Labeo bata for sustained biological productivity of fish ponds.
MATERIAL AND METHODS
A120-day experiment was conducted with 3 different application frequencies (monthly, weekly and daily) in twelve tanks to find out the most effective mode of application of poultry litter with special reference to the AOB abundance during January 02 – April 30, 2016 in Gayeshpur, Nadia West Bengal (22˚58̍7.788̎ N, 88˚29̍44.556̎ E). Twelve circular tanks with water holding capacity of 300L were selected for the experiment (three replication for each) as control (C) with no organic input, treatment 1 (T1) with monthly input of poultry litter, treatment 2 (T2) with weekly input of poultry litter and treatment 3 (T3) with daily input of poultry litter. Each of the tanks were provided with virgin alluvial soil base of 15 cm and filled with ground water, 40 days prior to the experiment. After initial liming to maintain the water pH, poultry litter was added to each tank for manuring and 15 well acclimatized fish fingerlings (Labeo bata) were stocked in each tank. Previously selected dose of poultry litter (50 Kg ha-1 day-1) through a pilot study was preferred as the optimal dose of application for the present experiment with bimonthly lime application of 37.5 Kg ha-1 month-1 (Table:1).
On day 0 of the experiment, treatment specific poultry litter was applied for the 1st time and samples were collected after manuring. Then the treatment specific poultry litter application frequency (monthly, weekly and daily) was followed all throughout. Samples were collected prior to poultry litter application on the day of sampling during remaining period of the experiment. The samples were collected at fixed hour (8.00-9.00a.m) of the day during the study period from 3 places of the tank to create a homogeneous mixture of sample of water as well as of sediment.
For microbial study aliquots were prepared with serial dilution of 10-2 – 10-4 for sediment samples. For sediment sample a homogeneous sediment suspension was prepared by mixing 1 g of the wet soil with 99 mL sterile distilled water. Then the aliquot dilutions were subjected to pour plate technique for microbial analysis. Selective medium was prepared for the isolation of AOB from sediment samples following standard methodology (Drews, 1974). Composition of the medium was as follows (g L-1): ammonium sulphate, 1.0; potassium hydrogen phosphate (K2HPO4), 0.5; sodium chloride, 2.0; magnesium sulphate, 0.2; ferrous sulphate, 0.05; calcium carbonate, 6.0; cresol red (0.5%), 0.1; agar, 15 and a volume of 1L medium was prepared with adding distilled water. Mostly abundant bacterial species were subjected to SEM (Scanning Electron Microscopy) analysis to produce a magnified image of those particular organisms for further study (Photograph: 1 & 2).
Physico-chemical parameters (viz. pH, alkalinity, free CO2, NH4-N, NO2-N, NO3-N and PO4-P) of the surface water samples were monitored following standard methods (APHA, 1995). Dissolved oxygen (DO) and chemical oxygen demand (COD) were determined by standard methodology of Wetgel & Likens (1991) and Golterman et al. (1978), respectively. Primary productivity was monitored following dark and light bottle method (Vollenweider, 1974). All the fish from each tank were harvested at the end of 120 days and length and weight of the 10 fish from each treatment were recorded. Absolute growth rate and specific growth rate of Labeo bata were measured using the formula of: ∆W= (Wt – Wi)/ t and SGR=(logWt – logWi)×100/t respectively, where Wi is the initial weight, Wt is the final weight and t is days on trial (Lugert et al., 2014).
Observed data were statistically evaluated (SPSS, 20). To determine the treatment difference minutely, one way analysis of variance (ANOVA) was performed among treatments and days of sampling. The level of significance was accepted at p<0.05, p<0.01 and p<0.001.
Table 1. Experimental protocol
| a. Treatment variation | |||||
| Input | Experimental input | Control(C) | Treatment 1 (T1) | Treatment 2 (T2) | Treatment 3 (T3) |
| Poultry litter | Frequency of application | 0 | Monthly | Weekly | Daily |
| Dose of application | 0 | 45g | 11.25g | 1.5g | |
| b. Common input | |||||
| Input | Common input | Control(C) | Treatment 1 (T1) | Treatment 2 (T2) | Treatment 3 (T3) |
| Lime | Frequency of application | Bimonthly after sampling in all the experimental tanks | |||
| Dose of application | 37.5 Kg ha-1month-1 in all the experimental tanks | ||||
RESULTS AND DISCUSSION
Interactions between water quality parameters and AOB and that in turn with the biological productivity of the aquatic system were established by the experiment. In the present investigation water temperature and dissolved oxygen (DO) were higher in control tanks than the treatment tanks. On the other hand free CO2, carbonate alkalinity, bicarbonate alkalinity and chemical oxygen demand in all the treatments were greater than control (Table:2). Ammonia and nitrite accumulation beyond the assimilatory capacity of the particular system is detrimental for the system where as nitrate is the mostly preferred form. Ammonia can be utilized by phytoplankton as the preferred N substrate, only when it is present within the desirable limit (Hargreaves, 1998). The unionized form of ammonia (NH3) is much more toxic than ionized ammonia (NH4+) because of its capability to diffuse across cell membranes (Fernandes et al., 2010). Transition between the two forms of ammonia greatly depends on pH, at pH 7.3 about 1% get unionized; at pH 8.3 about 10% of ammonia get unionized and at pH 9.3 about 50% of ammonia get unionized (Hargreaves, 1998). In the present experiment pH of all the tanks ranged between7.59-8.54, thereby maintaining ammonia concentration supportive for fish growth. Both carbonate (CO32-) and bicarbonate (HCO3–) alkalinity ware observed in the treatment tanks whereas in case of control carbonate alkalinity was absent throughout the experiment. The net primary production in all treatments gradually increased with time in response to poultry litter load and was highest in T3 followed by T2, T1 and control.
Table 2. Mean+SE values of water quality parameters excepting pH (range values for pH) of control and treatments tanks throughout the period of investigation
| Parameters | Control | Treatment 1 | Treatment 2 | Treatment 3 |
| Temperature (˚C)
pH of water Free CO2 (mgL-1) Carbonate Alkalinity (mgL-1) Bicarbonate Alkalinity (mgL-1) *DO(mgL-1) *COD(mgL-1) Ammonium- Nitrogen (mgL-1) Nitrite- Nitrogen (mgL-1) Nitrate- Nitrogen (mgL-1) Ortho- phosphate (mgL-1) *NPP(mgC/m3/hr) |
22.84±5.35
7.63-8.14 16.56±6.99 0 242.21±14.83 10.67±0.68 31.21±4.50 0.203±0.0390 0.011±0.0074 0.344±0.0187 0.038±0.0109 201.25±12.65 |
21.69±6.17
7.73-8.42 28.74±4.78 12.33±2.13 273.38±21.02 10.08±0.71 45.12±9.94 0.2707±0.0726 0.0194±0.0104 0.4339±0.0596 0.0594±0.022 285.12±30.28 |
22.14±6.26
7.59-8.51 29.78±5.26 18.33±4.81 279.74±32.94 10.11±0.91 47.74±14.73 0.2741±0.0889 0.0193±0.0123 0.4431±0.0729 0.0603±0.0276 300.25±27.28 |
21.73±6.37
7.65-8.54 30.81±5.89 15.5±4.84 280.82±34.75 10.13±1.09 47.92±16.08 0.2711±0.0976 0.0194±0.0128 0.4483±0.0741 0.0597±0.0293 298.56 ±35.25 |
*DO=Dissolved Oxygen, COD=Chemical Oxygen Demand, NPP= Net primary productivity
Abundance of Ammonia Oxidizing Bacteria (AOB):Abundance of AOB in different treatments varied remarkably (Table: 3) with differential application frequencies of poultry litter @ 18,250 Kg ha-1 yr-1 (monthly, weekly, daily), throughout the 120 days period of experiment which were initially indifferent (P>0.05, ANOVA). From 4th to 120th day the AOB counts ranged between 9×10² cfu g-1 to 42×102 cfu g-1, 24×102 cfu g-1 to 103×102 cfu g-1, 18×102 cfu g-1 to 138×102 cfu g-1 and 17×102 cfu g-1 to144×102 cfu g-1 in control (C), treatment-1 (T1), treatment-2 (T2) and treatment-3 (T3) respectively. The average count was maximum (68.79×10² + 40.63×10² cfu g-1) in T3, followed by T2 (67.12×10²+ 38.78×10² cfu g-1), T1 (54.51×10²+ 21.40×10² cfu g-1) and lowest in control (20.36×10²+ 9.22×10² cfu g-1). Abundance of AOB within the range 780-2325 cells g-1 in sediment was reported by Jana and Roy (1985). Each AOB contains two or three amoA gene copies which code for the enzyme ammonia monooxygenase. Ammonia monooxygenase catalyses the oxygenation of ammonia to hydroxylamine. Quantitative analyses for AOB by RtPCR reported that the concentrations of the AOB amoA gene in the freshwater aquaculture pond sediments ranged from 4.05±3.83×10⁴ to 3.11±1.65×10⁵ copy g-1 in China (Lu et al., 2015). In a constructed wetland amoA gene copy numbers of AOB in water samples during summer observed within the range of 5.3±0.6×10⁴ copy mL−1 to 8.1±0.5×10⁶ copy mL−1(Sims et al., 2012). Although the systems as well as methodology ware different but all the study concluded more or less similar range of AOB population.
Variability of AOB counts in all the treatments and control group were changed remarkably as time progressed. Temporal variation of AOB count was highest (8.01 folds) in T3, followed by T2 (7.69 folds), T1 (5.55 folds) and lowest (2.53 folds) in C during the period of investigation. There was continuous increase in the population of AOB in T1, T2 and T3 from the initial day while lowest count of AOB was observed on 21st day of experiment in C. On the other hand maximum count was observed on 75th day of experiment in T1, T2, T3 and on 60th day of experiment in C.
The experiment clearly revealed that counts of AOB were increased with time due to gradual increment of organic inputs (poultry litter) in all the treatments whereas in control it was decreased until 21st day of the experiment and increased thereafter. In T1, administration of the monthly dose in a single application contributed significantly higher concentration of AOB until 15th day and then gradually declined up to 30th day and again increased subsequently as time progressed with the increment of organic input. On the other hand as split doses were applied in T-2 and T-3, they received continuous supply of organic matter and the abundance of AOB was increased with time throughout the period of experiment. While after 90th day, as the temperature raised that had a negative impact on the abundance of AOB and as a result the bacterial count declined up to 120th day in all the treatment tanks and also in control.
On 4th day there were significant differences between the C & T1 (P<0.01, ANOVA), C & T2 (P<0.05, ANOVA) and C & T3 (P<0.05, ANOVA). During the first few days population of AOB in T2 and T3 were much lower than T1 and the degree of differences were maximum on 11th and 15th days (P<0.01, ANOVA) while T2 and T3 were mostly alike (P>0.05, ANOVA). On 21st day for the 1st time after beginning, there were no significant (P>0.05, ANOVA) differences between T1, T2 and T3. On 30th day, the abundance of AOB was changed as lime was applied on day 11 which caused decrease of AOB in T1 until the 2nd monthly application of poultry litter. On the other hand T2 and T3 received continuous supply of organic manure at weekly and daily intervals, respectively.
That is why the abundance of AOB in T2 and T3 exceeded the count of T1 on day 30. After 60th day even after manure application T1 failed to reach the AOB abundance of T2 and T3 and the magnitude of difference increased significantly (P<0.01, ANOVA) up to 120th day of experiment. AOB population of C was much lower than T1, T2 and T3 and the degree of difference (P<0.001, ANOVA) was increased day by day. The fact implies the impact of the application of poultry litter and the frequency of application in T2 and T3 were found to be beneficial over T1 (P<0.05, ANOVA). This suggests that weekly dose of the poultry litter application (T2) is indifferent from AOB abundance of daily dose (T3) in fish tanks but weekly application is beneficial and viable as it requires less labour and time.
Figure 1: Scanning electron microscopy of isolated AOB
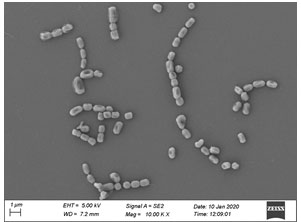
Figure 2: Scanning electron microscopy of isolated AOB
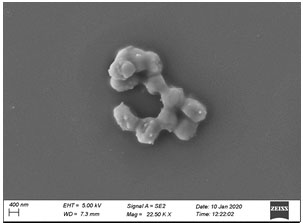
Table 3. Mean+SE values of AOB abundance in control and treatment tanks in different days of sampling during the period of investigation
| Ammonia oxidizing bacteria(cfu×102 g-1) | ||||
| Days | Control | Treatment 1 | Treatment 2 | Treatment 3 |
| 0 | 15.67±2.05 | 16.67±1.25 | 17.33±1.25 | 17±0.82 |
| 4 | 13.00±1.63 | 26.67±2.05 | 19.67±1.25 | 18.67±1.25 |
| 7 | 13.33±2.49 | 34.33±2.49 | 24.33±2.49 | 23±1.63 |
| 11 | 12.67±1.25 | 43.00±3.27 | 28.67±1.70 | 26.67±2.05 |
| 15 | 10.67±1.25 | 63.33±4.9 | 36.67±2.05 | 38.33±2.62 |
| 21 | 10.00±0.82 | 52.00±3.74 | 45.00±1.63 | 48.00±2.16 |
| 30 | 22.67±3.86 | 48.33±2.49 | 86.67±7.76 | 90.33±5.73 |
| 45 | 35.00±2.45 | 78.00±5.10 | 97.67±5.44 | 110.33±2.87 |
| 60 | 39.67±1.70 | 73.67±4.99 | 117.33±5.31 | 120.33±4.99 |
| 75 | 28.00±2.45 | 92.67±8.58 | 133.33±4.64 | 136.33±5.44 |
| 90 | 22.67±1.25 | 70.67±3.68 | 101.33±7.36 | 102.00±5.35 |
| 105 | 21.00±2.94 | 64.00±6.16 | 84.00±4.08 | 83.00±3.27 |
| 120 | 20.67±2.49 | 45.33±5.44 | 80.67±2.87 | 80.33±6.02 |
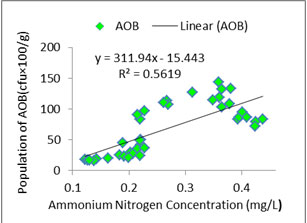
Interaction between water quality and AOB:As ammonia oxidizers obtain energy by oxidation of ammonia so ammonia concentration is likely to be correlated with AOB abundance (Jana and Roy, 1985). In the present study distribution pattern of AOB against treatment specific ammonia concentration was checked properly (Figures: 1, 2, 3, 4). In the present study, all the species of nitrogen (Ammonium-N, Nitrate-N, Nitrite-N) were positively correlated (p<0.05) with AOB abundance. Highest concentrations of ammonium-N and nitrate-N were observed in T3 followed by T2, T1 and control whereas highest concentration of nitrite-N was seen in T2 followed by T3, T1 and control. Concentrations of the various species of nitrogen were more or less similar in T2 and T3 which corroborated the similar findings regarding the abundance of AOB. Probable reason of such distribution pattern of nitrogen is the application difference of poultry litter among the systems. Although doses were same for T1, T2 and T3 but split dose of application resulted in continuous supply of the substrate in the system where as in case of monthly application substrate level started to fall after 15 to 21 day. The control system received no organic input and the only source of nitrogen was fish excreta and dead parts of plankton. So, ammonium-N, nitrate-N and nitrite-N were much less in control tanks than the treatments. In addition to that as the control systems did not have any source of phosphate so ortho-phosphate ranges of the control tanks were negligible throughout the experiment.
Figure 1a: Relationship between ammonium nitrogen concentration and abundance of AOB in control tanks
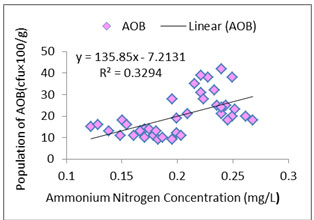
Figure 2a: Relationship between ammonium nitrogen concentration and abundance of AOB in Treatment 1

Figure 3a: Relationship between ammonium nitrogen concentration and abundance of AOB in Treatment 2
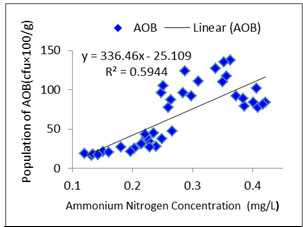
Figure 4a: Relationship between ammonium nitrogen concentration and abundance of AOB in Treatment 3
Fish growth:Absolute growth rate was significantly different (P<0.001, ANOVA) among control and treatments with highest specific growth rate in T2 followed by T3, T1 and lowest in control (Table: 4, Figure: 5). Specific growth rate of the fish also followed the similar pattern (Figure: 6). Specific growth rate of Labeo bata was observed within the range of 1.24±0.07 to 1.64±0.09 in an investigation with formulated fish feed (Mondal et al., 2015). The present study also postulates the similar specific growth rate except the control system.
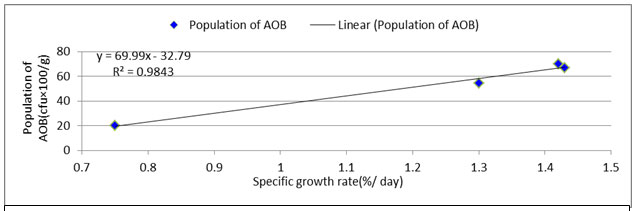
Average specific growth rate of the C, T1, T2 and T3 were 0.75±0.08 %.d-1, 1.30±0.09 %.d-1, 1.43±0.10 %.d-1 and 1.42±0.10 %.d-1 respectively. The control system was devoid of nutrient supply as no organic input was there, which affected the fish growth. While T2 and T3 were mostly alike just like as the other parameters. Specific growth rate of Labeo bata was observed to be positively correlated (Figure: 7) with the abundance of AOB. That clarifies the fact of considerably higher growth rate in treatments according to their bacterial abundance and other nutrient parameters.
Table 4. Growth performance of Labeo bata in treatment and control tanks
| Parameters | Control | Treatment 1 | Treatment 2 | Treatment 3 |
| Mean initial weight (g) | 5.23±0.18 | 5.23±0.18 | 5.23±0.18 | 5.23±0.18 |
| Final weight (g) | 9.87±2.09 | 46.11±12.92 | 66.79±15.35 | 64.84±15.59 |
| Mean initial length (cm) | 1.23±0.15 | 1.23±0.15 | 1.23±0.15 | 1.23±0.15 |
| Final length (cm) | 10.52±0.82 | 16.71±1.37 | 18.68±1.49 | 18.49±1.51 |
| *AGR (d-1) | 0.07±0.02 | 0.37±0.11 | 0.55±0.13 | 0.53±0.13 |
| *SGR (%.d-1) | 0.75±0.08 | 1.30±0.09 | 1.43±0.10 | 1.42±0.10 |
| Survival rate (%) | 82.22% | 88.89% | 93.33% | 91.11% |
*SGR=Specific growth rate, *AGR=Average growth rate.
Figure 5: Absolute growth rate of fish in control and treatments tanks
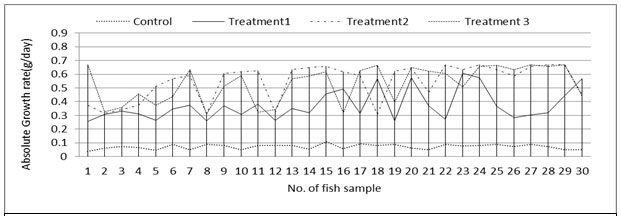
Figure 6: Specific growth rate of fish in control and treatments tanks
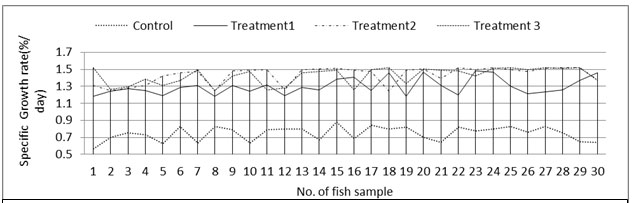
Figure 7: Relationship between treatment specific AOB abundance and Specific growth rate of Labeo bata
CONCLUSION
It is evident from the investigation that AOB population developed maximally when all the Species of nitrogen (Ammonium-N, Nitrate-N and Nitrite-N) is relatively high. That is because of substrate dependency of AOB on ammonia and subsequent productions of nitrite which can be further get utilized by the nitrite oxidizing bacteria of the system. As a result increment of nitrite in the system can cause a better growth of planktons thereby enhancing fish growth. Previously it was seen that split dose of fertilizer is beneficial over a single annual dose (Jana et al., 2001a). The present study also revealed that split application of poultry litter at weekly intervals is beneficial over the application of poultry litter at monthly intervals. No remarkable difference regarding fish growth, water quality and AOB abundance were seen between daily and weekly application as both the systems had a continuous nutrient supply. In case of monthly application of poultry litter the nutrient gets exhausted after certain time and so that results into a sudden drop after 21 day in each monthly cycle.
On the other hand as AOB is highly temperature sensitive so the density of AOB drops in high temperature even after having plenty of substrate in the systems. Excess ammonia can be removed from the system by using nitrifying bacteria (Krishnani et al., 2009) thereby maintain the nitrogen budget of the system. In the present experiment positive relation between the abundance of AOB and specific growth rate of Labeo bata contributes to the similar finding of maintaining the nitrogen budget thereby enhancing fish growth. After all AOB needs our special attention for further use in aquaculture to increase biological productivity. In addition to that optimum dose and mode of poultry litter application in fish farming ponds by means of integrated farming can be taken as a useful tool for sustained development and income generating practice for village people. So beside scientific findings this study also have a good social impact for betterment of the economic status of rural people.
Acknowledgements
This work was supported by the Grant-in-Aid F. No. 890 (Sanc.)/ST/P/S&T/1G-1/2013 dt.15.01.2016 from the Department of Science, Technology& Biotechnology, Govt. of West Bengal, Kolkata to (SD). IP is grateful to the Department of Science, Technology & Biotechnology for providing fellowship for the work. The authors are thankful to the University of Burdwan, Burdwan, West Bengal for providing necessary facilities for SEM analysis.
REFERENCES:
Abeliovich, A.2006. The nitrite oxidizing bacteria. In: Prokaryotes (eds. Dworkin, M., Falkow, S., Rosenberg, E., Schleifer, K.H., Stackebrandt, E.), pp. 861–872. Springer, New York. https://doi.org/10.1007/0-387-30745-1_41
APHA. 2005. Standard methods for the examination of water and wastewater, 21st Ed. American Public Health Association/ American Water Works Association/ Water Environment Federation, Washington, DC, USA.
Bolan, N., Szogi, A., Chuasavathi, T., Seshadri, B., Rothrock, M and Panneerselvam, P. 2010. Uses and management of poultry litter. World’s Poultry Science Journal 66:673-698. https://doi.org/10.1017/S0043933910000656
Chen, Y.1981. Chicken farming in integrated fish farming. Regional Aquaculture Lead Center Wuxi, China. 11:4 – 30.
Daims, H., Lücker, S and Wagner, M. 2016. A new perspective on microbes formerly known as nitrite-oxidizing bacteria. Trends in microbiology 24(9):699-712. https://doi.org/10.1016/j.tim.2016.05.004
Drews, G. 1974.MicrobiologischesPraktikum, New York, New York: Springer-Verlag.
Ebeling, J.M., Timmons, M.B and Bisogni, J.J. 2006. Engineering analysis of the stoichiometry of photoautotrophic, autotrophic, and heterotrophic removal of ammonia-nitrogen in aquaculture systems. Aquaculture 257:346–358. https://doi.org/10.1016/j.aquaculture.2006.03.019
Fernandes, S.O., Kulkarni, S.S., Shirodkar, R.R., Karekar, S.V., Kumar, R.P., Sreepada, R.A., Vogelsang, C. and Bharathi, P.A.L. 2010.Water quality and bacteriology in an aquaculture facility equipped with a new aeration system. Environmental Monitoring and Assessment 164(4):81-92. https://doi.org/10.1007/s10661-009-0876-y
Ghosh, T.K., Chauhana, Y.H and Mandala, R.N. 2019. Growth performance of Labeo bata (Hamilton, 1822) in freshwater and its acclimatization in brackish water with betaine as feed additive. Aquaculture 501:128–134. https://doi.org/10.1016/j.aquaculture.2018.11.020
Golterman, H.L., Clymo, R.S and Ohnstad, M.A.M. 1978. Methods for Physical and Chemical Analysis of Fresh Water, 2nd Ed. Blackwell Scientific Publications, Oxford, pp. 213.
Gupta, V., Rai, P.K and Risam, K.S. 2012. Indian Research Journal of Extension Education, Special Issue 2:49-54
Hargreaves, J.A. 1998. Review Nitrogen biogeochemistry of aquaculture ponds. Aquaculture, 166:181–212. https://doi.org/10.1016/S0044-8486(98)00298-1
Jana, B.B and Roy, S.K. 1985. Spatial and temporal changes of nitrifying bacterial populations in fish ponds of differing management practices. Journal of Applied Bacteriology 59:195-204. https://doi.org/10.1111/j.1365-2672.1985.tb03321.x
Jana, B.B., Chakraborty, P., Biswas, J.K and Ganguly, S. 2001(b). Biogeochemical cycling bacteria as indices of pond fertilization: importance of CNP ratios of input fertilizers. Journal of Applied Microbiology 90:733-740. https://doi.org/10.1046/j.1365-2672.2001.01299.x
Jana, B.B., Chatterjee, J., Ganguly, S and Jana, T. 2001(a). Responses of phosphate solubilizing bacteria to qualitatively different fertilization in simulated and natural fish ponds. Aquaculture International 9(1):17-34. https://doi.org/10.1023/A:1012594828876
Jhingran, V.G. 1995. Fish and Fisheries of India. Delhi: Hindustan Publishing Corporation.
Jiao, Y., Jin, W.B., Zhao, Q.L., Zhang, G.D., Yan, Y and Wan, J. 2009. Transformation of nitrogen and distribution of nitrogen-related bacteria in a polluted urban stream. Water Science and Technology 60(6):1597-1605. https://doi.org/10.2166/wst.2009.502
Kim, W.K., Cui, R and Jahn, D. 2005. Enrichment of ammonia-oxidizing bacteria for efficient nitrification of wastewater. Journal of Microbiology and Biotechnology 15(4):772–779.
Krishnani, K.K., Shekhar, M.S., Gopikrishna, G and Gupta, B.P. 2009. Sequence similarity based identification of nitrifying bacteria in coastal aquaculture for bioremediation predictability. Asian Fisheries Science 22(1):41-49.
Kumari, V., Rathore, G., Chauhan, U.K., Pandey, A.K and Lakra, W.S. 2011.Seasonal variations in abundance of nitrifying bacteria in fish pond ecosystem. Journal of Environmental Biology 32:153-159.
Little, D.C and Edwards, P. 1999. Alternative strategies for livestock-fish integration with emphasis on Asia, AMBIO: A Journal of the Human Environment 28(2): 118-124.
Lu, S., Liao, M., Xie, C., He, X., Li, D., He, L and Chen, J. 2015. Seasonal dynamics of ammonia-oxidizing microorganisms in Freshwater aquaculture ponds. Annals of Microbiology 65:651–657. https://doi.org/10.1007/s13213-014-0903-2
Lugert, V., Thaller, G., Tetens, J., Schulz, C and Krieter, J. 2014. A review on fish growth calculation: multiple functions in fish production and their specific application. Reviews in Aquaculture 6:1–13. https://doi.org/10.1111/raq.12071
Mondal, K.; Kaviraj, A and Mukhopadhyay, P.K. 2015. Growth performance of Indian minor carp Labeo bata fed varying inclusions of fermented fish-offal and mulberry leaf meal based-diets. Iranian Journal of Fisheries Sciences 14(3) 567-582
Oribhabor, B.J and Ansa, E.J. 2006. Organic waste reclamation, recycling and re-use in integrated fish farming in the Niger Delta. Journal of Applied Sciences and Environmental Management 10(3):47-53. https://doi.org/10.4314/jasem.v10i3.17319
Pudadera, B.J.J, Corre, K.C., Coniza, E and Taleon, GA. 1986. Integrated farming of broiler Chicken with fish and shrimp in brackish water ponds (eds. Macleen, J.L.; Dion, L.B.; Hosillos, L.V.) pp. 141-144. The First Asian Fisheries Forum. Asian Fisheries Society, Manila, Philippines.
Shan, H and Obbard, J.P. 2003. Ammonia removal from freshwater using nitrifying bacteria enriched from a seawater aquaculture pond. Biotechnology letters 25(17):1469-71.
Sims, A., Gajaraj, S and Hu, Z.Q. 2012. Seasonal population changes of ammonia-oxidizing organisms and their relationship to water quality in a constructed wetland. Ecol. Eng. 40:100–107
Singh, U.P., Bisht, H.C and Pandey, N.N. 2014. Poultry cum fish culture as an effective tool for environmentally sustainable and economically viable technology for the mid hills. International Journal. 2(2):854-60.
Tamuli, K.K. 2006. Integrated Poultry— Fish farming system, a training manual on polyculture and integrated fish farming, Assam Agricultural Competitiveness Project (AACP).
Vollenweider, R.A. 1974. A manual on methods for measuring primary production in aquatic environments. 2nd Ed. Blackwell Scientific Publications, Oxford, pp. 225.
Wetzel, R.G and Likens, G.E. 1991. Limnological Analysis. 2nd Ed. Springer Verlag, New York, pp. 391.

