Department of Electrical and Electronic Engineering Islamic University of Technology (IUT), Dhaka, Bangladesh
Corresponding author email: mirzamuntasir@iut-dhaka.edu
Article Publishing History
Received: 18/11/2020
Accepted After Revision: 21/03/2021
Diabetes Mellitus (DM) is considered as a heretical metabolic disorder and widely spread long standing slow poison which poses a great threat to human health. Faster and accurate prediction of diabetes is a dire need and Machine Learning (ML) can play a pivotal role in terms of enhancing medical health technology and develop a e-healthcare system. In this regard, ten ML algorithms have been studied comprehensively and they are implemented by Jupyter Notebook. Hence, The ML models are trained with dataset of Kaggle machine learning data repository of Frankfurt hospital, Germany. Effective data processing method is proposed using 5-fold cross validation method to achieve stable accuracy. However, hyper-parameter tuning technique is employed with a view to achieving better performance from the ML models. After rigorous simulation, Gaussian Process (GP) emerged as the best performing algorithm which is proposed as the most efficient classifier with an accuracy of 98.25%. However, Random Forest (RF) and Artificial Neural Network (ANN) displayed accuracy of 97.25% and 96.5% respectively which are quite satisfactory. Hence, the performances of the ML models are assessed with different metrics like Accuracy, Sensitivity, Precision, F1-score, Specificity and ROC_AUC and thus, a comparative analysis among all the ML models are portrayed graphically. Efficient prediction of Diabetes by ML algorithms can significantly contribute in decreasing the annual mortality rate specially in developing countries like Bangladesh. Therefore, this study can meaningfully assist the healthcare professionals in the process of proper and faster treatment of Diabetes Mellitus and thus, an efficient e-healthcare system can be established in future.
Diabetes Mellitus, Machine Learning (ML), cross validation, hyper-parameter tuning, e-healthcare.
Nishat M. M, Faisal F, Mahbub M. A, Mahbub M. H, Islam S, Hoque M. A . Performance Assessment of Different Machine Learning Algorithms in Predicting Diabetes Mellitus. Biosc.Biotech.Res.Comm. 2021;14(1).
Nishat M. M, Faisal F, Mahbub M. A, Mahbub M. H, Islam S, Hoque M. A Performance Assessment of Different Machine Learning Algorithms in Predicting Diabetes Mellitus. Biosc.Biotech.Res.Comm. 2021;14(1). Available from: <a href=”https://bit.ly/2YRqBEs”>https://bit.ly/2YRqBEs</a>
Copyright © Nishat et al., This is an open access article distributed under the terms of the Creative Commons Attribution License (CC-BY) https://creativecommns.org/licenses/by/4.0/, which permits unrestricted use distribution and reproduction in any medium, provide the original author and source are credited.
INTRODUCTION
Diabetes mellitus (DM) is considered as a cluster of metabolic disorders and appears to be a common disease among mass people nowadays imposing a lot of complications in human body. Insulin Dependent Diabetes Mellitus (IDDM) or Type-1 diabetes is witnessed among children because of the genetic disorders where the body fails to produce adequate insulin. However, ‘Type 2’ diabetes is normally observed in middle-aged people for most cases where body is not able to use the insulin produced inside or it fails to produce adequate insulin or both and it termed as “Non-Insulin-Dependent Diabetes Mellitus” (NIDDM). On the other hand, gestational diabetes is commonly seen among 2-10% pregnant women where women may not have diabetes prior to pregnancy or can develop ‘Type 2’ diabetes after the pregnancy (Lee et al., 2018).
However, Diabetes Mellitus (DM) is affected by various factors like pregnancies, blood pressure, glucose, skin thickness, BMI, diabetes pedigree function, age but amongst all, the prime reason is blood sugar level. If diabetes remains untreated and unidentified many complications occur, for instance, various organs like eyes, teeth, legs, tiny blood vessels, kidneys, liver, heart and nerves get affected which results in various acute and chronic diseases in course of time (Yoon et al., 2017). In 2019, WHO estimates that worldwide 463 million people have diabetes with ‘Type 2’ diabetes making up about 90% of the cases and the number of cases may increase to 642 million by 2040. Rates are alike in women and men and this disease leads to a person’s risk of early death. The WHO also states that approximately 4.2 million deaths occurred in 2019 due to diabetes and globally it is the 7th leading cause of death (Saeedi et al., 2020).
In Bangladesh, most of the people are not aware of deadly clutch of diabetes which becomes rampant in course of time. Therefore, early detection can pave the way to ensure better treatment for the patients and assist the healthcare professionals in this regard.Machine learning algorithms are being employed in different times by many researchers in predicting diabetes. A hybrid Neural Network System was developed by implementing Artificial Neural Network (ANN) and Fuzzy Neural Network (FNN) for diabetes diagnosis and an accuracy of 84.2% was attained (Kahramanli and Allahverdi, 2008). On the other hand, an approach was proposed that combined the Least Square Support Vector Machine classifier with Generalized Discriminant Analysis to better the accuracy of diabetes classification, (Polat et al., 2008).
Here, the GDA technique was used for feature reduction and then LS-SVM was applied for modeling. Using 10-fold cross validation, this combination of two methods depicted 82.05% accuracy. However, a classification system is manufactured for diabetes using the Bayes network, obtaining an accuracy rate of 72.3% (Guo et al., 2012). Again, a research is conducted on diabetes prediction exploiting real-time dataset and different ML models are implemented (Meng et al., 2013). This study achieved its highest accuracy of 77.87% for the decision tree model (C5.0), 76.13% of accuracy in regression model and 73.23% in ANN model. Furthermore, a hybrid method was implemented utilizing NSGA-II technique for diabetes detection and 86.13% accuracy was obtained (Zangooei et al., 2014). On the other hand, a unique system is designed for diabetes classification employing an adaptive network-based fuzzy inference system and 82.3% accuracy was obtained (Sagir and Sathasivam, 2017).
It is observed that the above-mentioned researches contributed in employing various ML techniques in predicting diabetes but none of them came up with an accuracy more than 90%. So, with the advancement of modern technology, ML algorithms holds the promise to assist in providing more accurate predictions and satisfactory results than current practices which leverages the healthcare system and saves healthcare expenditures. The key objective of this study is to develop ML models and investigate their performances to predict diabetes with promising outcomes. As it is seen that achieving higher accuracy is always a challenge for the ML researchers. In this regard, a good diabetes dataset is explored and promising outcomes are observed with the assistance of ML algorithms.
Hence, several machine learning algorithms are studied extensively such as Logistics Regression (LR), K-Nearest Neighbours (KNN), Support Vector Machine (SVM), Naive Bayes (NB), Adaboost (AdB), Random Forest (RF), Stochastic Gradient Descent (SGD), Gradient Boosting (GB), Gaussian Process (GP) and Artificial Neural Network (ANN) and an investigative and comparative analysis is portrayed in the forthcoming sections. The performance metrics of different algorithms were explored by various standards, such as accuracy, sensitivity, precision, F1-score, specificity and ROC-AUC. Therefore, this kind of comprehensive analysis among all the ML models with diabetes dataset will shape the way of developing a computer aided healthcare system which is direly needed specially in developing countries like Bangladesh.
MATERIAL AND METHODS
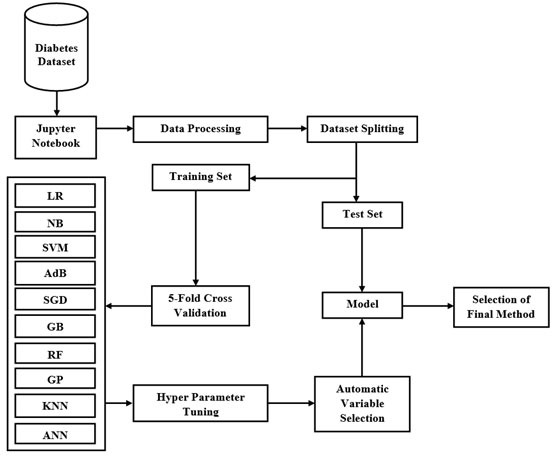
Data Preprocessing :The proposed approach consists of three basic steps. Firstly, the Kaggle dataset was loaded into pandas for data preprocessing (Kaggle Diabetes Dataset, Frankfurt hospital, Germany). However, further data preprocessing is accomplished on the proposed dataset with 5-fold cross validation. Secondly, the preprocessed dataset is fitted into our proposed ten different machine learning models with hyper parameter tuning. Lastly, the models are tested and various performance metrics like accuracy, precision, sensitivity, specificity, F1 score and ROC-AUC are evaluated and overall comparative analysis is carried out. In this work, this dataset of diabetes has been taken from the hospital Frankfurt, Germany. The data set contains 2000 instances of observations of patients consisting of 9 attributes with no missing values. In this work, 1600 samples are selected as training set and 400 samples chosen for test set. The details of the attributes of the dataset is depicted in Table 1.
Table 1. The attributes of dataset
| No | Attribute | Description | Range of value | Type |
| 1 | Pregnancies | How many times | 0 – 17 | Numeric |
| 2 | Glucose | Glucose value | 0 – 199 | Numeric |
| 3 | Blood Pressure | Blood Pressure level | 0 – 122 | Numeric |
| 4 | Skin Thickness | Skin Thickness value | 0 – 110 | Numeric |
| 5 | Insulin | Insulin Level | 0 – 744 | Numeric |
| 6 | BMI | Mass | 0 – 80.6 | Numeric |
| 7 | Diabetes Pedigree Function | Family History | 0.08 – 2.42 | Numeric |
| 8 | Age | Age of diabetic patient | 21 – 81 | Numeric |
| 9 | Outcome | Binary (Yes or No) | 0 – 1 | Nominal |
From the dataset, it is observed that some attributes like glucose, blood pressure, skin thickness, insulin and BMI have zero value but this is not possible practically. So, those are treated as missing data and they are replaced by the mean value of the specific attribute column having the missing value. From the Table 1, it is evident that some of the values of attributes of the dataset are not on the same scale which might have caused some issues in the machine learning models. As lots of the machine learning models are based on Euclidean distance, the higher range attributes dominated the lower range attributes. Therefore, the entire attribute should be in same scale. Some observations of scaled attributes are shown in Table 2.
Table 2. Observation of preprocessed scaled dataset
| No | Pregnancies | Glucose | Blood Pressure | Skin Thickness | Insulin | BMI | Diabetes Pedigree Function | Age |
| 1 | 2.540 | -0.014 | 0.466 | -0.233 | -0.715 | -0.701 | -0.650 | 2.507 |
| 2 | 4.065 | 1.293 | 0.160 | 1.243 | 0.294 | 1.044 | 1.043 | 1.211 |
| 3 | -0.814 | -0.606 | 0.262 | -1.280 | -0.715 | 0.874 | -0.547 | 0.780 |
| 4 | -0.204 | -0.201 | -0.144 | 1.120 | 0.525 | 0.704 | -0.981 | -0.428 |
| 5 | 1.625 | 1.324 | 0.466 | -1.280 | -0.715 | 0.062 | -0.987 | 1.039 |
Figure 1: Proposed workflow diagram
Study of Machine Learning Algorithms:The machine-learning algorithms used in this paper are briefly described below:
Logistics Regression (LR):Logistic regression (LR), a widely used model in machine learning utilizes a logistic function to classify a binary dependent variable over one or more independent variables or features (Maniruzzaman et al., 2019). The main advantages of this type of supervised machine learning algorithm is that it can handle nonlinearity and it is easy to implement and very efficient to train. Combining linear regression line and sigmoid function, the best fitting curve can be attained for dataset. The following equations are used in this process:
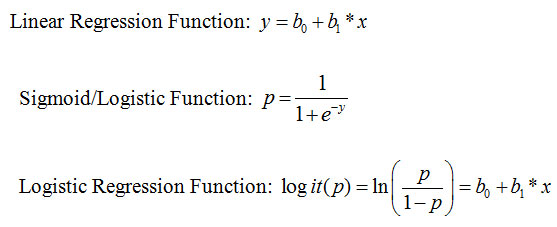
Where, p is the dichotomous (binary) output which is the result of weighted sum of input features x. If the probabilistic output is more than 0.5 line, the output is 1 otherwise the output is 0.
Naive Bayes (NB):Based on the Bayes Theorem, Naïve Bayes is appointed extensively in various classification problems (Balaji et al., 2020). This classifier is a probabilistic machine learning algorithm that can be implemented simply and the predictions made in real-time are quick and space efficient.
Bayes’ theorem:

Where,
P(A|B) = Probability of A occurring given event B has already occurred.
P(B|A) = Probability of A occurring given event B has already occurred.
P(A) = Probability of event A occurring.
P(B) = Probability of event B occurring.
Let, ‘X’ is a new data point, found P(A|X) and P(B|X). Then our classifier compares those two and decides X belongs to ‘A’ or ‘B’.
Support Vector Machine (SVM):Support Vector Machine, a commonly used classification technique which aims to classify data points by an appropriate hyper plane in a multidimensional space. The decision boundary line or the hyper plane is drawn, maintaining the maximum margin from the support vectors. SVM works proficiently as there is a margin of separation between classes and also more effective in high dimensional spaces. When dataset is not linearly separable mapping to a higher dimension to make the dataset linearly separable, nonlinear functions are used as kernel. So, polynomial kernel is applied as the hyper plane to get more accuracy and less over fitting than linear kernel (Djelloul and Amir, 2019).
For degree-d polynomials, the polynomial kernel is defined as,

Adaboost (AdB):Amongst Machine Learning algorithms, Boosting is an ensemble learning method used to improve the prediction power. AdaBoost (Adaptive Boosting) is a sequential learning process where multiple decision tree models are used as weak learners (Li et al., 2019). All the models do not have equal weight for the final model. The hypothesis is obtained for each subset of the dataset and then combined to get a single better hypothesis. The compensation is done by varying the weights of data. AdaBoost is sensitive to noisy data. The final equation for classification can be represented as,

Stochastic Gradient Descent (SGD):Stochastic Gradient Descent (SGD) refers to descending of a slope to reach the lowest point called global minima on the structure by minimizing the cost function to update the weights (Talo et al., 2019). The equations used for Gradient descent:
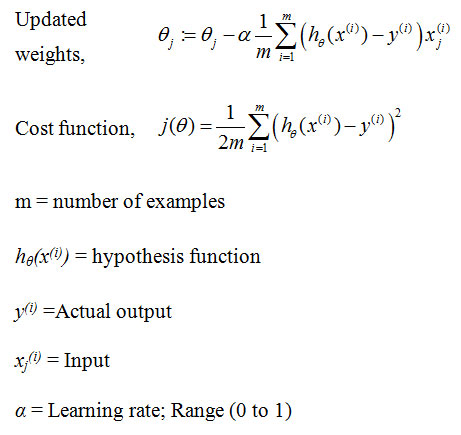
The main difference between Gradient Descent (GD) and Stochastic Gradient Descent is that the whole training data per epoch is used in GD whereas, in SGD, only single training example per epoch are employed to fine-tune the weight. Stochastic Gradient Descent helps to find overall global minima which is a faster process than Gradient Descent.
Gradient Boosting (GB):Gradient Boosting technique refers to technique where a prediction model is constructed in the form of an ensemble of weak prediction models, typically decision trees. The Gradient Boosting, an ensemble learning algorithm works on the principle of gradient decent (Chen et al., 2018). A base (weak) model is created and learned by optimizing the loss function. We are boosting base model with the help of sequentially adding several DT models, where we took last model’s residual value as next models predicted value to reduce the overall error. And with the help of learning rate (α) we reduce over fitting.
Random Forest (RF):In Machine Learning Bagging is an Ensemble Learning used to improve the prediction power (Javeed et al., 2019). Random Forest method which combines a lot of Decision Tree method and combines the idea of bagging and the random selection of features for each one of the trees from our dataset as a subset together. Taking the majority vote from the trees and deciding the classification based on that. And that power of numbers can help get rid of certain errors and certain uncertainties in our algorithm and make it more precise and one of the best learning algorithms. One of the major pros is that it can handle a huge amount of data proficiently.
Gaussian Process (GP):Gaussian process (GP), a nonparametric classification method is founded on Laplace approximation and Bayesian’ methodology (Lang et al., 2019). For approximating the non-Gaussian posterior by a Gaussian, Laplace approximation is used. Bayesian’ methodology undertakes some preceding distribution on the basic probability densities that promises some smoothness properties. Gaussian Process are a type of Kernel method, like SVMs, although they are able to predict highly calibrated probabilities, unlike SVMs. Hence it is a very effective classifier.
K-Nearest Neighbors (KNN):K-nearest neighbors (KNN) is one of the simplest supervised machine learning algorithms that can be deployed for both classification and regression analysis. KNN assumes the nearest data points in the feature space. It is based on feature similarity and classifies a data point based on how its neighbors are classified (Hossain et al., 2019). It uses Euclidean distance calculation to find the nearest data point (neighbor). The K-nearest neighbors of the new data point, according to the straight-line distance (also called the Euclidean distance) is a popular and familiar choice.

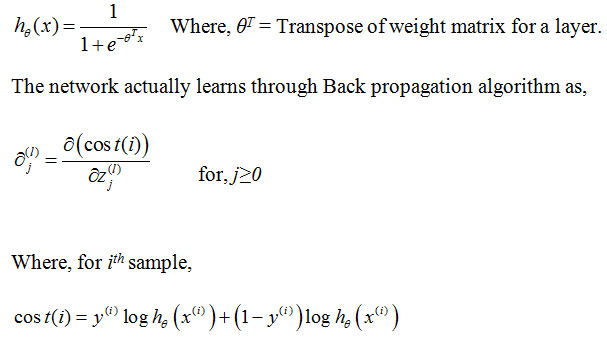
Artificial Neural Network (ANN):Artificial Neural Network (ANN) is an advanced method that mimics the human brain holding a notable promise in pattern recognition of huge datasets (Nasser and Abu-Naser, 2019). Here, layers of neurons are constituted which acts as the fundamental processing unit. Firstly, input layer is placed that takes the inputs from the dataset. Then, the output layer forecasts final outcome. However, the hidden layers stay between these two layers, which accomplishes most of the calculation compulsory for the network. Hence, the forward and backpropagation method are implemented iteratively and the cost functions are evaluated each time. The output of this layer is fed to the next layer and by this manner the data is propagated through the network and this is called Forward Propagation.
Then the cost function is calculated by actual output and the predicted output and back propagated through the network. This cycle of forward propagation and back propagation is iteratively performed with multiple inputs. This process continues until our weights are adjusted such that the network can predict the classification correctly. Some prime application of ANN is facial recognition, forecasting, music composition etc. In this paper, ANN is used as binary classifier. So, the same hypothesis function used in Logistic Regression is brought into action.
RESULTS AND DISCUSSION
After studying ten supervised machine learning techniques, they are implemented for the classification of diabetes disease samples and satisfactory performances are witnessed from the ML models. The corresponding confusion matrices are presented in Table 3.
Table 3. Confusion Matrices of all ML models
| Confusion Matrix
(LR) |
Predicted | ||
| True | False | ||
|
Actual |
True | 243 | 29 |
| False | 59 | 69 | |
| Confusion Matrix
(NB) |
Predicted | ||
| True | False | ||
|
Actual |
True | 230 | 42 |
| False | 55 | 73 | |
| Confusion Matrix
(SVM) |
Predicted | ||
| True | False | ||
|
Actual |
True | 271 | 1 |
| False | 62 | 66 | |
| Confusion Matrix
(AdB) |
Predicted | ||
| True | False | ||
|
Actual |
True | 237 | 35 |
| False | 50 | 78 | |
| Confusion Matrix
(SGD) |
Predicted | ||
| True | False | ||
|
Actual |
True | 210 | 62 |
| False | 44 | 84 | |
| Confusion Matrix
(GB) |
Predicted | ||
| True | False | ||
|
Actual |
True | 266 | 6 |
| False | 8 | 120 | |
| Confusion Matrix
(RF) |
Predicted | ||
| True | False | ||
|
Actual |
True | 266 | 6 |
| False | 5 | 123 | |
| Confusion Matrix
(GP) |
Predicted | ||
| True | False | ||
|
Actual |
True | 269 | 3 |
| False | 4 | 124 | |
| Confusion Matrix
(KNN) |
Predicted | ||
| True | False | ||
|
Actual |
True | 257 | 15 |
| False | 33 | 95 | |
| Confusion Matrix
(ANN) |
Predicted | ||
| True | False | ||
|
Actual |
True | 265 | 7 |
| False | 7 | 121 | |
The actual comparison among the studied ML models is evident from Table 4 based on various performance metrics like Accuracy, Sensitivity, Specificity, F1 score and ROC_AUC. All these metrics can be achieved with the assistance of confusion matrix. With the tuned configuration, Gaussian Process (GP) depicted the highest accuracy (98.25%) whereas the overall accuracy is above 75%. Besides Gaussian Process (GP), satisfactory accuracy is also witnessed in other algorithms like RF (97.25%), ANN (96.75%) and GB (96.50%).
Table 4. Performance metrics of all ML models
| Name of the algorithm | Accuracy (%) | Precision | Sensitivity | Specificity | F1 Score | ROC-AUC |
| LR | 78.00 | 0.704 | 0.539 | 0.893 | 0.610 | 0.716 |
| NB | 75.75 | 0.634 | 0.570 | 0.845 | 0.600 | 0.708 |
| SVM | 84.25 | 0.985 | 0.515 | 0.996 | 0.676 | 0.756 |
| AdB | 78.75 | 0.690 | 0.609 | 0.871 | 0.647 | 0.740 |
| SGD | 76.50 | 0.713 | 0.445 | 0.915 | 0.548 | 0.710 |
| GB | 96.49 | 0.952 | 0.937 | 0.976 | 0.944 | 0.958 |
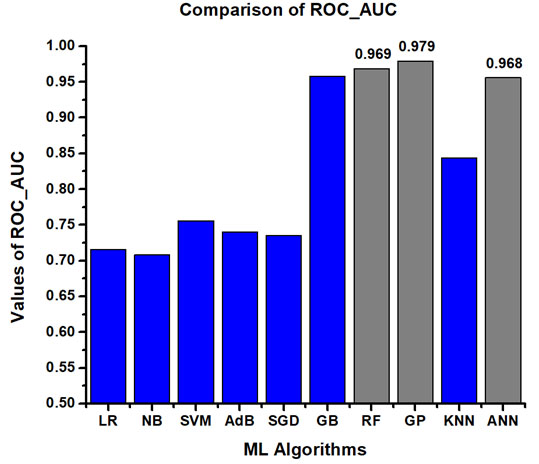
| RF | 97.25 | 0.953 | 0.960 | 0.977 | 0.957 | 0.969 |
| GP | 98.25 | 0.976 | 0.968 | 0.988 | 0.972 | 0.979 |
| KNN | 88.00 | 0.863 | 0.742 | 0.944 | 0.798 | 0.844 |
| ANN | 96.75 | 0.932 | 0.969 | 0.967 | 0.950 | 0.968 |
The dataset, being imbalanced, some machine learning algorithms can get biased and still gives higher accuracy. So, different performance metrics like accuracy, sensitivity, precision, specificity, F1-Score and ROC_AUC are investigated so that the ML models can be evaluated more comprehensively. Table 5 represents the best performing algorithms considering different performance parameters. Amongst them, the best ML model is Gaussian Process (GP) as it contains least amount of over fitting, fast and accurate prediction. The other nearly performed models are GB, RF and ANN. It is also observed that these algorithms showcased better accuracy in comparison with other literature studied. The comparative analyses among all the ML models in terms of accuracy, precision, sensitivity, specificity, F1 score and ROC_AUC are presented graphically in Figure 3, Figure 4, Figure 5, Figure 6, Figure 7 and Figure 8 respectively.
Table 5. Performance Assessment of ML Models
| Serial No. | Accuracy | Precision | Sensitivity | Specificity | F1 Score | ROC-AUC |
| 1. | GP
(98.25%) |
SVM
(0.985) |
ANN
(0.969) |
SVM
(0.996) |
GP
(0.972) |
GP
(0.979) |
| 2. | RF
(97.25%) |
GP
(0.976) |
GP
(0.968) |
GP
(0.988) |
RF
(0.957) |
RF
(0.969) |
| 3. | ANN
(96.75%) |
RF
(0.953) |
RF
(0.960) |
RF
(0.977) |
ANN
(0.950) |
ANN
(0.968) |
Figure 2: ROC of all the ML models
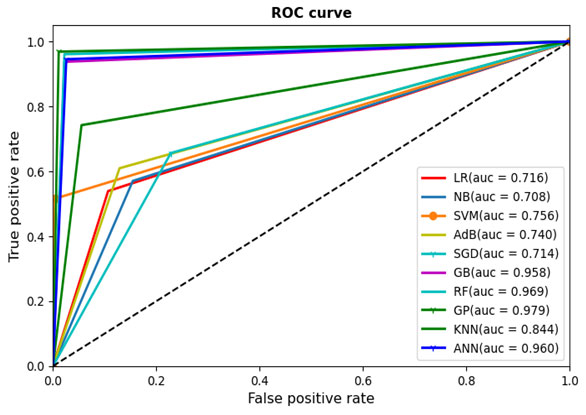
Figure 3: Comparison of accuracy among all the ML models
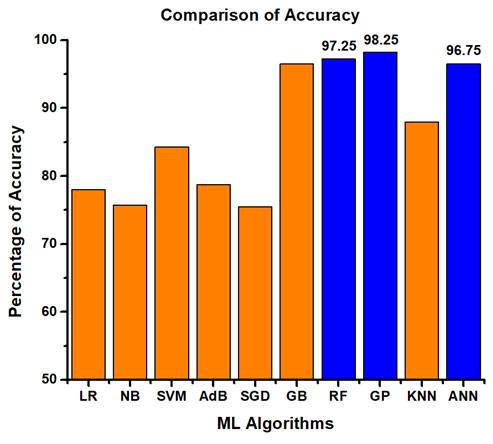
Figure 4: Comparison of precision among all the ML models
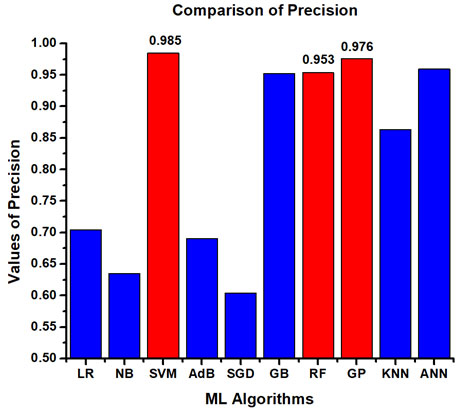
Figure 5: Comparison of sensitivity among all the ML models
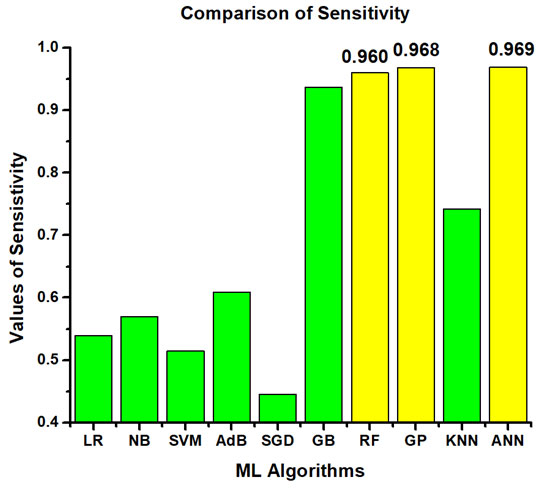
Figure 6: Comparison of specificity among all the ML models
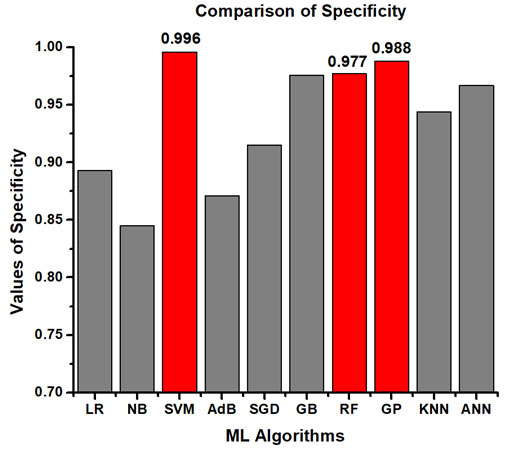
Figure 7: Comparison of F1 Score among all the ML models
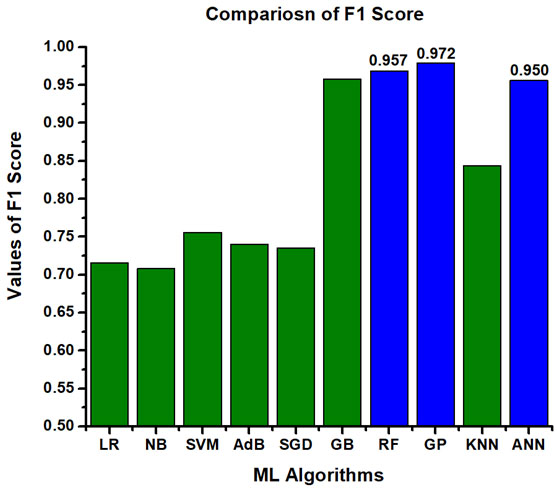
Figure 8: Comparison of ROC_AUC among all the ML models
CONCLUSION
In our proposed work, different machine learning algorithms are compared and analyzed based on various performance evaluation techniques like accuracy, sensitivity, precision, F1-score, Specificity and ROC_AUC. The obtained classification results demonstrate that the machine learning method Gaussian Process (GP) gives more accurate prediction and better performance than other methods discussed in this study. Still, some of the other methods used in this study such as Gradient Boosting (GB), Random Forest (RF) and Artificial Neural Network (ANN) provide exemplary results compared to other studies available in the existing literature. The primary goal of this study is to be a supportive element for doctors to arrive at a precise treatment routine for their patients suffering from diabetes. Because of great accuracy and fast processing time, this study can open a window in developing e-healthcare system for the diabetic patients. In future, more algorithms will be explored in different datasets so that more insights can be achieved and more information can be stored which will enable the healthcare professionals to utilize computer aided diagnosis as an efficient tool in the process of faster and proper treatment for diabetic patients.
Conflict of Interest: Authors have no conflict of interest.
REFERENCES
Balaji, V.R., Suganthi, S.T., Rajadevi, R., Kumar, V.K., Balaji, B.S. and Pandiyan, S., (2020), Skin disease detection and segmentation using dynamic graph cut algorithm and classification through Naive Bayes Classifier. Measurement, 107922.
Chen, X., Huang, L., Xie, D. and Zhao, Q., (2018), EGBMMDA: extreme gradient boosting machine for MiRNA-disease association prediction. Cell death & disease, 9(1), 1-16.
Djelloul, N. and Amir, A., (2019), Analysis of legendre polynomial kernel in support vector machines, International Journal of Computing Science and Mathematics, 10(6), 580-595.
Guo, Yang, G. Bai and Y. Hu, 2012. Using Bayes Network for Prediction of Type-2 diabetes.” 2012 International Conference for Internet Technology and Secured Transactions, 471-472.
Hossain, E., Hossain, M.F. and Rahaman, M.A., (2019), A color and texture-based approach for the detection and classification of plant leaf disease using KNN classifier. In 2019 International Conference on Electrical, Computer and Communication Engineering (ECCE), IEEE, 1-6.
Javeed, A., Zhou, S., Yongjian, L., Qasim, I., Noor, A. and Nour, R., (2019), An Intelligent Learning System based on Random Search Algorithm and Optimized Random Forest Model for Improved Heart Disease Detection, IEEE Access, 7, 180235-180243.
Kaggle Diabetes Dataset, Frankfurt hospital, Germany, (https://www.kaggle.com/johndasilva/diabetes)
Kahramanli, H., Allahverdi, N., (2008), Design of a hybrid system for the diabetes and heart diseases. Expert Systems with Applications, (35), 82–89.
Lang, M., Pfister, F.M., Fröhner, J., Abedinpour, K., Pichler, D., Fietzek, U., Um, T.T., Kulić, D., Endo, S. and Hirche, S., (2019), A Multi-Layer Gaussian Process for Motor Symptom Estimation in People with Parkinson’s Disease. IEEE Transactions on Biomedical Engineering, 66(11), 3038-3049.
Lee, K.W., Ching, S.M., Ramachandran, V., Yee, A., Hoo, F.K., Chia, Y.C., Sulaiman, W.A.W., Suppiah, S., Mohamed, M.H. and Veettil, S.K., (2018), Prevalence and risk factors of gestational diabetes mellitus in Asia: a systematic review and meta-analysis. BMC pregnancy and childbirth, 18(1):494.
Li, H., Liu, S., Hassan, M.M., Ali, S., Ouyang, Q., Chen, Q., Wu, X. and Xu, Z., (2019), Rapid quantitative analysis of Hg2+ residue in dairy products using SERS coupled with ACO-BP-AdaBoost algorithm, Spectrochimica Acta Part A: Molecular and Biomolecular Spectroscopy, 223: 117281.
Maniruzzaman, M., Ra`hman, M.J., Ahammed, B. and Abedin, M.M., (2019), Logistic Regression based Feature Selection and Classification of Diabetes Disease using Machine Learning Paradigm, 7th Int. Conf. on Data Science & SDGs EC, 67-74
Meng, X.-H., Huang, Y.-X., Rao, D.-P., Zhang, Q., and Liu, Q., (2013), Comparison of three data mining models for predicting diabetes or prediabetes by risk factors. Kaohsiung Journal of Medical Science, 29(2):93-9.
Nasser, I.M. and Abu-Naser, S.S., (2019), Lung Cancer Detection Using Artificial Neural Network. International Journal of Engineering and Information Systems (IJEAIS), 3(3), 17-23.
Polat, K., S. Günecs, and A. Arslan, (2008), A cascade learning system for classification of diabetes disease: Generalized discriminant analysis and least square support vector machine, Expert Systems with Applications, 34(1), 482–487.
Saeedi, P., Salpea, P., Karuranga, S., Petersohn, I., Malanda, B., Gregg, E.W., Unwin, N., Wild, S.H. and Williams, R., 2020. Mortality attributable to diabetes in 20–79 years old adults, 2019 estimates: Results from the International Diabetes Federation Diabetes Atlas. Diabetes research and clinical practice, 108086.
Sagir, A.M. and Sathasivam, S., (2017), Design of a modified adaptive neuro fuzzy inference system classifier for medical diagnosis of Pima Indians Diabetes. In AIP Conference Proceedings, AIP Publishing LLC, 1870(1):040048.
Talo, M., Yildirim, O., Baloglu, U.B., Aydin, G. and Acharya, U.R., (2019), Convolutional neural networks for multi-class brain disease detection using MRI images. Computerized Medical Imaging and Graphics, 78:101673.
Yoon, Y.S., Jung, J.W., Jeon, E.J., Seo, H., Ryu, Y.J., Yim, J.J., Kim, Y.H., Lee, B.H., Park, Y.B., Lee, B.J. and Kang, H., (2017), The effect of diabetes control status on treatment response in pulmonary tuberculosis: a prospective study. Thorax, 72(3), 263-270.
Zangooei, Mohammad Hossein, Jafar Habibi, and Roohallah Alizadehsani, (2014), Disease Diagnosis with a hybrid method SVR using NSGA-II, Neurocomputing, 136 (14-29).


