Abdulbasit Hussein*![]() and Tasisa Temesgen
and Tasisa Temesgen![]()
Department of Natural Resource Management, Haramaya University College of Agriculture
and Environmental Science, Dire Dawa, Ethiopia
Corresponding author email: abdulbasithussein111@gmail.com
Article Publishing History
Received: 12/10/2021
Accepted After Revision: 25/03/2022
The present study has analyzed the diversity and population structure of woody species in Gola natural vegetation. So far, the expected form of vegetation diversity relationships with different land use in study sites has not been known. A total of 73 quadrats were established systematically within three land-use types. Vegetation parameters and species type were recorded. There were 52 woody species found in total. The Fabaceae family had the most species, accounting for 15.3% of the total plant species. The PA site had Shannon’s diversity index value that was significantly higher than the other two land-use types (P= 0.042). The dynamics of woody plants diversity about land use is of major need for sustainable management of forests, and the present study provides valuable information for forest management, and it may help to develop testable hypotheses on other tropical forests.
Diversity, Farmland, Grazing Land, Gola, Protected Area
Hussein A, Temesgen T. On the Woody Species Diversity and Population Structure of the Gola Natural Vegetation, Eastern Hararghe, Oromia, Ethiopia. Biosc.Biotech.Res.Comm. 2022;15(1).
Hussein A, Temesgen T. On the Woody Species Diversity and Population Structure of the Gola Natural Vegetation, Eastern Hararghe, Oromia, Ethiopia. Biosc.Biotech.Res.Comm. 2022;15(1). Available from: <a href=”https://bit.ly/3HOQ8lH“>https://bit.ly/3HOQ8lH</a>
Copyright © This is an Open Access Article distributed under the Terms of the Creative Commons Attribution License (CC-BY). https://creativecommons.org/licenses/by/4.0/, which permits unrestricted use distribution and reproduction in any medium, provided the original author and sources are credited.
INTRODUCTION
Biological diversity refers to the diversity and evenness of species among and among living things and ecological complexes. The species is one of the most important analytical elements of the plant community (Laigle et al. 2021). Species richness is a simple way to measure biological diversity (Hillebrand et al. 2018). As anthropogenic activities destroy plant cover and biological variety, anxiety is rising in many parts of the world. Africa is predicted to have 650,000,000 hectares of forest cover, accounting for 17% of global forest cover and multiple biodiversity hotspots (Hegde and Enters 2000; Carney et al. 2014). Ethiopia is considered one of Africa’s most significant countries in terms of biological resources. One of the most important concerns confronting humanity today is the degradation of the cover of the forest (Reynolds et al. 2007; Atsri et al. 2020; Hasan et al. 2021).
The lack of local communities’ participation living near conservation zones in conservation initiatives is a key impediment to overall forest protection in Ethiopia (Woldemariam and Teketay 2001; Lemenih et al. 2014). To reduce the threat to natural forests, the country devised a wide range of conservation initiatives, such as water management, tree plantations, and replanting, rehabilitation, and restoration projects. These strategies were created to enhance vegetation protection and community members’ lifestyles (Birhanu et al. 2021). The eastern part of Ethiopia has been putting in place well-known conservation measures on degraded landscapes for some years, with area protection being the most popular conservation method in this region (Bardgett et al. 2021; Gebo et al. 2021; Yami and Mekuria 2022).
Gola is home to a diverse range of natural plants and wildlife. Perhaps, as befitting a recently formed area of protection, it is lacking in basic vegetation and information on the environment. To fill the current knowledge gap in the research area’s woody species, a detailed species diversity analysis of plants and vegetation population structure was carried out in three land-use categories: protected area, farmland, and grazing land. The main aim was to identify woody species and their diversity in connection to population structure to evaluate the effectiveness of conservation methods in the research region in eastern Ethiopia.
MATERIAL AND METHODS
Gola natural vegetation is located in Goro Gutu District, Eastern Ethiopia. The district has a total area of 531 km2. The protected part of Gola natural vegetation harbours different wildlife types and is reflected as an important support for upcoming indigenous community development. There is shared grazing space and farms used in the community near to the Gola protected area, with no limit to access resources. Three land cover types were studied as follows: protected area; farmland and grazing land used by the community.
Transect lines and sampling quadrats were created for each land use type based on area proportion. 6 transect lines in total were laid (two in each land cover type). 73 research quadrats were systematically chosen along the transect lines (20 from PA, 28 FL land, and 25 from GL). Quadrats of 20mx20m (400m2) were erected systematically at every 100 m interval for tree data gathering. There were five 5m x 5m sub quadrats used for shrubs and climbers in the major quadrats’ four at corners and one center and averaged. A clipper and a hypsometer were used to measure the diameter and height of woody vegetation respectively (Kent and Coker 1992). The DSH/ DBH of branching shrubs and trees at breast height were recorded and averaged. Vegetation with multiple stems or forks that were less than 1.3 m tall was also counted as a single tree (Kent and Coker 1992). On the field, plant species were identified. Samples were delivered to the herbarium for species identification that had not been identified in the field.
Shannon diversity index (H’) was vital to choose an index that’s more sensitive to richness when comparing diversity among samples and environments. Therefore, the species diversity across land-use types was estimated using the Shannon diversity index as follows:
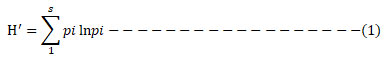
where H’ = Shannon index of diversity
Pi = the fraction of species.
Evenness (E), is a frequently used and well-known method for measuring community evenness (Pielou, 1966).
![]()
where E = Shannon index of evenness;
H’ = Shannon index of diversity;
H’max = lnS, and
S = total species number.
Importance value index was used to measure the relevance of all species to the study area, the IVI, relative frequency, frequency, and abundance were estimated using the method suggested in previous studies (Kent and Coker 1992a; Jha 1997).
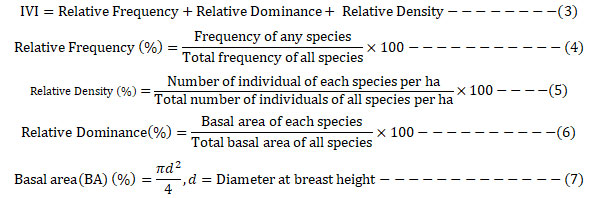
The BA is a measurement of domination and is used to elucidate the cross-section of the tree stand. It is derived using the method below (Kent and Coker 1992):

Where; BA = Basal area, d = DBH/DSH, and π= 3.14
The Jaccard similarity index was used to calculate the coefficient of similarity between land-use types (Chidumayo 1997).
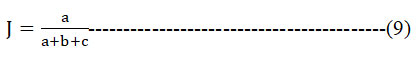
J = Jaccard coefficient of similarity, a= Species Number shared to both samples, b= species number pr
RESULTS AND DISCUSSION
Woody species composition: A maximum of 52 species of woody plant 33 genera and 24 families were found in the area of the study. The growth forms of these species were distributed as follows: 6 tree/shrubs 7 climbers, 16 trees, and 23 shrubs. There were 44 plant species collected in PA, 19 of which were shrub species, 14 of which were tree species, and 7 and 4 respectively for climbers and tree/shrubs. In GL, as in PA, shrubs dominated with 17 species, followed by trees (12), tree/shrubs (4), and climbers (3). Similarly, shrubs have 13, trees have 9, and tree/shrubs and climbers have 2 and 1species respectively at the FL site. The species number (52) found in the research region was larger than the species number found in Ethiopian forests, such as the Jabi Tehnan forest in the northwestern part of the country (Asmare and Gure 2019). On the other hand, the overall number of plants found at the study site was found to be lower than that reported from communal grazing grounds in South Tigray (Wayu et al. 2019). Various environmental variables in various parts of the country could cause such discrepancies in the study. Forest management and ownership may reveal their status and divergence, with highly protected natural vegetation having a higher number of individuals than community forest and open access regions (Sinasson et al. 2021; Tadesse et al. 2021).
The variation in woody diversity and abundance among each land-use type exposed the increasing influence of vegetation preservation through effective conservation measures such as area enclosures and restoration practices. According to Gebre et al. (2019), the loss in woody species diversity in grazing land could be an indication of vegetation species’ increased vulnerability to livestock and/or human intervention at maturation or early stages of rejuvenation. Heavy trampling may lead to a decline in plant species density and diversity over time (Mussa and Yunus 2022; Zegeye 2022).
The Fabaceae family was found to have the greatest species, accounting for 18.18%, 25%, and 32 % of all plant species found in a protected area, grazing, and farmland, respectively, followed by Euphorbiaceae in FL (16.00 %) and GL (11.11%). However, Euphorbiaceae and Oleaceae, with 11.36% of species, were the second-highest lifeforms family in PA. Other previous studies also suggested that Fabaceae were the dominant family in their study area (Abunie and Dalle 2018; Eshetu and Hailu 2020). This situation might arise due to a wide variety of adaptations to different environmental management (Alimi et al. 2021; Bora et al. 2021).
The density of Woody Species: Gola natural vegetation has a mean density of 8844.16 individuals per hectare. Acacia senegal had the largest density of single woody species, with 2240 and 960 individuals/ ha in protected areas and grazing land, respectively, while Grewia schweinfurthii had 420 individuals/ha/ ha in FL. The highest concentrations of some species, such as L. camara, maybe due to their unpleasant features for both wild and domestic animals, in addition to a diverse variety of seed distribution methods and highly reproductive capabilities (Hishe et al. 2021; Koricho et al. 2021). According to the same study, open-grazed lands showed lower vegetation density when compared to a protected area ( Wu et al. 2021; Wachiye et al. 2022).
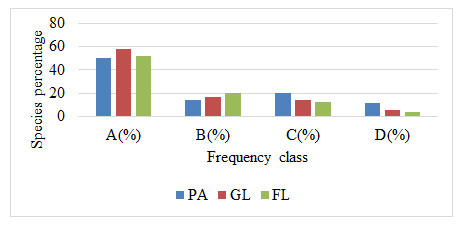
Frequency: Woody plant species were grouped into four different frequency groups in this study. In this study, a considerable proportion of woody plant species were found in lower frequency classes, while a small percentage of many species were found in the upper-frequency groups. This suggests that the species composition of the study sites was generally heterogeneous. PA had 11.33 percent a greater number of species in a higher frequency class than grazing and farmland, which had just 5.6% and 45 of plants, respectively. While in the lowest class of frequency, grazing land had a higher percentage of species (58%) than farmland (52.33%), and protected area (50.25%) (Fig 2). Thus, the outcome verifies the existence of a floristic heterogeneity to a high degree in each land-use type (Balemlay and Siraj 2021; Akodéwou and Godron 2022).
In both PA and GL, Acacia bussei was the greatest commonly identified species of plants, while Grewia schweinfurthii has been the maximum often identified in farmland. The least often documented species of plant in a protected area, grazing land, and farmland was Olea europaea, Grewia velutina, and Sansevieria ehrenbergii respectively, each of which was only found in one plot. The absence of often frequent for some species vegetation is related to a higher level of human involvement and livestock grazing. To improve the frequency distribution of such species, conservation must be prioritized (Mewded et al. 2021).esent in the first site only and, c= species number found only in the second area.
Following the requisite data collection, both qualitative and quantitative statistics were carried out. Percentages, figures, and means were used to present descriptive analyses of population structure. In addition, to examine diversity between land-use types, one-way analysis of variance is an example of inferential statistics were used for diversity indices (evenness and Shannon Weiner diversity index) and species richness. Every statistical analysis was carried out using R software (version 4.1.2) using lattice, vegan, permute, and biodiversity R package at the 5% level of significance.
Figure 1: Frequency class of woody species [(D ≥75, C = 51 – 75, B = 26– 50, A ≤25)
(GL, grazing land FL, farmland and PA, protected area)]
Woody Species Diversity, Evenness, and Richness: The average woody species diversity and evenness were 3.18 and 0.86, respectively. The species diversity and evenness were significantly different among the three land-use categories. PA had a significantly higher Shannon diversity index value than the FL. Even though GL was somewhat greater than farmland, the GL did not significantly differ from each other (Table 1). This could be due to regular habitat disturbances in grazing and farming areas, as a result of human and livestock grazing and extra agricultural use during the day (Beche et al. 2022).
The mean evenness of the three land-use categories fell significantly (p=0.041) from the protected area through the grazing land to the farmland. In farmland, a low average evenness rating indicates that only just a few species occupy the area. While in a protected location, great evenness suggests that species distribution is continuous (Cruz-Alonso et al. 2021).
Table 1. Mean ± SD of Gola natural vegetation diversity, evenness, and richness
| sites | Shannon diversity index (H’) | Evenness (Hʹ/Hmax) | Species richness |
| Protected area | 3.54 a±0.81 | 0.90 a ±0.02 | 19.70a±7.51 |
| Grazing land | 2.99 ab ±0.76 | 0.87b±0.04 | 14.30 a ±7.62 |
| Farmland | 2.20 b±0.62 | 0.62b±0.07 | 11.20 a ±7.84 |
| P-value | 0.041* | 0.048 * | 0.81 |
Jaccard Species Similarity Coefficient: Jaccard’s coefficient of similarity was computed to compare the similarity of family, species, and genus of the three land-use. For PA and GL, the Jaccard’s similarity of woody species was 79% of species. Similarity values of 66% were found between the GL and FL. However, there were 51% of species similarities between PA and FL. The highest species level similarity value was found between PA and GL, followed by GL and FL, whereas the lowest was found between PA and FL.
Table 2. The similarity of woody species across the study sites
| Sites | Protected area | Grazing land | Farmland |
| Protected area | 0 | ||
| Grazing land | 0.79 | 0 | |
| Farmland | 0.51 | 0.66 | 0 |
Basal area: The mean BA of Gola Natural vegetation was 33.11m2 ha-1 of plant species that have DBH > 2.5 cm. PA, GL, and FD each had a total basal area of 43.73 m2/ha, 31.59 m2/ha, and 22.79 m2/ha, respectively. PA had higher coverage of the basal area than another two sites (P 0.04) and was followed by GL. This could be attributed to the presence of a more proportion of mature and larger trees in PA, resulting in larger diameters as a result of minor human interference activities such as tree logging, farming, and animal grazing. FL, on the other hand, has much less coverage of the basal area.
This directly related tendency revealed that anthropological involvement had an impact on vegetation’s basal areas (Calbi et al. 2021). Acacia seyal (4.53 m2/ha), followed by Euphorbia adjurana (3.8 m2/ha), covered the maximum amount of mean basal area at the protected area. The greatest percentage of the average BA was accounted for by Acacia bussei (3.62 m2/ha) and Acacia senegal (3.14 m2/ha), followed by Acacia tortilis (3.51 m2/ha) and Acacia bussei (2.54 m2/ha) at grazing and farmland, respectively. In this research, basal area evaluation crosswise each species exposed that the studied region was dominated heavily by a small number of woody species. This also shows that species with the largest basal area do not always have the highest density, implying that species are different in size (Kaushal et al. 2021; Rasquinha and Mishra 2021).
Importance value index: Acacia senegal (27.99), Grewia schweinfurthii (25.78), and L. camara (16.36) were the highest three species with the IVI in PA. These species could be critical in a protected area. Woody species such as Jasminum abyssinicum (0.68), Jasminum grandiflorum (0.69), and Jasminum schimperi (0.71), were found to have lower IVI. This means that these species have the smallest ecological impact on the place. Their decreased IVI could indicate that these woody species are in danger and, among other things, require immediate conservation measures (Ayalew and Alemu 2021; Mewded et al. 2021). Woody species with the highest IVI at the GL include Acacia senegal (19.02), Acacia tortilis (17.76), and Acacia brevispica (17.76). This shows that in grazing areas, these are the most ecologically significant species. Woody plants with lower IVI at the GL, such as Barbeya oleoides (0.76), Withania somnifera (0.79), and Jasminum abyssinicum (0.81), attract conservation action based on their ecological significance (Ayalew and Alemu 2021; Mewded et al. 2021).
The three most ecologically significant species with the greatest IVI values at the farmland site are Grewia schweinfurthii (24.50), Acacia senegal (22.48), and Acacia negrii (21.50). In all three study sites, Acacia senegal exhibited the highest IVI. Because most of the factors are next to each other, this shows that there is some similarity in the sites. Dracaena ombet (0.90), Sansevieria ehrenbergii (1.50), and Grewia villosa (1.57) were the least ecologically relevant species at this site based on their IVI values. Each of the three sites has an entirely distinct least significant species. This also suggests that the state of anthropogenic disturbances such as farming and grazing varies greatly among the three land-use types (Ghanbari et al. 2021; Muluneh et al. 2021; Pandey 2021).
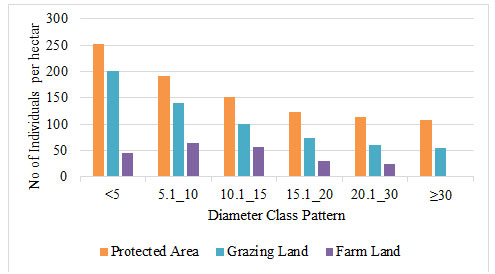
Woody Species Distribution by Diameter Class: In the protected area and grazing land sites, the Species in the DBH class was divided into six categories. In FL, however, a maximum of five diameters classes are allowed. The overall DBH class distribution of woody species in a protected area and grazing land vegetation showed an inverted J-shape distribution. This illustrates where the DBH class distribution of the species was most common in smaller diameters and vice versa. The first two diameter classes in protected areas and grazing land were accounted for 48.32% and 53.41% of DBH frequency in total, respectively.
This showed that mature and large diameter class trees were being harvested by locals for various uses (fencing, farm implementing, house construction, and fuelwood). Locals harvested trees with DBH more than 30cm for construction and charcoal manufacturing, according to similar reports (Gurmessa et al. 2021). However, in farmland diameter patterns of woody species, the majority of DBH frequency (55.01 percent) was restricted between the second and third diameter classes, indicating that there were more individuals in the middle diameter classes but fewer in the lower and higher diameter classes (Fig 2). This shows that the species in the community has a low reproductive capability (Calbi et al. 2021; Laigle et al. 2021).
Figure 2: Species distribution by diameter
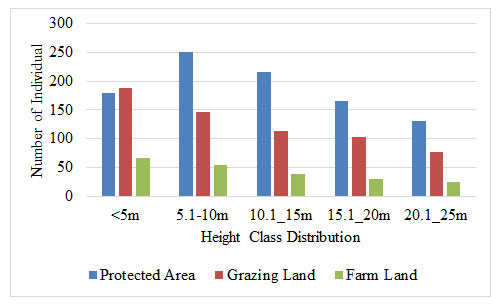
Height Distribution; The natural plants of Gola were divided into five classes based on height. In contrast to the DBH class, the height class distribution in the GL and FL sites has an inverted J-shape design, with a steady decrease towards the largest highest class. In both grazing and farmland, this finding revealed the development and strong regeneration state of the species population. However, in PA, it exhibits an uneven pattern dominated by the largest trees and plants.
In PA, the majority of species achieved the medium canopy layer classification, indicating that the species number was highest in the middle classes and reduced as height increased. The increased number of large-sized individuals in the upper height class in natural vegetation suggests the presence of a significant number of mature vegetation species for reproduction (Balemlay and Siraj 2021). For protected areas, this argument holds are true. This is due in part to the residents’ absence of large-scale woody exploitation (Gemechu and Jiru 2021; Tamiru et al. 2021).
Figure 3: Distribution of height class at the study site)
CONCLUSION
The findings of the present study have shown that the plant species of the research site were conquered by shrubs that were dominated by the Fabaceae family. Woody cutting, agriculture, and overgrazing are examples of human pressures on the majority of species, all of which are considered environmental matters that have contributed to the degradation of the vegetation. The diversity and structure of woody species showed variation across the three land-use types, which increased in the PA whereas decreasing through the adjacent GL to FL. These types of comparative analysis contribute to understanding the role of conservation on the natural vegetation in Ethiopia, practicing wide-scale conservation activities of degraded landscapes.
ACKNOWLEDGEMENTS
The study has been financially supported by the Haramaya University, Dire Dawa, Ethiopia.
Conflict of Interest: Authors do not have a conflict of interests to disclose.
Data Availability Statement: The database generated and /or analysed during the current study are not publicly available due to privacy, but are available from the corresponding author on reasonable request.
REFERENCES
Akodéwou, A., and Godron, M. (2022). Agricultural Land-Use Increases Floral Species Richness in Tropical Dry Forest and Savannah Ecosystems in West Africa. Diversity, 14(2), 106.
Alimi, A., Adeleke, R., and Moteetee, A. (2021). Soil environmental factors shape the rhizosphere arbuscular mycorrhizal fungal communities in South African indigenous legumes (Fabaceae). Biodiversitas Journal of Biological Diversity, 22(5).
Asmare, M. T., and Gure, A. (2019). Effect of exclosure on woody species diversity and population structure in comparison with adjacent open grazing land: the case of Jabi Tehnan district north western Ethiopia. Ecosystem Health and Sustainability, 5(1), 98–109.
Atsbha, T., Desta, A. B., and Zewdu, T. (2019). Woody species diversity, population structure, and regeneration status in the Gra-Kahsu natural vegetation, southern Tigray of Ethiopia. Heliyon, 5(1), e01120.
Atsbha, T., Wayu, S., Gebretsadkan, N., et al. (2019). Rehabilitation of indigenous browse plant species following exclosure established on communal grazing lands in South Tigray, Ethiopia, and implication for conservation. Ecological Processes, 8(1), 1–9.
Atsri, K. H., Abotsi, K. E., Kokou, K., et al. (2020). Ecological challenges for the buffer zone management of a West African National Park. Journal of Environmental Planning and Management, 63(4), 689–709.
Ayalew, T., and Alemu, S. (2021). Woody Plant Species Diversity of Dembeza Natural Forest, Enebsae Sarmider District, North Western Ethiopia. Journal of Plant Sciences, 9(4), 175–181.
Abunie, A.A., and Dalle, G. (2018). Woody species diversity, structure, and regeneration status of yemrehane kirstos church forest of lasta woreda, north wollo zone, amhara region, Ethiopia. International Journal of Forestry Research, 2018.
Balemlay, S., and Siraj, M. (2021). Population Structure and Regeneration Status of Woody Species in Kenech Forest, Southwest Ethiopia. International Journal of Forestry Research, 2021.
Bardgett, R. D., Bullock, J. M., Lavorel, S., et al. (2021). Combatting global grassland degradation. Nature Reviews Earth \& Environment, 2(10), 720–735.
Beche, D., Tack, A., Nemomissa, S., et al. (2022). Spatial variation in human disturbances and their effects on forest structure and biodiversity across an Afromontane forest. Landscape Ecology, 1–18.
Birhanu, T., Mohammed, A. S., and Mekonnen, A. B. (2021). Floristic composition, structure and regeneration status of woody plants in church forests of Dangila, Northwestern Ethiopia. Cogent Food \& Agriculture, 7(1), 1911438.
Bora, Z., Angassa, A., Wang, Y., et al. (2021). Effect of Elevation on the Density and Species Composition of Encroacher Woody Plants in Borana Rangeland, Southern Ethiopia. Environmental Management, 67(6), 1075–1087.
Calbi, M., Fajardo-Gutiérrez, F., Posada, J. M., et al. (2021). Seeing the wood despite the trees: Exploring human disturbance impact on plant diversity, community structure, and standing biomass in fragmented high Andean forests. Ecology and Evolution, 11(5), 2110–2172.
Carney, J., Gillespie, T. W., and Rosomoff, R. (2014). Assessing forest change in a priority West African mangrove ecosystem: 1986–2010. Geoforum, 53, 126–135.
Chidumayo, E. N., (1997). Miombo ecology and management: an introduction. Intermediate Technology.
Cruz-Alonso, V., Espelta, J. M., and Pino, J. (2021). Woody species richness and turnover in expanding Mediterranean forests: a story of landscape legacies influenced by climatic aridity. Landscape Ecology, 36(6), 1787–1800.
Eshetu, E. Y., and Hailu, T. A. (2020). Carbon sequestration and elevational gradient: The case of Yegof mountain natural vegetation in North East, Ethiopia, implications for sustainable management. Cogent Food and Agriculture, 6(1). https://doi.org/10.1080/23311932.2020.1733331
Gebo, B., Takele, S., and Shibru, S. (2021). Impacts of habitats and seasons on mammalian diversity and distribution in the Faragosa-Fura landscape, Gamo Zone, Southern Ethiopia. Geology, Ecology, and Landscapes, 1–12.
Gebre, A. B., Birhane, E., Gebresamuel, G., et al. (2019). Woody species diversity and carbon stock under different land use types at Gergera watershed in eastern Tigray, Ethiopia. Agroforestry Systems, 93(3), 1191–1203.
Gemechu, H. W., and Jiru, D. B. (2021). Review on factors affecting regeneration of indigenous tree species in Ethiopia. European Journal of Biophysics, 9(1), 24–29.
Ghanbari, S., Sefidi, K., Kern, C. C., et al. (2021). Population structure and regeneration status of woody plants in relation to the human interventions, Arasbaran Biosphere Reserve, Iran. Forests, 12(2), 191.
Gurmessa, F., Warkineh, B., Demissew, S., et al. (2021). Carbon Stock Density of the Different Carbon Pools in Tulu Lafto Forest and Woodland Complex: Horo Guduru Wollega Zone, Oromia Region, Ethiopia. European Journal of Biophysics, 9(1), 37–47.
Hasan, M. E., Zhang, L., Mahmood, R., et al. (2021). Modeling of Forest Ecosystem Degradation Due to Anthropogenic Stress: The Case of Rohingya Influx into the Cox’s Bazar–Teknaf Peninsula of Bangladesh. Environments, 8(11), 121.
Hegde, R., and Enters, T. (2000). Forest products and household economy: a case study from Mudumalai Wildlife Sanctuary, Southern India. Environmental Conservation, 27(3), 250–259.
Hillebrand, H., Blasius, B., Borer, E. T., et al. (2018). Biodiversity change is uncoupled from species richness trends: Consequences for conservation and monitoring. Journal of Applied Ecology, 55(1), 169–184.
Hishe, H., Giday, K., Orshoven, J.V., et al. (2021). Analysis of land use land cover dynamics and driving factors in Desa’a forest in Northern Ethiopia. Land Use Policy, 101, 105039.
Jha, P. K. (1997). Environment plant resources and quantities estimation methods for vegetation analysis. Ethnobotany for Conservation and Community Development.
Kaushal, S., Siwach, A., and Baishya, R. (2021). Diversity, regeneration, and anthropogenic disturbance in major Indian Central Himalayan forest types: implications for conservation. Biodiversity and Conservation, 30(8), 2451–2480.
Kent, M., and Coker, P. (1992a). Vegetation Description and Analysis–Belhaven Press. London.
Kent, M., and Coker, P. (1992b). Vegetation Description and Analysis Belhave press London pp. 363.
Koricho, H. H., Shumi, G., Gebreyesus, T., et al. (2021). Woody plant species diversity and composition in and around Debre Libanos church forests of North Shoa Zone of Oromiya, Ethiopia. Journal of Forestry Research, 32(5), 1929–1939.
Laigle, I., Moretti, M., Rousseau, L., et al. (2021). Direct and indirect effects of forest anthropogenic disturbance on above and below ground communities and litter decomposition. Ecosystems, 1–22.
Lemenih, M., Kassa, H., Kassie, G. T., et al. (2014). Resettlement and woodland management problems and options: a case study from North-western Ethiopia. Land Degradation \& Development, 25(4), 305–318.
Mewded, B., Alemu, S., Chala, D., et al. (2021). Woody Species Composition, Structure and Regeneration Status in Higelely Dry Forest, Eastern Ethiopia: Implication for Conservation Priority. Plant, 9(3), 36.
Muluneh, M. G., Feyissa, M. T., and Wolde, T. M. (2021). Effect of forest fragmentation and disturbance on diversity and structure of woody species in dry Afromontane forests of northern Ethiopia. Biodiversity and Conservation, 30(6), 1753–1779.
MussaA, M., and YunusB, A. (2022). Impact of Bush Encroachment Control on Rangeland Vegetation in the Rangelands of Bale, Southeastern Ethiopia. Journal of Rangeland Science, 12(1), 102.
Pandey, H. P. (2021). Implications of Anthropogenic Disturbances for Species Diversity, Recruitment and Carbon Density in the Mid-hills Forests of Nepal. Journal of Resources and Ecology, 12(1), 1–10.
Pielou, E. C. (1966). The measurement of diversity in different types of biological collections. Journal of Theoretical Biology, 13, 131–144.
Rasquinha, D. N., and Mishra, D. R. (2021). Impact of wood harvesting on mangrove forest structure, composition and biomass dynamics in India. Estuarine, Coastal and Shelf Science, 248, 106974.
Reynolds, J. F., Smith, D. M. S., Lambin, E. F., et al. (2007). Global desertification: building a science for dryland development. Science, 316(5826), 847–851.
Sinasson S, G. K., Shackleton, C. M., Sinsin, B., et al. (2021). Nationwide Assessment of Population Structure, Stability and Plant Morphology of Two Mimusops Species along a Social-Ecological Gradient in Benin, West Africa. Forests, 12(11), 1575.
Tadesse, T., Berhane, T., Mulatu, D. W., et al. (2021). Willingness to accept compensation for afromontane forest ecosystems conservation. Land Use Policy, 105, 105382.
Tamiru, B., Soromessa, T., Warkineh, B., et al. (2021). Woody species composition and community types of Hangadi Watershed, Guji Zone, Ethiopia. BMC Ecology and Evolution, 21(1), 1–15.
Team, R. C. (2013). 2015. R: A Language and Environment for Statistical Computing.
Woldemariam, T., and Teketay, D. (2001). The forest coffee ecosystems: ongoing crisis, problems and opportunities for coffee gene conservation and sustainable utilization. Proceedings of a Workshop on Imperative Problems Associated with Forestry in Ethiopia, 131–142.
Wu, K., Xu, W., and Yang, W. (2021). Short-term grazing exclusion does not effectively restore degraded rangeland in the Junggar desert of Xinjiang, China. Grassland Science, 67(2), 118–127.
Zegeye, H. (2022). Diversity, Regeneration Status, and Socio-Economic Importance of Tara Gedam, Abebaye and Fach Forests, South Gondar, Northwestern Ethiopia. In State of the Art in Ethiopian Church Forests and Restoration Options (pp. 151–169). Springer.

