1Crop Improvement, ICAR-Indian Institute of Soybean Research, Indore, India.
2School of Biotechnology, Devi Ahilya University, Indore, India.
Corresponding author email: vineetksahni@yahoo.com
Article Publishing History
Received: 04/03/2021
Accepted After Revision: 12/06/2021
The palatability of soy-food products can be enhanced by increasing sucrose content in soybean grains which are used as raw material. Therefore, soybean genotypes with high sucrose content are desired for processing good quality soy-food products with higher organoleptic acceptance and sweetness. In this study, estimation of sucrose content was carried out through high performance liquid chromatography (HPLC) in 321 soybean accessions from 14 countries. Sucrose was resolved using a silica NH2 column as stationary phase. The mobile phase (acetonitrile/water 75:25 v/v) was run isocratically at a flow rate of 1.0 ml/min. The elution was monitored by a refractive index detector. Wide genetic variability in sucrose content was observed, with a range of 1.2 -9.6 g/100g thereby exhibiting about 8-fold genetic variation.
Twenty-six genotypes were identified which showed sucrose content >7.0 g/100g. However, nine genotypes were identified which showed sucrose content < 2.0 g/100g. The highest sucrose content was observed in two genotypes, namely, PP-45 (9.6 ± 0.84 g/100g) and P5-40-2 (9.4 ± 0.78 g/100g). Genotypes identified from diverse background and with contrasting levels of sucrose content may be used for developing mapping populations which can be used for tagging genomic regions underlying biosynthesis of this trait in soybean seeds. Further, these genotypes can be used for developing novel genotypes with sucrose content higher than observed in the germplasm lines evaluated in this study.
Genetic Variability, HPLC (High Performance Liquid Chromatography), Sucrose Content, Soybean, Soy-Food.
Jha. P, Kumar. V, Rani. A, Kumar. A. Analysis On the Genetic Variability of Soybean Seed Sucrose Content in Germplasm Accessions from Different Countries of Origin. Biosc.Biotech.Res.Comm. 2021;14(2).
Jha. P, Kumar. V, Rani. A, Kumar. A. Analysis On the Genetic Variability of Soybean Seed Sucrose Content in Germplasm Accessions from Different Countries of Origin. Biosc.Biotech.Res.Comm. 2021;14(2). Available from: <a href=”https://bit.ly/2ROsnWK“>https://bit.ly/2ROsnWK</a>
Copyright © Jha et al., This is an open access article distributed under the terms of the Creative Commons Attribution License (CC-BY) https://creativecommns.org/licenses/by/4.0/, which permits unrestricted use distribution and reproduction in any medium, provide the original author and source are credited.
INTRODUCTION
Soy-based food products are fast gaining the sobriquet of ‘functional food of the century’ due to the presence of several nutraceutical components that stave off atherosclerosis, diabetes, breast cancer, osteoporosis at bay (Kumar et al. 2010a). Apart from basic nutrients like protein (40%), oil (21%), vitamins, soybean has tocopherols and isoflavones as major nutraceutical components. Despite its nutrients-rich profile, utilisation of soybean in food products is very meagre.
Presently, only 7-10 % of the total soybean produced in the country is utilized in processing soy-food products. The quality of these food products depends upon the seed attributes used as initial raw material. Apart from the presence of antinutritional factors, its astringent/bland taste is also the main culprit for poor acceptance of food products processed from soybean seeds (Taira et al. 1990; Kumar et al. 2011; Salari et al. 2020).
This taste related deterrent can be overcome by increasing sucrose content of soybean seeds which imparts sweetness and enhances organoleptic acceptance of food-grade soybean (Taira et al. 1990; Kumar et al. 2011). Sucrose constitutes 41.3–67.5% of the total soluble sugars in soybean seed. Of the dried seed, sucrose content is about 2.5-5.0%. Globally, high sucrose content soybean genotypes are desired by soy food industry for processing soy milk, tofu, natto and other soy food products as sucrose contributes to favourable taste (Escamilla et al. 2019). In soybean meal, high sucrose content is desirable as it contributes positively to the potential metabolizable energy and thereby leading to the weight gain among animals as per their genetic potential (Bilyeu and Wiebold 2016; Salari et al. 2020).
Therefore, development of high sucrose content soybean genotypes is important plant breeding objectives in soybean to meet the requirements of soy food and feed industry. The studies focusing on the screening of soybean germplasm for sucrose content are limited and were conducted only in selected fewer number of genotypes (Kumar et al. 2007; Kumar et al. 2010b). Hou et al. (2009) and Ficht (2018), investigated the genetic variability for sucrose content in 241 and 296 soybean genotypes. The high sucrose genotypes viz. PI 200508, V99-5089, PI 243545, and LD02-4485 mentioned in previous studies are not in the public domain due to the strict IPR regime (Skoneczka et al. 2009; Mozzoni et al. 2013; Zeng et al. 2014; Salari et al. 2020).
Therefore, it is important to constantly screen large number of germplasm lines to identify and develop new genetic combinations with high sucrose content, along with focused crossing programme. In the present investigation, we screened 321 soybean germplasm accessions from different countries for the identification of genotypes with high sucrose content.
MATERIAL AND METHODS
For the plant material, three hundred twenty-one soybean accessions comprising of exotic accessions, indigenous collections, advanced breeding lines developed in plant breeding programme for food grade characters were raised in the field of ICAR-Indian Institute of Soybean Research, Indore, India in single row plot of 3 m length with row-to-row spacing of 45 cm and plant-to-plant distance of 5 cm, in triplicate in the randomized block design. Standard agronomic practices recommended for soybean cultivation in Central India were followed from sowing to harvesting. Genotypes were harvested at maturity and freshly harvested seeds were subjected to sucrose estimation though HPLC.
For the determination of sucrose content using HPLC, extraction of sucrose from mature seeds of soybean accessions from 14 countries viz. Australia (1), Brazil (3), China (2), Ghana (2), Hungary (1), India (221), Italy (1), Japan (1), Philippines (1), Russia (1), Shri lanka (2), Taiwan (11), USA (15) and 59 genotypes of unknown origin was carried out following the method of Liu and Markakis (1987). The extracted sugars were determined through HPLC as described elsewhere (Kumar et al. 2007). The extracted sugar sample obtained was filtered using syringe membrane filter (0.22µm, 13 mm diameter), and 20µl of this sample was injected in Shimadzu high performance liquid chromatography (LC 10 AT vp).
Sucrose was resolved using a silica NH2 column (Phenomenex Luna 5µm, dimension 250mm×15mm), preceded by a guard column, maintained at 40⁰C in Shimadzu CTO 10AT vp oven. The mobile phase, acetonitrile /water (75/25 v/v), was run isocratically at a flow rate of 1.0 ml/min and the elution was monitored by means of a refractive index detector (Shimadzu, RID10A). Peak of sucrose in the sample was identified using the retention time of the peak of the sucrose standard (10mg/ml), which was obtained at 6.5 mins (Figure 1).
The concentration of sucrose (per gram of the flour) in the sample was computed by comparing its peak area with that of the known concentration of the standard, procured from Sigma Aldrich, using software CSW 1.7. Seeds of all the soybean accessions were analysed in triplicate samples for sucrose content. For the statistical analysis, phenotypic data and standard deviation was analysed and performed in Microsoft excel 2019.
RESULTS AND DISCUSSION
Three twenty-one soybean accessions were collected from 13 different countries. The concentration of major soluble sugar viz. sucrose was determined in seeds of the 321 soybean genotypes which exhibited a normal distribution ranging from 1.2 to 9.6 g/100g with the majority (260) of the genotypes containing 3.0 to 7.0 g/100g sucrose (Table 1, Figure 2), thereby exhibiting about 8-fold genetic variation. Twenty-six genotypes from four different origins had sucrose content above 7.0 g/100g (Table 2), whereas nine genotypes from Indian origin had sucrose content below 2.0 g/100g.
The highest sucrose content was identified in PP-45 (9.6 g/100g) from unknown country of origin followed by P5-40-2 (9.4 g/100g), which was from India. The lowest sucrose content genotypes were P1-12-3, VP64-2, P1-11-2 and P4-5-3 (1.2, 1.21, 1.35 and 1.5 g/100g, respectively), and all these genotypes are from India.
Figure 1: Chromatogram showing the separation of sucrose standard (10mg/ml).
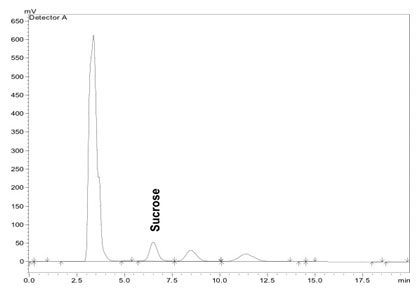
Figure 2: Distribution of 321 soybean genotypes according to sucrose content
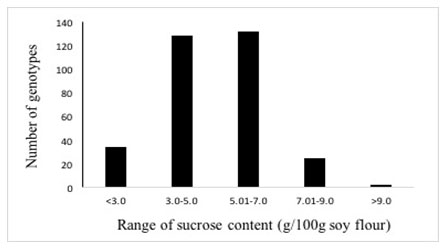
Table 1. Average sucrose content (g/100g soy flour) in soybean genotypes from different countries.
| Country of origin | Number of genotypes | Range of Sucrose content | Average Sucrose content |
| Australia | 1 | 5.0 | 5.0 ± 0.40 |
| Brazil | 3 | 4.8-6.9 | 5.6 ± 1.14 |
| China | 2 | 5.4-5.8 | 5.6 ± 0.63 |
| Ghana | 2 | 5.9-6.1 | 6.0 ± 0.83 |
| Hungary | 1 | 3.7 | 3.7 ± 0.35 |
| India | 221 | 0.89-9.4 | 4.7 ± 0.84 |
| Italy | 1 | 3.9 | 3.9 ± 0.00 |
| Japan | 1 | 7.5 | 7.5 ± 0.64 |
| Philippines | 1 | 4.9 | 4.9 ± 0.00 |
| Russia | 1 | 6.0 | 6.0 ± 0.46 |
| Shri Lanka | 2 | 4.2-6.4 | 5.3 ± 0.22 |
| Taiwan | 11 | 3.6-7.6 | 5.4 ± 0.75 |
| USA | 15 | 3.8-8.1 | 5.9 ± 1.06 |
| Unknown | 59 | 2.5-9.6 | 5.4 ± 0.75 |
| 321 | 4.43-7.48 | 5.31 ± 0.84 |
Table 2. Soybean genotypes exhibiting sucrose content higher than 7 g/100g soy flour or lower than 10 g/100g soy flour.
| Genotype | Sucrose content(g/100g) | Country of origin |
| PP-45 | 9.60 ± 0.84 | Unknown |
| P 5-40-2 | 9.40 ± 0.78 | India |
| IC 567316 | 8.88 ± 0.62 | India |
| P 2-19-3 | 8.13 ± 0.50 | India |
| EC 457201 | 8.12 ± 0.58 | USA |
| P 3-8 | 8.10 ± 0.52 | India |
| EC 457286 | 8.06 ± 0.43 | Unknown |
| JS 20-82 | 8.03 ± 0.37 | India |
| EC 685250 | 7.94 ± 0.29 | Unknown |
| ECP-125-738 | 7.85 ± 0.27 | Unknown |
| SKY/AK-1403 | 7.81 ± 0.21 | India |
| IC 574378 | 7.71 ± 0.19 | India |
| EC 170267 | 7.70 ± 0.22 | Unknown |
| CAT-19 | 7.63 ± 0.23 | Taiwan |
| JSM-226 | 7.63 ± 0.17 | India |
| P 2-2-1 | 7.60 ± 0.19 | India |
| EC 65772 | 7.56 ± 0.21 | USA |
| CAT-842 | 7.50 ± 0.17 | Japan |
| EC 963805 | 7.44 ± 0.12 | Unknown |
| CAT-135A | 7.40 ± 0.10 | Taiwan |
| CAT-1099 | 7.35 ± 0.18 | India |
| EC 95289 | 7.20 ± 0.16 | USA |
| EC 458346 | 7.15 ± 0.10 | Unknown |
| VP 96-2-2 | 7.10 ± 0.10 | India |
| IC 263278 | 7.03 ± 0.11 | India |
| NRC105 | 7.01 ± 0.01 | India |
Table 1 shows the country of origin of 321 soybean genotypes, their range and average of sucrose content investigated in this study. Genetic variability for sucrose content was the highest in soybean accessions from India (1.2-9.4 mg/g soy flour-7.8 fold) followed by USA (3.8-8.1 g/100g soy flour-2.2 fold) and Taiwan (3.6-7.6 g/100g soy flour-2.1fold), respectively. With regard to average sucrose content of soybean accessions from different country of origin, soybean accessions from Japan, Ghana and Russia exhibited average sucrose content of 7.5, 6.0 and 6.0 g/100g soy flour, respectively. Average sucrose content of soybean accessions from USA was 5.9 g/100g soy flour. Soybean accessions from Brazil and China both showed average sucrose content of 5.6 g/100g soy flour followed by Taiwan (5.4 g/100g flour), Sri Lanka (5.3 g/100g soy flour) and Australia (5.0 g/100g soy flour), respectively.
Maximum number of 221 soybean accessions were from India with average sucrose content of 4.7 g/100g soy flour. Hou et al. (2009) reported genetic variation of 59.6-fold for sucrose content in 241 plant introductions (PI). In an earlier study, Kumar et al. (2010b) investigated sucrose content in 148 soybean genotypes and reported 4.80-fold genetic variation. Moreover, Ficht (2018) investigated sucrose content of 296 soybean lines obtained from University of Guelph germplasm panel and reported only 2.3-fold of genetic variation. In comparison to the results by Hou et al. (2009), the genetic variation (8-fold) revealed in the present study for sucrose content was much lower but significantly higher than that reported in other related studies (Hou et al. 2009; Kumar et al. 2010b; Ficht 2018).
CONCLUSION
Wide genetic variability (8.0-fold) existed for sucrose content in 321 soybean germplasm accessions of different country of origin screened in the present study. Germplasm accessions identified with high sucrose content were from India, USA and unknown country of origin, while accessions for low sucrose content were from India. The diverse genetic background of these high and low sucrose content genotypes can be exploited in developing mapping population to identify the genomic regions underlying sucrose biosynthesis. High sucrose content genotypes from diverse background can be crossed to develop soybean genotypes with higher sucrose content value than the maximum value observed for this trait in this investigation.
ACKNOWLEDGEMENTS
The authors are grateful to Director, ICAR-Indian Institute of Soybean Research, Indore, Madhya Pradesh, India for providing facilities to carry out the study. Authors acknowledge Agarkar Research Institute (ARI), Pune, India for providing some germplasm accessions.
Conflict of Interests:The authors declare no conflict of interests among themselves.
REFERENCES
Bilyeu KD and Wiebold WJ (2016) Environmental stability of seed carbohydrate profiles in soybeans containing different alleles of the raffinose synthase 2 (RS2) gene. J agric food chem 64:1071-1078.
Escamilla DM, Rosso ML, Holshouser DL, Chen P and Zhang B (2019) Improvement of soybean cultivars for natto production through the selection of seed morphological and physiological characteristics and seed compositions: A review. Plant Breeding 138:131-139.
Ficht AM (2018) Genetic Analysis of Sucrose Concentration in Soybean Seeds Using a Historical Soybean Genomic Panel’, M. Sc. thesis, The University of Guelph, Ontario, Canada.
Hou A, Chen P, Alloatti J, Li D, Mozzoni L, Zhang B and Shi A (2009) Genetic variability of seed sugar content in worldwide soybean collections. Crop Sci 49: 903- 912.
Kumar V, Rani A and Chauhan GS (2007) A comparative study of oligosaccharides in immature and mature seeds of soybean genotypes. J Food Sci Tech 44: 4951.
Kumar V, Rani A and Chauhan GS (2010a) Nutritional value of soybean. In: G. Singh (ed) Soybean: The botany, production and uses. Centre for Agriculture and Bioscience International, Wallingford, United Kingdom, Pp:375-403.
Kumar V, Rani A, Goyal L, Dixit AK, Manjaya JG, Dev J and Swamy M (2010b) Sucrose and raffinose Family oligosaccharides (RFOs) in soybean seeds as Influenced by genotype and growing location. J Agric Food Chem 58:5081-5085.
Kumar V, Rani A, Goyal L, Pratap D, Billore SD and Chauhan GS (2011) Evaluation of Vegetable-Type Soybean for Sucrose, Taste-Related Amino Acids, and Isoflavones Contents. Int J Food Prop 14:1142-1151.
Liu K and Markiks P (1987) Effect of maturity and processing on trypsin inhibitor and oligosaccharides of soybean. J Food Sci 52:222-223.
Mozzoni L, Shi A and Chen P (2013) Genetic analysis of high sucrose, low raffinose, and low stachyose content in V99-5089 soybean seeds. J Crop Improv 27: 606-616.
Salari MW, Ongom PO, Thapa R, Nguyen HT, Vuong TD and Rainey KM (2020) Mapping QTL controlling soybean seed sucrose and oligosaccharides in a single family of soybean nested association mapping (SoyNAM) population. Plant Breed 00:1–13.
Skoneczka JA, Saghai Maroof MA, Shang C and Buss GR (2009) Identification of candidate gene mutation associated with low stachyose phenotype in soybean line PI200508. Crop Sci 49:247–255.
Taira H (1990) Quality of soybeans for processed foods in Japan. Jpn Agric Res Q 24: 224-230.
Zeng A, Chen P, Shi A, Wang D, Zhang B, Orazaly M, Florez-Palacios L, Brye K, Song Q and Cregan P (2014) Identification of quantitative trait loci for sucrose content in soybean. Crop Sci 54:554–564.

