1Department of Physiotherapy, Central Hospital, Benin City, Edo State, Nigeria.
2,4,5Department of Human Physiology, Delta State University, Abraka, Delta State, Nigeria.
3Department of Human Physiology, Evangel University Akaeze, Ebonyi State, Nigeria.
Corresponding author email: bukasono123@gmail.com
Article Publishing History
Received: 17/10/2020
Accepted After Revision: 12/12/2020
This study examined the anti-oxidative effects of Riboceine and vitamin C supplementation in the amelioration of tissue damage that results from oxidative stressors in diabetic rats. Twenty-five (25) mature Wistar rats (150-180kg) were used for the study. They were randomly assigned into five (5) groups of five rats each: Normal Control (NC), Diabetic Mellitus(DM) (induced by Alloxan at 120mg/kg body weight i.p), Diabetic rats treated with 30mg/kg body weight of RiboCeine (DM+RibCys), Diabetic rats treated with 125 mg/kg body weight of Vitamin C (DM+VitC) and Diabetic rats treated with 30 mg/kg body weight of RiboCeine + 125mg/kg body weight of Vitamin C (DM+RibCys +VitC). Following period of 20-day treatment, all the rats were sacrificed and samples of pancreas, kidney and liver tissues were collected and assayed for changes in oxidative stress biomarkers: Glutathione (GSH), Catalase (CAT), Superoxide Dismutase (SOD), Glutathione Peroxidase (GPx), Glutathione s-transferase (GST) and Malondialdehyde (MDA) levels.
The tissues were also examined for Histo-architectural changes. Data were analysed using One Way Analysis of Variance (ANOVA) followed by Fisher’s Least Significant Difference (LSD). A p-value of p < 0.05 was considered statistically significant. RibCys and DM+RibCys+VitC treated rats, showed statistically significant decrease in hyperglycaemia. However, RibCys dosed rats, showed no statistically significant effect. The DM rats showed statistically significant increased MDA and decreased CAT, SOD, GPx, GST levels in the tissues. The RibCys, VitC and DM+VitC+RibCys treated rats, showed statistically significant amelioration in increased MDA and decreased CAT, SOD, GPx, GST levels. Present results concluded that RibCys has ameliorative effects on diabetes induced-oxidative stress. Also, RibCys, VitC and VitC+RibCys have equally antioxidative effects on tissues characterized by biomarkers of oxidative stress.
Riboceine, Vitamin C, Diabetes mellitus, Oxidative Stress, Alloxan, Antioxidants
Thomas A. B, Emeka O. A, Chukwuebuka N. B, Oghenerukevwe O, Ikemefune E. E. Modulatory Role of Riboceine and Vitamin C Supplementation on Altered Oxidative Stress Status of Alloxan-induced Diabetic Wistar Rats. Biosc.Biotech.Res.Comm. 2020;13(4).
Thomas A. B, Emeka O. A, Chukwuebuka N. B, Oghenerukevwe O, Ikemefune E. E. Modulatory Role of Riboceine and Vitamin C Supplementation on Altered Oxidative Stress Status of Alloxan-induced Diabetic Wistar Rats. Biosc.Biotech.Res.Comm. 2020;13(4). Available from: <a href=”https://bit.ly/387dovj”>https://bit.ly/387dovj</a>
Copyright © Thomas et al., This is an Open Access Article distributed under the Terms of the Creative Commons Attribution License (CC-BY) https://creativecommons.org/licenses/by/4.0/, which permits unrestricted use distribution and reproduction in any medium, provide the original author and source are credited.
INTRODUCTION
Diabetes mellitus (DM) describes a metabolic disorder with complex pathophysiology and multiple aetiology characterised by chronic hyperglycaemia and disturbances of carbohydrate, fat and protein metabolism resulting from defects in insulin action, or both leading to lethal consequences in patients (Yu et al, 2020). Free radical-mediated destruction of pancreatic beta cells (site of insulin production) has been suggested as a major process that promotes pancreatic beta cells destruction in the pathophysiology of DM (Sundaram et al., 2006). In people with diabetes, glucose levels build up in the blood and urine, causing excessive urination, thirst, and hunger problems with fat and protein metabolism (Puhr et al, 2020).
Antioxidants plays vital role to maintain and improve health, protect cells, tissues and organs in living organisms after routine anabolic and catabolic processes. However, the therapeutic efficacy of antioxidants such as glutathione has been found to be negatively affected by aging, stress, insomnia, and exposures to toxic chemicals, with adequate rest as a key accelerator of an increase in its levels (Ghasemi-Dehnoo et al, 2020). The roles of anti-oxidants in scavenging and checking the excesses of free radicals in dying tissues and the molecular basis linking oxidative stress to Diabetes mellitus has been well established (Matkovics et al, 2007; Habib et al, 2020).
Riboceine consists of a scientific blend of D-Ribose and L-Cysteine compund, which makes its discovery a landmark that was not born by chance (Esposito and Giuglano, 2002). This ground breaking compound is a demand-release nutrient, activated by the body’s cells. Riboceine enters the bloodstream and is then used by the body to produce glutathione, the body’s master antioxidant, and ATP, the cell’s natural fuel and energy source (Adelakun et al, 2018). Riboceine has been clinically and scientifically proven as the only supplement that can effectively deliver cysteine into the cell, enabling it to produce optimal amounts of glutathione (Nagasawa et al., 2004). The anti-oxidant mechanism of tissue regeneration is generic and applies also to riboceine (Benedict et al, 2017). However, scanty literatures exist on the anti-oxidant effect of Riboceine and possible mechanism of potentiation of those effects especially when administered with vitamin C on diabetic animals. Therefore, the rationale of this study is targeted at devising a measure towards understanding the modulatory role of riboceine and vitamin C supplementation on altered oxidative stress status in alloxan induced diabetic Wistar rats.
MATERIAL AND METHODS
Animal Handling and Procurement:Twenty-five (n = 25) mature Wistar rats were used for this study. They were procured from the Laboratory Animal Center of the Faculty of Basic Medical Sciences, Delta State University, Abraka. The animals weighed between 120g- 200g and were housed in well-ventilated animal unit provided by the Department of Pharmacology, Delta State University, Abraka, Delta State. The animals were acclimatized for a week with standard environmental condition (12 hrs. light/dark cycles). During the entire period of study, animals were fed with standard grower mash diet (Composition of the grower’s marsh) and water ad libitum, in a standard wire meshed wooden cages for 7days prior to commencement of the experiment.
Induction of Diabetes Mellitus:A 65mg of Alloxan monohydrate (Sigma-Aldrich, U.S.A.) was dissolved in saline and administered intraperitoneally into fasted rats at a dose of 120mg/kg body wt. The solution was fresh and prepared just prior to the administration. The animals were considered diabetic if the blood glucose values of the overnight fasted rats were > 200 mg/dl on the third day, following Alloxan injection (Yashwant et al., 2011). Glucose levels were tested by using One Touch Ultra Mini Glucometer (Accu-Check, Roche, Germany) with a drop of blood obtained by tail vein puncture (Osinubi et al., 2018).
Study Design and Grouping: Twenty-five (25) mature Wistar rats were used for this study. They were randomly divided into five (5) groups of five (n=5) rats each. The rats were sacrificed after 20 days of treatment. Below is a breakdown of the treatment protocol for each group:Group A = Normal Control (NC) rats, fed standard rat diets and water ad libitum, Group B = Diabetic (DM) rats, fed standard rat diets and water ad libitum,Group C = Diabetic rats treated with 30mg/kg body weight of RiboCeine (RibCys) daily, Group D = Diabetic rats treated with 125 mg/kg body weight of Vitamin C (VitC) daily, Group E = Diabetic rats treated with 30 mg/kg body weight of RiboCeine + 125 mg/kg body weight of Vitamin C.
Drug Procurement and Administration:Riboceine (capsules) was purchased from a subsidiary of Max international, Benin, Edo state. Riboceine capsule (125mg/capsule) was dissolved in distilled water to form solution, at a standard dose of 30mg/kg (Babatunde et al., 2017) and administered orally once daily via an orogastric canula. Vitamin C (Ascorbic acid) tablet (100mg/tablet) were also purchased from pharmacy in Benin, Edo state. The tablets were dissolved in distilled water to form solution, at a standard dose of 125mg/kg (Shivavedi et al., 2014) and administered orally via an orogastric canula. The drugs were administered once daily, between 8:00am and 11:00am.
Samples Collection:All animals were sacrificed at the end of the study (20 days) by decapitation under light ether anesthesia. The kidney, liver and pancreas were taken out, washed, crushed and homogenized in potassium chloride (KCl) solution. The homogenate was diluted and centrifuged, with supernatant decanted and examined for antioxidant and antioxidant enzyme activities of Glutathione (GSH), Catalase (CAT), Superoxide Dismutase (SOD), Glutathione Peroxidase (GPx), and Malondialdehyde (MDA).Also, the kidney, pancreas and liver were sectioned for histological examination.
Biochemical Investigations:The tissues sample were homogenized in 50mM phosphate buffered saline (pH 7.4) by using a glass homogenizer. Half of the homogenates were centrifuged at 1000 g for 10 min at 4˚C to separate nuclei and unbroken cells. The pellet was discarded and a portion of supernatant was again centrifuged at 12,000g for 20mins to obtain post-mitochondrial supernatant. In homogenate, TBARS and GSH levels were estimated. In post-mitochondrial supernatant, SOD, CAT and GPx activities were measured as described below:
Determination of Malondialdehyde (MDA) Assay:A TBARS assay kit (ZeptoMetrix) was used to measure the lipid peroxidation products, MDA equivalents. One hundred microliters of homogenate was mixed with 2.5ml reaction buffer (provided by the kit) and heated at 95˚C for 60min. After the mixture had cooled, the absorbance of the supernatant will be measured at 532nm using a spectrophotometer. The lipid peroxidation products will be expressed in terms of nmoles MDA/mg protein using molar extinction coefficient of MDA-thiobarbituric chromophore (1.56×10⁵/M/cm) (Ohkawa et al., 1979).
Determination of GSH Assay:The GSH levels were measured using the method described by Sedlak and Lindsay (Sedlak and Lindsay, 1968). Homogenate will be mixed with 0.2 M Tris buffer, pH 8.2 and 0.1 mL of 0.01M Ellman’s reagent, [5,5’-dithiobis-(2-nitro-benzoic acid)] (DTNB). Each sample tube was centrifuged at 3000 g at room temperature for 15 min. The absorbance of the clear supernatants was measured using spectrophotometer at 412 nm in one centimetre quarts cells.
Determination of SOD Assay: The activity of SOD in the tissues was estimated using the method described by Kono (Kono, 1978), with the aid of nitrobluetetrazolium as the indicator. Superoxide anions are generated by the oxidation of hydroxylamine hydrochloride and are measured using spectrophotometer at 560nm under aerobic conditions. Addition of superoxide dismutase inhibits the reduction of nitrobluetetrazolium and the extent of inhibition is taken as a measure of enzyme activity. The SOD activity will be expressed as units/mg protein.
Determination of CAT Assay:The CAT activity was measured by the method of Aebi (1974), using hydrogen peroxide as substrate in post-mitochondrial supernatant. The hydrogen peroxide decomposition by catalase was monitored on spectrophotometer by following the decrease in absorbance at 240nm. The activity of enzyme will be expressed as units of decomposed/min/mg proteins by using molar extinction coefficient of H2O2 (71/M/cm).
Determination of GPx Assay:The enzymatic activities of GPx was determined by using ELISA kits in the post mitochondrial supernatant of colon homogenate on ELISA reader by following the manufacturer’s instructions (Flohe and Gunzler 1984).
Histological Analysis of Tissues : After the animals were euthanized, pancreatic, liver and kidney tissues were carefully harvested and placed inside a well labelled tissue embedding cassette. The tissues were processed with a 24hours automatic tissue processor, contained in 12beakers i.e. 10glass beakers and 2 thermostatically controlled electric metal beakers containing paraffin wax. After the tissues had been processed, they were embedded with an automatic embedding mole containing paraffin wax. The paraffin wax became solidified (upon cooling) and formed a solid support medium for the tissue during sectioning. A microtome was used in cutting sections of the tissues. The sections cut was placed in grease free slides which were then placed on a hot plate for 30minutes in order for sections to adhere to the slides. Using the Haematoxylin and Eosin stains, the sections were dewaxed in xylene, taken to water with descending grades of alcohol i.e. from absolute alcohol to 95% alcohol, 70% alcohol and then water. Final outcome was mounted and viewed under the microscope (Siddalingaswamy et al., 2011).
Ethical Considerations: Ethical approval was sought and obtained (REC/FBMS/DELSU/19/64) from the Research and Bio-Ethics Committee of the College of Health Sciences, Delta State University, Abraka, Delta State.
Statistical Analysis:All data generated were subjected to statistical analysis using SPSS version 23 software IBM. This was done using analysis of variance (ANOVA) and least significance difference (LSD) test at p-values of less than 0.05 that is, at 95% confidence level (p<0.05). Values were reported as Mean ± Standard error of mean (SEM).
RESULTS
Table 4.1: Percentage Change (%) Body Weight (g)
| Sample Parameter | Initial | Final | % Change |
| NC | 143.80±1.50 | 152.00±1.14 | 5.39±0.95 |
| DMC | 179.40±5.50 | 159.80±10.11 | -13.53±0.89
**0.004 |
| *DM+RibCys | 165.80±3.84 | 167.80±3.68 | 1.13±1.93
*0.023 |
| DM+VitC | 159.60±8.00 | 160.60±9.99 | -0.37±0.34
*0.035 |
| DM+RibCys+VitC | 161.00±8.02 | 163.20±5.96 | 1.46±0.28
*0.018 |
*significantly different at p<0.05, **p<0.01. NC: Normal Control; DM: Diabetic Mellitus; RibCys: Riboceine and VitC: Vitamin C
Table 4.1 showed the percentage change value outcome of the body weight, we observed highly statistically significant decrease in percentage change value of body weight in DMC group, when compared with NC group. Slight statistically significant increase percentage change value of body weight in DM+RibCys, DM+VitC and DM+RibCys+VitC groups, when compared with DMC group.
Table 4.2: Percentage (%) Change in Fasting Blood Glucose Level (mg/dl)
| Sample Parameter | Day5 | Day10 | Day20 |
| NC | 0.20±0.74 | -5.29±8.07 | 8.35±5.36 |
| DMC | 36.86±21.48b | 39.56±15.14
*0.022 |
35.51±9.50
|
| DM+RibCys | 25.88±20.51
*0.028 |
53.94±13.10
**0.004 |
64.63±9.29
*0.040 |
| DM+VitC | 45.09±11.30
*0.044 |
13.73±17.80
*0.038 |
28.04±15.08 |
| DM+RibCys+VitC | 75.30±0.82
**0.002 |
57.31±5.79
**0.002 *0.026(D) |
65.43±2.66
*0.035 |
*significantly different at p<0.05, **p<0.01, ***p<0.001. NC: Normal Control; DM: Diabetic Mellitus; RibCys: Riboceine and VitC: Vitamin C
Table 4.2 depicted the percentage change value in fasting blood glucose level on day 5, 10 and 20, post treatment. On day 5, we observed slightly statistically significant increase in percentage change value of fasting blood sugar in DM+VitC and DM+RibCys+VitC groups, when compared with NC group. Also observed was a statistically significant decrease in percentage change value of fasting blood sugar in DM+RibCys group, when compared with DM+RibCys+VitC group. On day 10, the results showed slightly statistically significant increase in percentage change value of fasting blood sugar in DMC, DM+ RibCys and DM+RibCys+VitC groups, when compared with NC. Also, slightly statistically significant decrease in percentage change value of fasting blood sugar in DM+ VitC group was observed, when compared with DM+RibCys group, and slightly statistically significant increase in percentage change value of fasting blood sugar in DM+RibCys+VitC group, when compared with DM+ VitC group was also observed. Results from day 20, showed slightly statistically significant increase percentage change value of fasting blood sugar in DM+ RibCys and DM+RibCys+VitC groups, when compared with DMC group
Figure 1: Tissue level of antioxidant enzyme (Catalase) activities in kidney, liver and pancreas of the rats after twenty days of treatment.
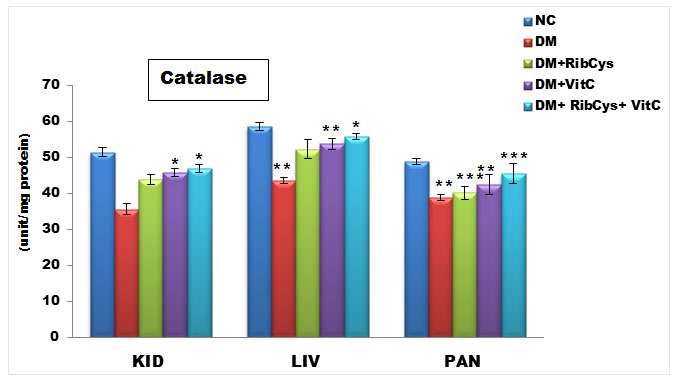
*significantly different at p<0.05, **p<0.01, ***p<0.001. NC: Normal Control; DM: Diabetic Mellitus; RibCys: Riboceine and VitC: Vitamin C.
Changes in tissue levels of catalase (CAT) are presented in figure 1. CAT activity in kidney was statistically significantly higher in DM+VitC and DM+RibCys+VitC groups, compared with DM+RibCys group. Statistically significantly lower level of CAT liver and pancreas tissue was observed in DMC group, when compared with NC group. The DM+RibCys, DM+VitC and DM+RibCys+VitC groups, showed statistically significantly higher CAT activity in the liver and pancreas tissues, when compared with DMC group. Also, statistically significantly (*p = 0.022) higher CAT activity was observed in DM+VitC group, when compared with DM+RibCys group. The DM+RibCys+VitC group, showed statistically significantly (**p=0.006, **p=0.001) higher CAT activity in the pancreas tissue, when compared with DM+RibCys and DM+VitC groups respectively.
Figure 2: Tissue level of antioxidant enzyme (Superoxide Dismutase) activities in kidney, liver and pancreas of the rats after twenty days of treatment.
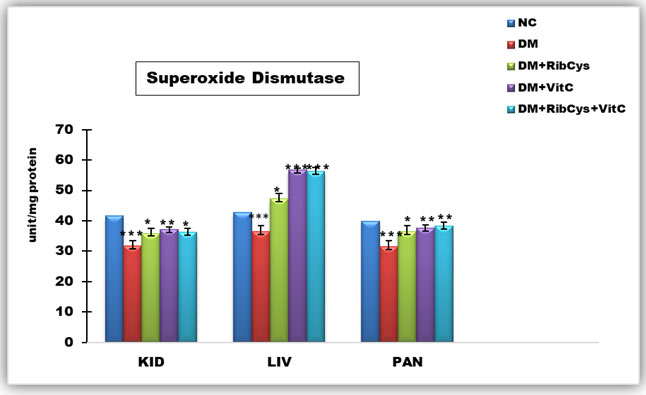
*significantly different at p<0.05, **p<0.01, ***p<0.001. NC: Normal Control; DM: Diabetic Mellitus; RibCys: Riboceine and VitC: Vitamin C
Changes in tissue levels of Superoxide Dismutase (SOD) are presented in figure 2. SOD activity in kidney was statistically significantly lower in DMC group, when compared NC group. Statistically significantly higher level of SOD activity in kidney tissue was observed in DM+RibCys, DM+VitC and DM+RibCys+VitC groups, when compared with DMC group. In the liver tissue, SOD activity was observed to be statistically significantly lower in DMC group, when compared NC group. Also, statistically significantly higher level of SOD activity in kidney and pancreas tissue was observed in DM+RibCys, DM+VitC and DM+RibCys+VitC groups, when compared with DMC group. The DM+RibCys group, showed lower statistically significant SOD activity in the liver, when compared with DM+VitC (***p=0.000) and DM+RibCys+VitC (***p=0.000) groups respectively. SOD activity in pancreas was statistically significantly lower in DMC group, when compared NC group.
Figure 3: Tissue level of antioxidant enzyme (Glutathione) activities in kidney, liver and pancreas of the rats after twenty days of treatment.
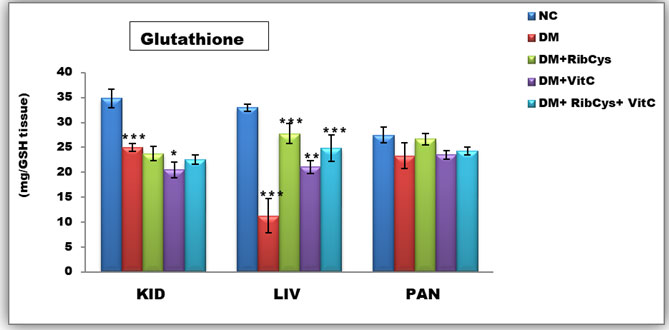
*significantly different at p<0.05, **p<0.01, ***p<0.001. NC: Normal Control; DM: Diabetic Mellitus; RibCys: Riboceine and VitC: Vitamin C
Changes in tissue levels of Glutathione (GSH) are presented in figure 3. GSH activity in kidney was statistically significantly lower in DMC group, when compared NC group. Statistically significantly higher level of GSH activity in kidney tissue was observed in DM+VitC, when compared with DMC group. A Statistically significantly higher level of GSH activity in liver tissue was observed in DM+RibCys, DM+VitC and DM+RibCys+VitC groups, when compared with DMC group. The DM+VitC (*p=0.047) group, showed higher statistically significant GSH activity in the liver, when compared with DM+RibCys group.
Figure 4: Tissue level of antioxidant enzyme (Glutathione Peroxidase) activities in kidney, liver and pancreas of the rats after twenty days of treatment.
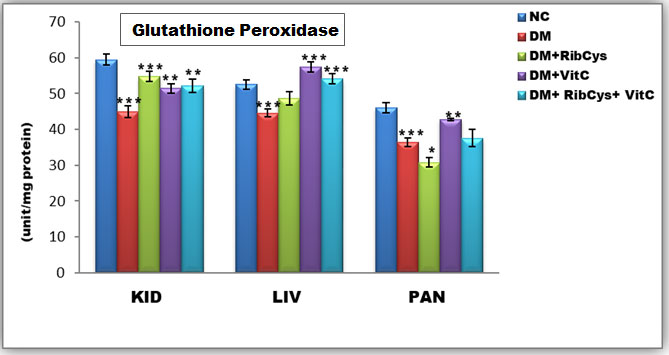
*significantly different at p<0.05, **p<0.01, ***p<0.001. NC: Normal Control; DM: Diabetic Mellitus; RibCys: Riboceine and VitC: Vitamin C
Changes in tissue levels of Glutathione Peroxidase (GPx) are presented in Figure 4. GPx activity in kidney and pancreas tissues were statistically significantly lower in DMC group, when compared NC group. A Statistically significantly higher level of GPx activity in kidney tissue was observed in DM+RibCys, DM+VitC and DM+RibCys+VitC groups, when compared with DMC group. GPx activity in liver was statistically significantly lower in DMC group, when compared NC group. While a Statistically significantly higher level of GPx activity in liver tissue was observed in DM+VitC and DM+RibCys+VitC groups, when compared with DMC group. The DM+RibCys group, showed lower statistically significant GPx activity in the liver, when compared with DM+VitC (***p=0.000) and DM+RibCys+VitC (***p=0.014) groups respectively. A Statistically significantly higher level of GPx activity in pancreas tissue was observed in DM+RibCys and DM+VitC groups, when compared with DMC group. The DM+RibCys group, showed lower statistically significant GPx activity in the pancreas, when compared with DM+VitC (***p=0.000) and DM+RibCys+VitC (**p=0.004) groups respectively. Also, DM+RibCys+VitC (*p=0.022) group, was observed to show higher statistically significant GPx activity in the pancreas, when compared with DM+VitC group.
Figure 5: Tissue level of antioxidant enzyme (Glutathione s-transferase) activities in kidney, liver and pancreas of the rats after twenty days of treatment.
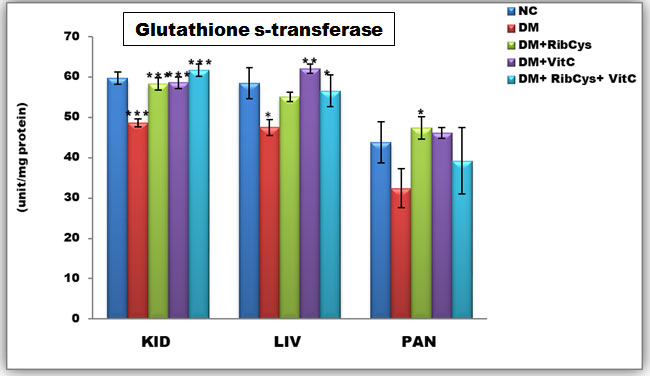
*significantly different at p<0.05, **p<0.01, ***p<0.001NC: Normal Control; DM: Diabetic Mellitus; RibCys: Riboceine and VitC: Vitamin C.
Changes in tissue levels of Glutathione Peroxidase (GST) are presented in Figure 5. GST activity in kidney was statistically significantly lower in DMC group, when compared NC group. A Statistically significantly higher level of GST activity in kidney tissue was observed in DM+RibCys, DM+VitC and DM+RibCys+VitC groups, when compared with DMC group. GST activity in liver was statistically significantly lower in DMC group, when compared NC group. While a Statistically significantly higher level of GST activity in liver tissue was observed in DM+VitC and DM+RibCys+VitC groups, when compared with DMC group. A Statistically significantly higher level of GST activity in pancreas tissue was observed in DM+RibCys group, when compared with DMC group.
Figure 6: Tissue level of antioxidant enzyme (Malondialdehyde) activities in kidney, liver and pancreas of the rats after twenty days of treatment.
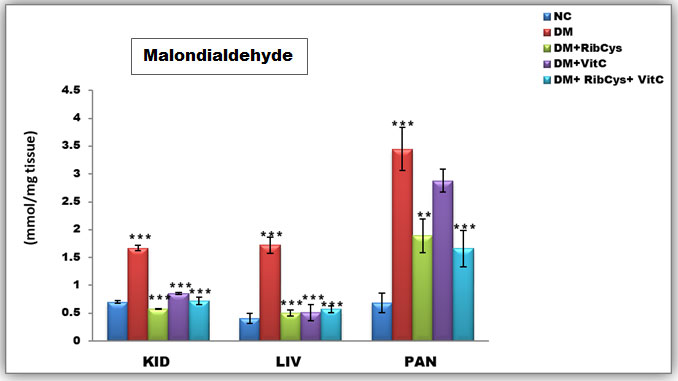
*significantly different at p<0.05, **p<0.01, ***p<0.001. NC: Normal Control; DM: Diabetic Mellitus; RibCys: Riboceine and VitC: Vitamin C
Changes in tissue levels of Malondialdehyde (MDA) are presented in figure 6. MDA activity in kidney was statistically significantly higher in DMC group, when compared with NC group. Statistically significantly lower level of MDA activity in kidney tissue was observed in DM+RibCys, DM+VitC and DM+RibCys+VitC groups, when compared with DMC group. The DM+RibCys group, showed lower statistically significant MDA activity in the kidney, when compared with DM+VitC (***p=0.000) and DM+RibCys+VitC (*p=0.031) groups respectively. Also, DM+RibCys+VitC (*p=0.025) group, was observed to show lower statistically significant MDA activity in the kidney, when compared with DM+VitC group.
The MDA activity in liver was observed to be statistically significantly higher in DMC group, when compared with NC group. Statistically significantly lower level of MDA activity in liver tissue was observed in DM+RibCys, DM+VitC and DM+RibCys+VitC groups, when compared with DMC group. MDA activity in pancreas was statistically significantly higher in DMC group, when compared NC group. While a Statistically significantly lower level of MDA activity in pancreas tissue was observed in DM+ RibCys and DM+RibCys+VitC groups, when compared with DMC group. Also, DM+RibCys (*p=0.026) group, was observed to show lower statistically significant MDA activity in the pancreas, when compared with DM+VitC group, and DM+RibCys+VitC (**p=0.008) group, was observed to have lower statistically significant MDA activity in the pancreas, when compared with DM+VitC group.
Histological Changes
Figure 7: H&E stained kidney micrographs of NC, DM, DM+RibCys, DM+VitC and DM+RibCys+VitC groups, taken on 5 μm thick paraffin wax-embedded sections with a magnification of × 400.
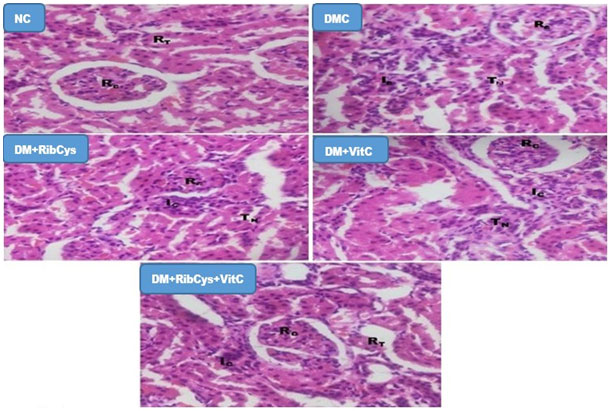
NC group, showed normal Renal corpuscles (RC) and Renal tubules (RT). DMC group, showed abnormal Renal corpuscles (RC), tubular necrosis (TN) and infiltration of inflammatory cells (IC). DM+RibCys group, showed abnormal Renal corpuscles (RC), mild tubular necrosis (TN) and mild infiltration of inflammatory cells (IC). DM+VitC group, showed normal Renal corpuscles (RC), tubular necrosis (TN) and mild infiltration of inflammatory cells (IC). DM+RibCys+VitC group, showed normal Renal corpuscles (RC), normal Renal tubules (RT) and mild infiltration of inflammatory cells (IC).
Figure 8: H&E stained Pancreas micrographs of NC, DMC, DM+RibCys, DM+VitC and DM+RibCys+VitC groups, taken on 5 μm thick paraffin wax-embedded sections with a magnification of × 400.
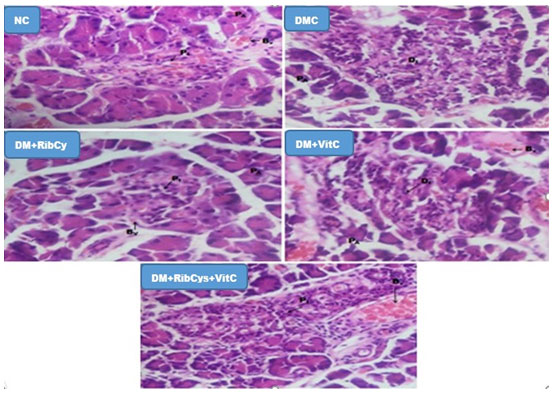
Showing normal Pancreatic Islet (PI), Pancreatic acini (PA) and Blood vessels (Bv) in NC group. DMC group, showed normal Pancreatic acini (PA) and Diabetic Islets (DI): infiltration of inflammatory cells and vascular degeneration. DM+RibCys group, showed normal Pancreatic acini (PA), mild infiltration of inflammatory cells(PI) and mild vascular degeneration (Bv). DM+VitC group, showed normal Pancreatic acini (PA), mild infiltration of inflammatory cells (DI) and mild vascular degeneration (Bv). DM+RibCys+VitC group, showed normal Pancreatic Islet (PI), Pancreatic acini (PA) and Blood Vessels (BV).
Figure 9: H&E stained Liver micrographs of NC, DMC, DM+RibCys, DM+VitC and DM+RibCys+VitC groups, taken on 5 μm thick paraffin wax-embedded sections with a magnification of × 400.
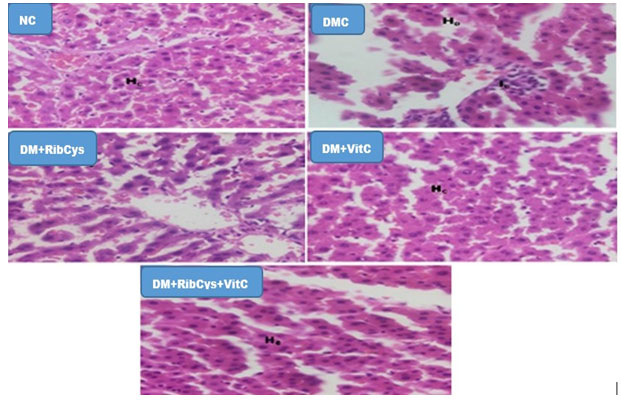
Showing normal Hepatocytes (HC) in NC group. DM group showed showing infiltration of Inflammatory cell (IC). DM+RibCys group, showed normal Hepatocytes (HC). DM+VitC group, showed normal Hepatocytes (HC). DM+RibCys+VitC group, showed normal Hepatocytes (HC).
DISCUSSION
The present study revealed a statistically significant percentage weight reduction in DM group (-13.53%) when compared to NC group (5.39%). This finding is in agreement with the finding of Ghada, (2013). The observed weight loss may be as a result of diabetes (Evcimen et al., 2004), leading to excessive breakdown of tissue proteins (Chatterjee and Shinde, 2002), as well as muscle wasting, dehydration and catabolism of fats (Hakim et al., 1997). Administration of Riboceine, vitamin C and riboceine + vitamin C to DM+RibCys (1.13%), DM+VitC (-0.37%) and DM+RibCys+VitC (1.46%) groups, showed statistically significant percentage weight increase when compared with DM group (-13.53%). The observed weight increase suggests interruption of the previously mentioned metabolic derangements. This observation agrees with the findings of Osinubi et al. (2018), who observed that riboceine maintained the body weights of the animals by protecting them from the cytotoxic effects of streptozotocin.
Data from our study showed that blood glucose level was increased in alloxan-induced diabetic rats, which may have resulted from the effects of alloxan which been proven to cause massive reduction in insulin release by the destruction of beta-cells of Islet of Langerhans and hence, inducing hyperglycemia (Ravikumar et al., 2010).In our study, there was decrease in the blood glucose level in DM, DM+RibCys, DM+VitC and DM+RibCys+VitC groups after twenty days of treatment (Table 4.2). This observation is corroborated by the research findings of Dawud et al. (2012), who reported that oral administration of antioxidant micronutrients and vitamins resulted in a significant decrease in the levels of blood glucose. Also, this finding, agrees with the finding of Osinubi et al. (2018), who reported a statistically significant decrease in the blood glucose level in diabetic rats treated with riboceine.
The present study has revealed that diabetes is linked with reduced activity of GST, GPx, GSH, Superoxide dismutase and lower levels of Catalase activities in kidney, liver and pancreas tissues of the diabetic rats compared with the control group. This observation agrees with the findings of Osinubi et al. (2018), wherein they observed a statistically significant decrease in CAT and SOD activities in diabetic rats compared with normal control rats. This findings agree with the finding of Yu et al., (2006); Arora et al., (2008); Cui et al., (2008). The decreased CAT activity in diabetes might reduce protection against free radicals (Alsaif, 2009; Soto et al., 2010). The results of this study, showed statistically significant increase in the levels of CAT and SOD activities in kidney, liver and pancreas tissues of the Riboceine, vitamin C and combination of riboceine + vitamin C treated rats, when compared with diabetic rats. This finding is corroborated by the findings of Osinubi et al. (2018). This observation may have resulted from the free radicals scavenging activities of CAT and SOD.
The findings of the present study, showed a statistically significant decrease in the levels of GSH, GPx and GST activities in the kidney, liver and pancreas tissues of the diabetic rats compared with the normal control group. Only in the pancreas, was statistically significant decrease was not observed. This reduction may have possibly resulted from the overwhelming effect of the free radicals on these antioxidants enzymes. Present study showed statistically significant increase in GR activity in liver, when DM+VitC and RibCys+VitC were compared with DM group. However, increase and decrease in GSH activities in pancreas and kidney were observed, when Vit C, RibCys and combined treatment groups were compared with DM group, but not statistically significant. The observation that showed ameliorative effect of RibCys or/and VitC in the tissues, agrees with the findings of (Maher and Al-Enazi, 2014; Kader et al, 2020), who reported that an increase in the activity of this enzyme, might have been mediated by GSH regeneration.
Protracted hyperglycemia may result in glucose toxicity and increase in ROS activity as well as increased lipid peroxidation especially in the pancreas which lacks sufficient antioxidants (Li and Leung, 2017). This is in tandem with the findings of this present study, which showed statistically significant increase in MDA activities in blood, pancreas, liver and kidney, in diabetic rats when compared with the normal control group. This observation agrees with the finding of Osinubi et al. (2018) suggesting indirect evidence of high free radical production in diabetes. The kidney, liver and pancreas of DM+VitC, DM+RibCys and DM+ RibCys+VitC treated groups, showed a statistically significant decrease in the activities of MDA, when compared with diabetic group. This finding is corroborated by the reported findings of Osinubi et al. (2018), Chuku and Chinaka, (2020).
We therefore speculate that the observed concomitant ameliorative effect in tissues of the animals that were treated with DM+RibCys and those treated with DM+VitC and DM+RibCys+VitC in the present study may have been influenced by the possibility of VitC and glutathione mutual sparing.The histopathological observations in the present work confirmed the improvement in treated groups when compared with the normal and diabetic control groups. The nephritic, hepatic and pancreatic tissue of diabetic rat demonstrated glomerular inflammation, tubular necrosis, inflammatory cells infiltration and vascular degeneration. The finding is in agreement with that of Elsner et al. (2002). The improvement of the histological structure in the treated groups suggest the anti-oxidative protective effects of riboceine and vitamin C, this observation agrees with the finds of Dawud et al. (2012) and Osinubi et al. (2018).
CONCLUSION
Weights of the diabetic and treated rats and change in the blood sugar of the VitC and VitC+RibCys treated rats were significantly decreased. The DM rats showed significant increase in MDA levels and decreased CAT, SOD, GPx, GST activities. Findings from the study revealed that RibCys, VitC and VitC+RibCys treated rats showed significant ameliorative effect on increased MDA levels and decreased CAT, SOD, GPx, GST activities and histological structures studied which suggest ameliorative effects on diabetes induced-oxidative stress.
REFERENCES
Adelakun SA, Omotoso OD and Aniah JA (2018) Modulating Role of D-Ribose-L-Cysteine on Oxidative Stress in Streptozotocin Induced Diabetes on Plasma Lipoprotein, Oxidative Status, Spermatogenesis and Steroidogenesis in Male Wistar Rats; Curr Res Diabetes Obes J 9(2): 1-7
Aebi H (1984). “Catalase in vitro”. Methods in Enzymology. 105: 121–126.
Alsaif MA (2009) Beneficial Effects of Rutin and Vitamin C Co Administration in a Streptozotocin-Induced Diabetes Rat Model of Kidney Nephrotoxicity. Pakistan Journal of Nutrition, 8, 745-754.
Arora M, Kumar A, Kaundal RK, Sharma SS (2008). Amelioration of Neurological and Biochemical Deficits by Peroxynitrite Decomposition Catalysts in Experimental Diabetic Neuropathy. European Journal of Pharmacology, 596, 77-83.
Benedict F, Opeyemi A, Mulikat O, Abraham O, Adeoye O (2017) Effect of D-ribose-L-cysteine on aluminum induced testicular damage in male Sprague-Dawley rats. JBRA Assisted Reproduction 21(2): 94-100.
Chatterjee MN, and Shinde R (2002). Text book of Medical Biochemistry. Jaypee Brothers Medical Publishers: New Delhi; 317.
Chuku, LC, Chinaka, NC. (2020). Influence of Antioxidant Supplementation on High Fat Diet-Streptozotocin (HFD-STZ) Induced Type 2 Diabetes Mellitus in Albino Rats. European Journal of Medicinal Plants, 31(17), 29-40
Cui XP, Li BY, Gao HQ, Wei N, Wang WL, Lu M (2008). Effects of Grape Seed Proanthocyanidin Extracts on Peripheral Nerves in Streptozocin-Induced Diabetic Rats. Journal of Nutritional Science and Vitaminology (Tokyo), 54, 321-328.
Dawud FA, Eze ED, Ardja AA A, Isa AS, Jimoh A, M. Bashiru, Malgwi IS (2012). Ameliorative Effects of Vitamin C and Zinc in Alloxan-induced Diabetes and Oxidative Stress in Wistar Rats. Current Research Journal of Biological Sciences 4(2): 123-129.
Elsner M, Tiedge M, Guldbakke B, Munday R, Lenzen S (2002). Importance of the GLUT2 glucose transporter for pancreatic beta cell toxicity of alloxan. Diabetologia 45, 1542–1549.
Esposito K, Giugliano D (2002) Hyperglycemia and vascular damage: Role of oxidative stress. Recent Prog. Med.; 93(3):172–174.
Evcimen ND, Ulusu NN, Karasu C and B. Dógru B (2004). Adenosine Triphosphatase Activity of Streptozotocin-Induced Diabetic Rat Brain Microsomes. Effect of Vitamin E. Gen PhysiolBiophys., 23: 347-355.
Flohe L and Gunzler WA (1984) Assays of glutathione peroxidase. Methods Enzymol. 105, 114–121.
Ghasemi-Dehnoo M, Amini-Khoei H, Lorigooini Z, Rafieian-Kopaei M. (2020) Oxidative stress and antioxidants in diabetes mellitus. Asian Pac J Trop Med., 13:431-8
Habib Y, Thozhukat S, Stephen LA, Amirhossein S (2020) Molecular Mechanisms Linking Oxidative Stress and Diabetes Mellitus, Oxidative Medicine and Cellular Longevity Volume 2020, Article ID 8609213, p.1-13
Hakim ZS, Patel BK, and Goyal RK (1997). Effects of chronic ramipril treatment in streptozotocin-induced diabetic rats. Indian J. Physiol. Pharmac., 41: 353–360.
Kader T, Porteous CM, Jones GT, Dickerhof N, Narayana VK, Tull D, Taraknath S, McCormick SPA. (2020). Ribose-cysteine protects against the development of atherosclerosis in apoE-deficient mice. PLoS ONE, 15(2), e0228415.
Kono Y (1978). Generation of Superoxide Radical during Autoxidation of Hydroxylamine and an Assay for Superoxide Dismutase. Archives of Biochemistry and Biophysics, 186: 189-195.
Li L and Leung PS (2017). Pancreatic Cancer, Pancreatitis, and Oxidative Stress. Gastrointestinal Tissue, Elsevier.
Lucas AM, Hennig G, Dominick PK, Whiteley HE, Roberts JC, Cohen SD (2000). Ribose cysteine protects against acetaminophen-induced hepatic and renal toxicity, Toxicol. Pathol. 28 697–704.
Maher M, Al-Enazi (2014). Protective Effects of Combined Therapy of Rutin with Silymarin on Experimentally- Induced Diabetic Neuropathy in Rats. Pharmacology & Pharmacy, 5, 876-889.
Matkovics B, Kotorman M, Varga IS (2007). Pro, antioxidant studies in the blood of type 2 diabetic patients. Acta. Physiol. Hung.; 85(2):107–112.
Nagasawa Y, Demura S, Kitabayashi T (2004). Concurrent validity of tests to measure the coordinated exertion of force by computerized target pursuit. Perceptual & Motor Skills, 98: 551-560.
Ohkawa H, Ohishi N, Yagi K (1979). Assay for lipid peroxides in animal tissues by thiobarbituric acid reaction. Anal. Biochem. 95: 351–358.
Osinubi AA, Leke Jacob Medubi, Edidiong N. Akang, Lawal K. Sodiq, Titilola A. Samuel, Taiwo Kusemiju, James Osoluc, Danladi Madud, Olufemi Fasanmade (2018). A comparison of the anti-diabetic potential of D-ribose-L-cysteine with insulin, and oral hypoglycaemic agents on pregnant rats. Toxicology Reports 5: 832–838
Pages 832-838, Puhr S, Derdzinski M, Parker AS, et al. Real-world hypoglycemia avoidance with a predictive low glucose alert does not depend on frequent screen views. J Diabetes Sci Technol 2020; 14: 83–86.Yu Kuei Lin
Puhr S, Derdzinski M, Parker AS, Welsh JB, Price DA. (2020) Real-World Hypoglycemia Avoidance With a Predictive Low Glucose Alert Does Not Depend on Frequent Screen Views. J Diabetes Sci Technol.,14(1):83-86.
Ravikumar R, Krishnamoorthy P, Kalidoss A (2010). Antidiabetic and Antioxidantefficacy of Andrographispaniculata in Alloxanized Albino rats. Int. J. Pharm. Technol, 2(4): 1016-1027.
Sedlak J and Lindsay RH (1968). Estimation of Total, Protein-Bound, and Nonprotein Sulfhydryl Groups in Tissue with Ellman’s Reagent. Analytical Biochemistry, 25, 192-205.
Siddalingaswamy M, Rayaorth A, Khanum F (2011) Anti-diabetic effects of cold and hot extracted virgin coconut oil. Journal of Diabetes Mellitus, 1:118-123.
Soto C, Pérez J, García V, Uría E, Vadillo M, Raya L (2010) Effect of Silymarin on Kidneys of Rats Suffering from Alloxan-Induced Diabetes Mellitus. Phytomedicine, 17, 1090-1094.
Sundaram RK, Bhaskar A, Vijayalingam S (2006). Antioxidant status and lipid peroxidation in type II diabetes mellitus with and without complications. Clin. Science; 90: 255–260.
Yu J, Zhang Y, Sun S, Shen JP, Qiu J, Yin XX, Yin HL, Jiang SJ (2006). Inhibitory Effects of Astragaloside IV on Diabetic Peripheral Neuropathy in Rats. Canadian Journal of Physiology and Pharmacology, 84, 579- 587.
Yu KL, Simon JF and Rodica P (2020) Hypogycemia unawareness and autonomic dysfunction in diabetes: lessons learned and roles of diabetes technologies. Journal of Diabetes Investigation, 11(6): 1388-1402

