1Faculty of Medicine, University of Medical Sciences of Villa Clara (UCM-VC), 50200 Cuba.
2Faculty of Health Technology and Nursing (FTSE), University of Medical
Sciences of Villa Clara (UCM-VC), 50200 Cuba and Central University “Marta Abreu”
of Las Villas. Villa Clara, 50100 Cuba
3Faculty of Medicine, University of Medical Sciences of Villa Clara (UCM-VC).
Polyclinic “Marta Abreu” Santa Clara, Villa Clara, 50100 Cuba.
4Provincial Meteorological Center of Villa Clara, 50100 Cuba.
5Specialist in Hygiene and Epidemiology. Assistant Director of Hygiene and
Epidemiology, XX Anniversary Polyclinic. Villa Clara, 50100 Cuba.
Corresponding author email: rigoberto.fimia66@gmail.com
Article Publishing History
Received: 15/09/2022
Accepted After Revision: 21/03/2023
Currently, new technological advances in biomedicine make the creation of multidisciplinary teams of vital importance. These groups can be made up clinicians, epidemiologists, mathematicians, statisticians, computer scientists, biologists, among others, all together they can achieve an accurate prediction of infectious diseases and thus draw up the appropriate strategies by the competent authorities. The fundamental objective of this work is to obtain, through Regressive Objective Regession (ROR), the modeling of the next positive case that arrived with COVID-19 without performing PCR at the “Marta Abreu” Trashing Polyclinic in the city of Santa Clara. In this work, daily data were used from January to March corresponding to the year 2021 of the number of Covid-19 cases in the “Marta Abreu” Teaching Polyclinic in the city of Santa Clara, in the province of Villa Clara, Cuba, a total of 3294 cases of them 58 positive, of which they are assigned in the database an order number (No) according to how they were registered in the database. In the short-term modeling, the model was assigned to 19.7% with an error of0.12 the dichotomous variables, saw tooth and inverted saw tooth, and the risk returned in 1.3 and 12 cases, the trend is negative and not significant. The ROR modeling of predictions obtained give very significant results for the study of the COVID-19 pandemic at the Marta Abreu Teaching Polyclinic. With the results of the study, the authorities are provided, and in fact they are already doing so, with information on the short-and medium-term behavior of variables of great interest to understand the expansion of SARS-CoV2, which could be used for decision-marking.
Coronavirus; Covid-19; Mathematical Modeling; Ror Model.
González M. Z, Fimia-Duarte R, Fernández F. M, Rodríguez R. O, Garcia M. E. L, Izquierdo Y. P, Valledor M. I. N. Modeling of a Positive Case of Covid-19 Through Regressive Objective Regression Without Doing PCR. Biosc.Biotech.Res.Comm. 2023;16(1).
González M. Z, Fimia-Duarte R, Fernández F. M, Rodríguez R. O, Garcia M. E. L, Izquierdo Y. P, Valledor M. I. N. Modeling of a Positive Case of Covid-19 Through Regressive Objective Regression Without Doing PCR. Biosc.Biotech.Res.Comm. 2023;16(1). Available from: <a href=”https://bit.ly/3E4y6fZ“>https://bit.ly/3E4y6fZ</a>
INTRODUCTION
Infectious diseases have historically had a great impact on morbidity and mortality (Gubler, 2002), which surely led to the prediction of the evolution of epidemics for centuries (Osés et al., 2017).
The great development acquired by different sciences, such as epidemiology, mathematics, statistics, computer science, has led to the current generation of new techniques in emerging and recurrent procedures in the field of biostatistics and bioinformatics (spatial statistics, neural networks and functional data analysis, among others) to describe the importance of mathematical models in infectious diseases (Casals & Caylà, 2009).During this anti-epidemic battle, next to medical and biological research, theoretical studies based on statistical or mathematical models can also play a non-negligible role in understanding the characteristics of the epidemic, in predicting the tipping point and the final time future potential growth, help to estimate the risk to other countries and in deciding on measures that contribute to curb the spread of the disease (Funk et al., 2017).Estimating changes in transmission over time can provide insight into the epidemiological situation, and the estimate identifies whether control measures are having a desired effect (Vilches, 2020).
The use of predictive statistical models in the health sciences has grown significantly in recent years (Cortellis, 2020; Ivorra & Ramos, 2020; Osés et al., 2020). These emerge as an important link between statistics and medical practice; they are of great help in decision-making and allow the creation of various systems and tools useful to reduce uncertainties, ensure better performances and establish effective control measures for diseases (López et al., 2016; Osés et al., 2020). Analyses of predictions can inform about future potential growth and helps to estimate risk to other countries (Funk et al., 2017). Statistical predictive models have been using for predictions of the likely evolution of COVID-19, among which can be found moving average model, automatic regression integrated (ARIMA), Brown / Holt linear exponential smoothing methods and Objective Regression-ROR methodology (Osés et al., 2020; Prades & Martin, 2020; Vilches, 2020).
Scientists around the world began to work on the mathematical modeling of the epidemic caused by the new SARS-CoV-2 coronavirus causing COVID-19, using various techniques and mathematical models (Osés et al., 2020; Sun et al., 2020; Yi et al., 2020; Osés et al., 2021a,b). Different avenues have been used for such mathematical modeling: classical modeling for epidemics with SIR models based on ordinary differential equations (Bacaër, 2020; Cagigal & Becario, 2020; Dayun et al., 2020). In the modeling of COVID-19, statistical time series models, predictive models using the Internet, and models based on artificial intelligence and Machine Learning stand out. The aforementioned models take into account a series of parameters that allow the inclusion of several factors in order to express the realities of the epidemics as well as possible (Dayun et al., 2020; Medina, 2020; Osés et al., 2020). The main objective of the present work was to obtain, by means of the Objective Regression Regressive (ORR), the modeling of the next positive case that arrives with Covid-19 without PCR at the “Marta Abreu” polyclinic in the city of Santa Clara, Villa Clara, Cuba.
MATERIAL AND METHODS
In this study, the daily data from January to March 2021 were used for the number of COVID-19 cases from the “Marta Abreu” Polyclinic, located in the city of Santa Clara, Villa Clara province, Cuba. Of 3 294 cases, 58 of them were positive, of which an order number (No) was assigned in the database, as they were registered in the database. These data were taken from the statistics department of the polyclinic referred to above. The forecast was performed with the use of the methodology of Regressive Objective Regression (ROR), which has been implemented in different variables, such as viruses and bacteria circulating in Villa Clara province (Osés, 2004; Osés & Grau, 2011).
The Regressive Objective modeling (ROR) is based on a combination of Dummy variables with ARIMA modeling, where only two Dummy variables are created and the trend of the series is obtained; it requires few cases to be used and also allows using exogenous variables that make it possible to model and forecast in the long term, depending on the exogenous variable; it has given better results than ARIMA in some variables, such as HIV modeling, entities of viral etiology/arbovirosis and parasitic entities (Osés & Grau, 2011; Fimia et al. , 2017; Osés et al., 2020).
In the ROR methodology, in a first step, dichotomous variables DS, DI and NoC are created, where: NoC: Number of cases of the base, DS = 1, if NoC is odd; DI = 0, if NoC is even, when DI=1, DS=0 and vice versa.Afterwards, the regression analysis is performed with the SPSS version 19.0 statistical package (IBM Company), specifically the ENTER method where the predicted variable and the ERROR are obtained. Then the autocorrelograms of the variable ERROR will be obtained, paying attention to the maximums of the significant partial autocorrelations PACF. The new variables are then calculated according to the significant Lag of the PACF. Finally, these regressed variables are included in the new regressions in a process of successive approximations until white noise in the regression errors is obtained.
The research was subject to ethical standards, where all the information collected and provided was used only for the stated purpose. It did not involve physical or psychological affectations, in order to be able to generate new knowledge without violating the ethical principles established for these cases. On the other hand, all authors involved in the research, publication and dissemination of the results are responsible for the reliability and accuracy of the results shown (DHAMM, 2013).
RESULTS AND DISCUSSION
The data on COVID-19 confirmed cases at the “Marta Abreu” teaching polyclinic are shown in Table 1. The risk of contracting COVID-19 was calculated by descriptive statistics, where a value of zero was assigned if the PCR was negative, and if the PCR was positive, a value of Risk 1 was assigned (Table 1), showing a mean value of 0.0176 with a standard deviation of 0.13.
Table 1. COVID-19 confirmed at the “Marta Abreu” teaching polyclinic during the year 2021
| Descriptive statistics | |||||
| N | Minim. | Max. | Half | Typ. desvia. | |
| Risk Covid-19 | 3294 | .00 | 1.00 | .0176 | .13154 |
| N valid (according to list) | 3294 | ||||
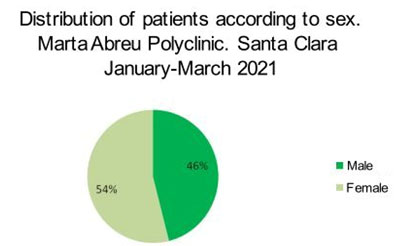
Another result obtained refers to the distribution according to sex, 54% of the patients corresponded to the female sex (Figure 1). The mean value of this variable corresponds to 19.33 cases with a standard deviation of 12.01 cases.
Figure 1: Distribution of patients according to sex in the “Marta Abreu” polyclinic. January to March 2021
The COVID-19 cases were modeled in the short term using the ROR methodology. Table 2 shows how 99.9% of the variance is explained with an error of 80 cases; the Durbin Watson statistic is close to 2, so we are in the presence of a model that adequately explains the variance.
Table 2. Summary of the model using ROR Regression
|
Summary of modelc,d |
|||||
| Model | R | R squaredb | R squared corrected | Standard error of estimation | Durbin-Watson |
| 1 | .999a | .998 | .998 | 80.4879 | 2.132 |
| a. Predictors: Lag5No, DS, DI, Lag12No, Lag1No, NoC b. For regression through the origin (the model without intercept), R-squared measures the proportion of the variability in the dependent variable about the origin explained by the regression. This CANNOT be compared to R-squared for models that include intercept. c. Dependent variable: No d. Linear regression through the origin. |
|||||
The analysis of variance of the ANOVA model for COVID-19 is shown in table 3. Fisher’s test had a value of 4066.33, interpreted as significant at 100%, thus proving that the sample variances are not equal.
Table 3. Analysis of Variance of the model for COVID-19
|
ANOVAa,b |
||||||
| Model | Sum of squared | gl | Quadratic mean | F | Sig. | |
| 1 | Regression | 158057429.217 | 6 | 26342904.870 | 4066.333 | .000c |
| Residuo | 259131.783 | 40 | 6478.295 | |||
| Total | 158316561.000d | 46 | ||||
| a. Dependent variable: No b. Linear regression through the origin c. Predictors: Lag5No, SD, DI, Lag12No, Lag1No, NoC d. This total sum of squares is not corrected for the constant because the constant is zero for regression through the origin. |
||||||
The ROR model in question (Table 4) is made up of the following variables, DI and DS which are dichotomous variables, saw tooth DS and inverted saw tooth DI and of the Order number of the patient returned in 1.5, and 12 cases (Lag1No; Lag5No and Lag12No, the trend is positive because the number of patient is increasing and is significant at 99%.
Table 4. Conformation of the ROR model with its variables
|
Coefficientsa,b |
||||||
| Model | Unstandardized coefficients | Standardized coefficients | t | Sig. | ||
| B | Standard
error |
Beta | ||||
| 1 | DS | -438.903 | 135.185 | -.167 | -3.247 | .002 |
| DI | -400.395 | 137.034 | -.153 | -2.922 | .006 | |
| Tendency | 31.932 | 8.825 | .652 | 3.618 | .001 | |
| Lag12No | -.206 | .082 | -.136 | -2.507 | .016 | |
| Lag1No | .799 | .105 | .772 | 7.641 | .000 | |
| Lag5No | -.108 | .082 | -.090 | -1.308 | .198 | |
| a. Dependent variable: No b. Linear regression through the origin |
||||||
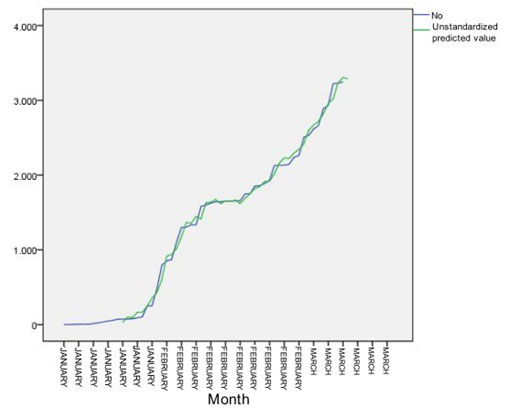
The concordance between the Actual value of the Patient Order Number (No) and the non-standardized predicted value can be appreciated (Figure 2). The actual and predicted value of the positive patient number allows for more accurate surveillance of COVID-19 positive cases without PCR. As can be seen there are highs and lows that the model describes with certainty.
Figure 2. Concordance between the Actual value of the Patient Order Number (No) and the unstandardized predicted value
DISCUSSION
The modeling of epidemics is something historical and has been improved with the advance of science and technologies, which demonstrates the essential role of mathematics to indicate where the disease can move and give suggestions on how to decide (Vidal et al., 2020). COVID-2019 disease has been recognized as a global threat, in which predictive models for the epidemiological trend of its prevalence and incidence have been used worldwide, some of the models used being: Brown’s exponential smoothing used in Russia, and time series models (ARIMA) used in Turkey, Germany, France, Italy, Thailand, China, South Korea and Iran (Prades & Martin, 2020).
When analyzing the predictions for the confirmed cases to COVID-19 in the Teaching Polyclinic “Marta Abreu” without doing PCR through the Objective Regressive Regression, we can appreciate that the mathematical model has followed what happened in reality, this is the most important result, which coincides with results obtained in previous years for other entities and living organisms (Fimia et al., 2017; Osés et al., 2017; Fimia et al., 2019), agreeing also, with other models applied for COVID-19 in other countries (Prem et al., 2020).
By analyzing the concordance between the Actual value of the Patient Order Number (No) and the non-standardized predicted value, it allowed to determine the actual and predicted value of the number of the positive patient without doing PCR. These results are in agreement with similar studies carried out in Villa Clara province (Osés et al., 2020). The increase in the number of female patients infected by the new coronavirus in the mentioned health area shows that they are as susceptible to the disease as the rest of the population. They should all follow the same biosecurity measures as the Ministry of Public Health for the entire population. It coincides with the daily reports of MINSAP, that the female sex is the one with the highest number of cases reported in recent weeks (MINSAP, 2021).
All that has been analyzed shows us that teamwork is essential to achieve success in the confrontation and control of this pandemic that today plagues the planet and even the exchange of experiences and results between professionals of different specialties (Abdullah et al., 2020), working groups of different specialties and branches of scientific knowledge and geographical latitudes, with emphasis between groups in our area and the region is essential in the current epidemiological context, due to climatic and sociocultural similarities in many cases (Fimia et al., 2019; Marín et al., 2020; Salas et al., 2020).
CONCLUSION
The ROR modeling in function of the next positive case with arrival in Santa Clara without PCR, gave very significant results for the study of the COVID-19 pandemic in the “Marta Abreu” polyclinic, so that the results of the study provide the authorities with information on the short and medium term behavior of variables of great interest to understand the expansion of SARS-CoV2, which would be a good tool for making timely and correct decisions.
REFERENCES
Abdullah, A., Faisal, S., Jan, H., Zainab, R., Rahman, A., Khan, A., Bibi, B., Ishaq, H. (2020). A Perspective study on oral-fecal transmission of COVID-19, its prevention and management. International Cardiovascular Forum Journal 20: 10-15.
Bacaër, N. (2020). Un modelo matemático de la epidemia de coronavirus en Francia. https://hal.archives-ouvertes.fr/hal-02509142v2/fi le/epidemie_es.pdf
Cagigal, M.A., Becario, F.P. (2020). Modelado y análisis de la evolución de una epidemia vírica mediante filtros de Kalman: el caso del COVID-19 en España. https://www.us.es/actualidad-de-la-us/modeladoy-analisis-de-la-evolucion-de-una-epidemia-viricamediante-filtros-de.
Casals, M.G.K., Caylà, J.A. (2009). Modelos matemáticos utilizados en el estudio de las enfermedades transmisibles. Revista Española de salud Pública 83 (5): 689-695. Disponible en: http://scielo.sld.cu/scielo.php?script=sci_arttext&pid=S1135-57270090005000010&Ign=es
Cortellis, T.M. (2020). Disease Briefing: Coronaviruses. A Clarivate Analytics solution. 3.23.2020. 51 pp. In: https://clarivates.com/wp.content/uploads/dlm_uploads/2020/01/CORONAVIRUS-REPORT-23.3.2020.pdf.
Dayun, K., Hyunho, C., Jong-Hun, K., Jungsoon, C. (2020). Spatial epidemic dynamics of the COVID-19 outbreak in China. http://creativecommons.org/licenses/by-ncnd/4.0/
DHAMM (Declaración de Helsinki de la AMM). (2013). Principios éticos para las investigaciones médicas en seres humanos. 64ª Asamblea General, Fortaleza, Brazil, octubre. World Medical Association, Inc. – All Rights reserved. 9 pp.
Fimia, D.R., Osés, R.R., Aldaz, C.J.W., Artíles, S.J.M., Iannacone, J., Zaita, F.Y., Gómez, C.L., Cabrera, S.M.E. (2017). Modelación y predicción de las Infecciones Respiratorias Agudas (IRA) utilizando las variables climáticas en la provincia Villa Clara, Cuba. The Biologist (Lima) 15 (Suplemento Especial 1).
Fimia, D.R., Machado, V.I., Osés, R.R., Aldaz, C.J.W., Armiñana, G.R., Castañeda, L.W., Argota, P.G., Hernández, C.L., Iannacone, J. (2019). Modelación matemática de la dinámica poblacional del mosquito Aedes aegypti (Diptera: Culicidae) con algunas variables climáticas en Villa Clara, Cuba. 2007-2017. The Biologist (Lima) 17 (Suplemento Especial 2). Disponible en: https://www.neotropicalhelminthology.com/libros-de-resumenes-de-eventos
Funk, S., Ciglenecki, I., Tiffany, A., Gignoux, E., Camacho, A., Eggo, R.M. (2017). The impact of control strategies and behavioral changes on the elimination of Ebola from Lofa County, Liberia. Philos Trans. Biological Sciences Journals 372: 20160302.
Gubler, D.J. (2002). The global emergence/resurgence of arboviral diseases as public health problems. Archives of Medical Research 33: 330-342.
Ivorra, B., Ramos, A.M. (2020). Validation of the forecasts for the international spread of the coronavirus disease 2019 (COVID-19) done with the Be-CoDiS mathematical model. MOMAT Group Technical Report, Complutense University of Madrid, 1-14. Doi: http://www.doi.org/10.13140/RG.2.2.3146 0.94081
López, F.R., Yanes, S.R., Suarez, S.P., Avello, M.R., Gutiérrez, E.M., Alvarado, F.R. (2016). Modelo estadístico predictivo para el padecimiento de pie diabético en pacientes con diabetes mellitus tipo II. MediSur 14: 42-52. Disponible en: http://scielo.sld.cu/scielo.php?script=sci_arttext&pid=S1727-897X2016000100009&Ign=es
Marín, M.O., Zambrano, C.A.W., García, T.E.G., Ortiz, G.J.I., Vivas, R.D.E., Marín, S.O. (2020). Modelamiento matemático del comportamiento epidemiológico de la pandemia COVID-19 en China. The Biologist (Lima) 18: 83-89.
Medina, M.J.F. (2020). Estudio sobre modelos predictivos para la COVID-19 en Cuba. MediSur 18: 431-442. http://scielo.sld.cu/scielo.php?script=sci_arttext&pid=S1727-897X2020000300431&Ign=es&tIgn=es
MINSAP (Ministerio de Salud Pública). (2021). Sitio oficial de gobierno de Cuba (MINSAP). Parte del cierre del día 21 de junio de 2021. Recuperado el 17 de julio de 2022. URL: http://salud.msp.gob.cu
Osés, R. (2004). Series meteorológicas de Villa Clara y otras provincias. Modelos y pronósticos [tesis maestría]. Santa Clara: Repositorio de la Universidad Central “Marta Abreu” de Las Villas.
Oses, R., Grau, R. (2011). Modelación regresiva (ROR), versus modelación ARIMA, usando variables dicotómicas en mutaciones del VIH. Universidad Central Marta Abreu de las Villas, 25 de Febrero. Editorial Feijóo. ISBN: 978-959-250-652-7.
Osés, R.R., Fimia, D.R., Iannacone, J., Carmenate, R.A., González, G.R., Gómez, C.L., Figueroa, C.Y., Cabrera, S.M.E. (2017). Modelación y predicción de la fasciolosis en Villa Clara, Cuba. Biotempo 14: 27-34.
Osés, R.R., Osés, L.C., Fimia, D.R., González, M.A., Iannacone, J. (2020). Pronóstico de la COVID-19 por medio de la metodología de regresión objetiva Regresiva en Villa Clara y Cuba. The Biologist (Lima) 18: 171-184.
Osés, L.C., Osés, R.R., Fimia, D.R., Zambrano, G.M.P., Wilford, G.F.M. (2021a) Comparison of lineal ROR vs Nonlinear Weibull model for COVID-19 in Iraq. Himalayan Journal of Applied Medical Sciences and Research 2: 88-96.
Osés, R.R., Osés, C.L., Fimia, D.R., González, M.A., Iannacone, J., Bruna, S.T., Wilford, G.F.M. (2021b). Age Prediction for COVID-19 Suspects and Contacts in Villa Clara Province, Cuba. EC Veterinary Science 6: 41-51.
Prades, E.E., Martin, S.D. (2020). Modelos estadísticos para las predicciones de la COVID-19 en Cuba. Revista Cubana de Higiene y Epidemiologia 57: e303. Disponible en: http://scielo.sld.cu/scielo.php?script=sci_arttext&pid=S1561-30032020000100005&Ign=es&tIng=es
Prem, K., Liu, Y., Russell, T.M., Kucharski, A.J., Eggo, R.M., Davies, N., Jit, M., Klepac, P. (2020). The effect of control strategies to reduce social mixing on outcomes of the COVID-19 epidemic in Wuhan, China: amodeling study. The Lancet Public Health 5: 261-270.
Salas, A.R., Iannacone, O.J., Guillén, O.A., Tantaléan, D.J., Alvariño, F.L., Castañeda, P.L., Cuellar, P.L. (2020). Coronavirus Covid-19: Conociendo al causante de la pandemia. The Biologist (Lima) 18: 9-27.
Sun, Z., Thilakavathy, K.T., Kumar, S.S., He, G., Liu, S.V. (2020). Potential Factors Influencing Repeated SARS Outbreaks in China. International Journal of Environmental Research and Public Health 17: 16-33.
Vidal, L.M., Guinovart, D.R., Baldoquin, R.W., Valdivia, O.N.C., Morales, L.W. (2020). Modelos matemáticos para el control epidemiológico. Educación Médica Superior 34: e2387.
Vilches, M.C. (2020). COVID-19: Modelos de pronósticos para Villa Clara. Vanguardia. Sábado 2 de mayo de 2020; Infografía: 8.
Yi, Y., Lagniton, N.P.P., Ye, S., Li, E., Xu, R.H. (2020). COVID-19: what has been learned and to be learned about the novel coronavirus disease. International Journal of Biological Sciences 16: 1753-1766.

