V. Ulagamuthalvi1![]() , G. Kulanthaivel2 , G. Sri Nikhil Reddy3 and G. Venugopal3
, G. Kulanthaivel2 , G. Sri Nikhil Reddy3 and G. Venugopal3
1School of Computing, Sathyabama Institute of Science and Technology, Chennai, India
2NITTTR, Chennai, India.
3School of Computing, Sathyabama Institute of Science and Technology, Chennai, India
Corresponding author email: muthalvi73@gmail.com
Article Publishing History
Received: 12/04/2020
Accepted After Revision: 19/05/2020
Parkinson’s disease is Progressive nervous system disorder. It affects movement of the human beings. Symptoms starts gradually. The result of syndrome is the patient is not able to do the activities like talking, strolling, and tremor during motion. Normally the physicist identified this disease using two scales are Hoehn and Yahr scale and Unified Parkinson’s Disease Rating Scale. There are so many features in the dataset. Audio signal is one of features taken in the dataset from UCI dataset repository. Parkinson’s disease patient has a low-volume noise with a monotone quality.
In This system different audio signals like jitter, simmer, New Human Revolution (NHR), Multidimensional Voice Program (MDVP) are given as a train and test data. MinmaxScale method is used for preprocessing the data. Threshold value and correction coefficient of audio data are played as a parameters of feature selection. The Machine Learning classifiers are utilized to identify the disease. In our model we employed Logistic regression and eXtreme Gradient Boosting (XGBoost) classifiers for classification. Among
twenty one features only twelve played as an important role for predicting the disease. The system has achieved result in predicting whether the Parkinson’s disease patient is healthy or not. The performance of machine learning classifier XGBoost provided the accuracy of 96% and the Matthews Correlation Coefficient (MCC) of 89%.
Multidimensional Voice Program Matthews Correlation Coefficient Parkinson ’s disease, XGBoost.
Ulagamuthalvi V, Kulanthaivel G, Reddy G. S. N, Venugopal G. Identification of Parkinson’s Disease Using Machine Learning Algorithms. Biosc.Biotech.Res.Comm. 2020;13(2).
Ulagamuthalvi V, Kulanthaivel G, Reddy G. S. N, Venugopal G. Identification of Parkinson’s Disease Using Machine Learning Algorithms. Biosc.Biotech.Res.Comm. 2020;13(2). Available from: https://bit.ly/2UmRL3X
Copyright © Ulagamuthalvi et al., This is an open access article distributed under the terms of the Creative Commons Attribution License (CC-BY) https://creativecommns.org/licenses/by/4.0/, which permits unrestricted use distribution and reproduction in any medium, provide the original author and source are credited.
INTRODUCTION
Parkinson’s disease is described as a neuro degeneration disorder which is death of dopamine generating cells (Jankovic et al 2008). The loss of dopaminergic neurons in the mid brain decrease the achievable rate of communication. Parkinson disease affects central nervous system which leads to the effect in motor system, the main PD symptoms are tremor, rigidity and movement disorders, (Ramezani et al 2017)
The people who are having Parkinson’s Disease mostly 90% of them have a speech impairment, only 3% to 4% of PD patient receives speech therapy and also only one of the most important factor for PD is age, the patient of PD are most of them are aged between 45-60, (Levine et al 2003).
The speech of PD patient have change in the frequency specter in their voice because they loss the control of the limb, which decrease the frequency of the audio. So, the low frequency region gives important data to differentiate the speech impairments in PD. Unified Parkinson disease rating scale (UPDRS) is used to find the severity of the PD by help of clinical expertise and experience (Dobson et al 2008).
Centre for Machine Learning and Intelligent system (2009) given that we perform a feature selection for the audio features dataset created by Max Little of the University of Oxford, high prediction has been achieved with classification accuracy, algorithm predict various accuracy for various variables that are relevant on the other attributed present in the feature dataset, as feature plays important role the dataset which we taken from UCI repository contains 21 features and applied a Pearson’s correlation coefficient on feature to determine the coefficient correlation among features.
Neharika et al (2020) have given the Multi-Dimensional Voice Program (MDVP) is a computer program that can calculate as many as 33 acoustic parameters from a voice sample. It is standard. Dobson et al (2008) presented this section presents the comparative determination endeavors, here both model-based and model-free techniques algorithms are used for predicting Parkinson’s disease. Rätsch et al (2001) have presented that most commonly used model-based tool is Logistic regression which it measures the outcome on a binary scale (e.g. healthy/not), here classification process carried out based on the estimation probabilities. Whereas model-free methods like XGBoost adapt to the intrinsic.
Fietzek et al (2020) given the high dataset size requirements are met through a supervised data collection approach by which we were able to generate informative annotations in one-minute intervals. To our knowledge, collecting expert annotations on a one-minute basis has not been reported to date at such a large scale.
Abós et al (2017) described that data characteristic without any priori model. We used XGBoost algorithm for classification, XGBoost algorithm benefit from constant learning or retraining, they don’t guarantee optimized classification/regression. However, when trained and maintained, XGBoost learning method have great potential than Logistic regression in solving real world problems. The prior report of using XGBoost technique to diagnose Parkinson’s disease are determines according to their cognitive status.
XGBoost provided an accuracy of 96% for classification the dataset and logistic regression provided an accuracy of 79%, this system that predict PD has been formulated which compares the accuracy of LR and XGBoost on the train and test dataset. It utilized co-efficient correlation to find the correlation among features, on comparison it provided that XGBoost performed better than LR with accuracy of 96%.
Mohammad et al (2014) performed a comparative analysis to detect Parkinson Disease using various classifiers like Support vector Machine (SVM), Random Tree (RT), feed forward back-propagation Artificial Neural Network (FBANN) classifiers are utilized in this system. Geetha et al (2011) presented a comparison was made between the classifiers to differentiate between PD and Healthy persons and the study has the dataset contains 195 voice samples and consist of both male and female. The dataset has 23 PD patient and healthy, by comparing all the classifiers, FBANN classifier has achieved 97.37% accuracy.
Srilatha et al (2019) have presented Classification is an important task within the field of computer vision. Image classification refers to the labelling of images into one of a number of predefined categories that includes image sensors, image pre-processing, object detection, object segmentation, feature extraction and object classification. Many classification techniques have been developed for image classification. The highest concentration is on using various classifiers combined with several segmentation algorithms for detection of tumor using image processing.
Shraddha et al (2019) have proposed as Performance parameters used by authors are true positive, true negative and accuracy. Authors make use of various semi-supervised classifiers for intrusion detection. All classifiers used NSL KDD dataset for intrusion detection.
Ramani et al (2011) discussed a system to classify PD and Non-PD patient was proposed by utilized Binary Logistic Regression, Linear Discriminant Analysis LDA, Random tree and SVM. The dataset used in this system are from UCI repository of PD, the training dataset consist of 195 samples with 21 features, here the LDA and random tree achieved an accuracy greater than 90%.
Resul et al (2010) used various classification models to identify PD. Classification techniques were implemented and analyzed, they are neural network, regression and decision tree. For classification various evaluation methods were used, the performance of the classifiers were evaluated from the results, only Neural network classifier yield the good result among other, here the input dataset was randomly inserted into train and test dataset.Paul et al (2019) have used a machine learning techniques for predicating student dropout using data mining. In this model decision tree was used to predict the dropout in student and they obtained an accuracy with 97.69% and the prediction was done by using various parapets, which are considered for every student.
Mallikarjuna et al (2020) presented the feedback-based approach comparison of the normality and abnormality with the back propagation approach. In the training phase, the extracted feature sequence of a normal walking and abnormal walking, the three classes A, B, C, D normal, Parkinson gait, Hemiplegic gait, Neuropathic gait data sets compared with the normal data set.
MATERIAL AND METHODS
In this system, we applied two machine learning algorithms which are Logistic Regression and XGBoost. We implemented this model to find the best model among them for the datasets
Logistic regression: Mohammad et al (2013) given as Logistic Regression is the appropriate regression analysis to conduct when the dependent variable is dichotomous. It is used to explain the relationship between one or more independent variables and one dependent binary variables, the dependent variable must be binary in nature, e.g. 0 or 1. They shouldn’t be high correlation among the prediction, this can be assessed by a correlation matrix.
Here the outcome has two classes, Logistic regression starts with different model setup than linear regression instead of modeling Y as a function of X directly, we model the probability that Y is equal to class 1, gives X. First, abbreviation P(X)=P(Y=1/X).
XGBoost: Zhang et al (2019) presented XGBoost is a boosting algorithm, it is statistical learning method and derived from gradient boosting decision tree, it has better performance and optimization. The reason why we used XGBoost is it has good efficiency and feasibility, XGBoost allows dense and sparse matrix as the input and a numeric vector uses integer starting from 0 for classification, we can add number of iteration to the model A dataset with of n samples and d features of every sample then is the prediction from decision tree.
The prediction score of each individual are summed up to get the final score. Mathematically, our model in the form
![]()
Where k is number of trees, s is function in function space
Data preprocessing
MinMaxScaler, Normalizer are method in scikit-learn are preprocessing methods, based on our features values we select the method, as we know machine learning algorithm will perform better and faster when features are relative or similar scale, we suggest MinMaxScale () for preprocessing, as it subtracts the minimum value in feature and divide with its range, difference of maximum and minimum is range MinMaxScale () return the default range 0 to1.
Feature selection
Arefi et al (2011) prescribed as we know, features play important role in classification , there are different approach in feature selection and based on the threshold value and benchmark algorithm we determine the optimality of feature in the dataset, Correlation coefficient features selection is the most widely used parameter, because feature selection is based on their correlation factor among the features (Shahbakhti et al 2013).
Let suppose f1 and f2 are two correlated features then to find Pearson’s correlation coefficient (ƿ)
![]()
Where, cov(x, y) are covariance of variable x and y
![]()
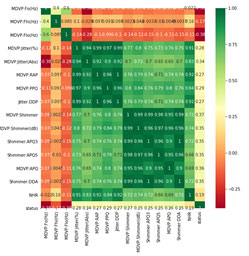
Figure 1 shows the correlation between features, it differentiate the strong positive and negative correlation among features
Figure 1: Cross correlation among features
RESULTS AND DISCUSSION
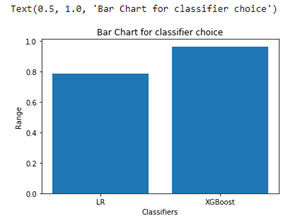
By comparing the result of the system, the maximum classification rate is achieved by XGBoost than LR with an accuracy 96%, whereas LR achieved only 79% accuracy. Figure 2 shows the bar chart of the classifiers accuracy and correlation coefficient of the XBoost and Linear Regression. Figure 1 shows that only 12 features are the most important and characteristic among other features present in the dataset.
Table 1. Classification Accuracy of both model
| Algorithm | Accuracy | MCC |
| Logistic Regression | 0.79 | 0.42 |
| XGBoost | 0.96 | 0.89 |
Figure 2: Bar chart of classifiers accuracy
The entitled technology will permit us to compare two or more new algorithms with this XBoost and show the performance of the XBoost classifier.
CONCLUSION
The aim of the study is to analyze which algorithm provide the high accuracy of prediction for the Parkinson’s disease dataset, here the classification accuracy was studied and compared, with good performance and fast implementation XGBoost achieved a high accuracy with 96%. This system provides the comparison between machine learning classifiers of LR and XGBoost in PD disease diagnosis with high dimensional data.
REFERENCES
Abós Alexandra Abós Hugo C Baggio Bàrbara Segura (2017) Discriminating cognitive status in Parkinson’s disease through functional connectomics and machine learning Scientific reports Vol 7 No. 45347.
Arefi Shirvan R E Tahami (2011) Voice analysis for detecting parkinson’s disease using genetic algorithm and KNN classification method Proc 18th Int Con on Biomedical Engineering, Tehran Pages 550-555.
Mallikarjuna B R. Viswanathan and Bharat Bhushan Naib (2020) feedback-based gait identification using deep neural network classification, Journal of Critical Reviews Vol 7 Pages 661-667.
Center for Machine Learning and Intelligent System, website: http://Archive.Ics.UCI.Edu/ML/Datasets/Parkinsons. (2009).
Dobson a J Barnett A (2008) an introduction to generalized linear models, CRC press.
Franz M J Pfister Terry Taewoong Um Daniel C Pichler (2020) High-Resolution Motor State Detection in Parkinson’s Disease Using Convolutional Neural Networks Scientific Reports Vol 10 5860.
Geetha R and R Sivagami (2011) Parkinson Disease Classification Using Data Mining Algorithms International Journal of Computer Applications Vol 32 No 9 Pages 17-22.
Gladence L Mary M Karthi V Maria Anu (2015) A statistical comparison of logistic regression and different Bayes classification methods for machine learning Journal of Engineering and Applied Sciences Vol 10 No14 Pages 5947-5953.
Jankovic J (2008) Parkinson’s disease: clinical features and diagnosis Journal of Neurology, Neurosurgery & Psychiatry Vol 79 Issue 4 Pages 368-376.
Levine C B Fahrbach K R Siderowf a D R P Estok V M Ludensky S D Ross (2003) Diagnosis and treatment of Parkinson’s disease: a systematic review of the literature, Evid. Rep. Technol. Assess No. 57 Pages 1–4.
Mercy Paul Selvan Nagubadi Navadurga Nimmagadda Lakshmi Prasanna (2019), An Efficient Model for Predicting Student Dropout using Data Mining and Machine Learning Techniques International Journal of Innovative Technology and Exploring Engineering Vol 8 Issue 9S2 Pages 750 – 752.
Mohammad S Islam Imtiaz Parvez Hai Deng Parijat Goswami (2014) Performance Comparison Of Heterogeneous Classifiers For Detection Of Parkinson’s disease Using Voice Disorder (Dysphonia) International Conference On Informatics, Electronics & Vision (Iciev) Pages 1 – 7.
Mohammad shahbakhti Danial Taherifar (2013) linear and Non-Linear speech features for detection of Parkinson’s disease BMEiCON-2013.
Murugan S Kulanthaivel G V Ulagamuthalvi (2019) Selection of test case features using fuzzy entropy measure and random forest Ing. Des Syst. d’Information, Vol 24 No 3 Pages 261–268.
Murugan S. and Ramachandran V. (2012) Aspect Oriented Decision Making Model for Byzantine Agreement, Journal of Computer Science Vol 8 No. 3 Pages 382-388.
Neharika D Bala Anusuya S (2020) Machine Learning Algorithms for Detection of Parkinson’s Disease using Motor Symptoms: Speech and Tremor, International Journal of Recent Technology and Engineering Vol 8 Issue 6 Pages 47-50.
Ramezani H Akan O B (2017) Rate region analysis of multi-terminal neuronal nanoscale communication channel in 17th IEEE NANO Conf. IEEE.
Rätsch G Onoda T Müller K R (2001) SOF margins for AdaBoost. Machine learning Vol 42 Pages 287–320.
Resul das (2010) A Comparison of Multiple Classification Methods for Diagnosis of Parkinson Disease Expert Systems with Applications Vol 37 Issue 2 Pages 1568-1572.
Shraddha Khonde V Ulagamuthalvi (2019) Fusion of feature selection and Random Forest for an Anomaly based intrusion detection system, Journal of Computational and Theoretical Nan science Vol 16, Pages 3603-3607.
Srilatha. K V Ulagamuthalvi (2019) A Comparative Study on Tumor Classification Research Journal of Pharmacy and Technology Vol 12 No 1 Pages 407-411.
Tsanas M A Little P E McSharry J Spielman L O Ramig (2012) Novel Speech Signal Processing Algorithms for High Accuracy Classification of Parkinson’s Disease in IEEE Transactions on Biomedical Engineering Vol 59 No 5 Pages 1264- 1271.
Zhang J Ren Y Cheng B Wang Z Wei (2019) Health Data Driven on Continuous Blood Pressure Prediction Based on Gradient Boosting Decision Tree Algorithm in IEEE Access Vol 7 Pages 32423-32433.

