Uthirakumar Devaraj![]() , Tamilarasan Shanmugasundaram
, Tamilarasan Shanmugasundaram![]() and Elumalai Balamurugan
and Elumalai Balamurugan![]()
Department of Biochemistry and Biotechnology, Faculty of Science, Annamalai
University, Chidambaram, Tamil Nadu, India.
Corresponding author email: balamurugan_au@yahoo.co.in
Article Publishing History
Received: 25/09/2021
Accepted After Revision: 28/12/2021
Sleep deprivation disrupts most neurotransmitters, which can lead to adverse behavioural changes and other psychiatric illnesses. Many neurotransmitter systems, including dopamine (DA), serotonin (5-HT), norepinephrine (N.E.) and GABA, have been implicated in the pathophysiology of mood disorders. The precise significance of sleep deprivation (S.D.) changes in the neurotransmitter levels and the mechanism underlying behavioural alterations is unknown. According to research, sleep deprivation (S.D.) has a major effect on an individual’s quality of life and ability to perform essential physiological functions. As a result, we wanted to confirm the levels of neurotransmitters and behavioural modifications in zebrafish after 24, 48, and 72 hours of sleep deprivation and glutamate treatment on the sleep-deprived groups.
The T-maze test was used to assess learning and memory alterations in zebrafish. We used the Novel Tank Test (NTT) and Light and Dark Test (LDT) to examine the anxiety-like behaviour. The spectrofluorimetric method was used to determine the quantities of DA, 5-HT, N.E. and GABA. From this study, it is evident that 72h sleep-deprived fish had a loss of learning and memory via T-maze test and also the anxiety levels were very high in the sleep-deprived group than the other groups. The groups that received glutamate after sleep deprivation showed betterment in the behavioural response. Also, the levels of neurotransmitters were increased in the glutamate treated groups than the sleep-deprived groups.
Our findings indicate that sleep loss dramatically impairs behavioural responses and disrupts most neurotransmitter concentrations. When sleep-deprived fish were given glutamate, their behaviour and neurotransmitter levels were nearly identical to those of the control group. This study will have a greater impact on sleep deprivation therapy and pave the way for using the neurotransmitters as external therapeutic agents in treating sleep deprivation and other behavioural changes related to sleep deprivation.It has been suggested that zebrafish is an excellent testing subject for loss of sleep on cognition and that it may also be an efficient model for unravelling the pathways that underpin learning and memory formation.
Anxiety, Behavior, Glutamate, Learning and Memory, Sleep deprivation.
Devaraj U, Shanmugasundaram T, Balamurugan E. Glutamate Elicits Therapeutic Response in Light-Induced Sleep-Deprived Zebrafish, Danio rerio. Isolated from Textile Industry Effluent. Biosc.Biotech.Res.Comm. 2021;14(4).
Devaraj U, Shanmugasundaram T, Balamurugan E. Glutamate Elicits Therapeutic Response in Light-Induced Sleep-Deprived Zebrafish, Danio rerio. Biosc.Biotech.Res.Comm. 2021;14(4). Available from: <a href=”https://bit.ly/3wJrC1j“>https://bit.ly/3wJrC1j</a>
Copyright © Devaraj et al., This is an open access article distributed under the terms of the Creative Commons Attribution License (CC-BY) https://creativecommns.org/licenses/by/4.0/, which permits unrestricted use distribution and reproduction in any medium, provide the original author and source are credited.
INTRODUCTION
Over the last few decades, Danio rerio has grown in popularity as an animal model in heredities and developmental biology. It has also expanded prominence in behavioural studies converging on memory retention (American Psychiatric Association 1994). This little fish exhibits various sleep-like properties, such as circadian control, periods of dormancy followed by an elevated arousal verge, preference for resting sites, and sleep rebound homeostasis (Merikangas et al. 2011; Jansen et al. 2011).
When combined with the zebrafish’s daily circadian cycle, this species is a relevant model for sleep-related studies (Dilsaver 2011). Sleep is a common occurrence in most species, including humans, and has been observed to be an evolutionarily conserved phenomenon (Cantero et al. 2003; McNamara et al. 2008). Sleep is critical for the learning process and memory consolidation, although its mechanisms and functions remain unknown (Besedovsky et al. 2019).
Interrupted sleep has been linked to poor attention and health-related difficulties, both of which have been verified by experimentation (Vogel et al. 1999; Hublin et al. 2001; Rajaratnam 2001; Buzsaki et al. 2002; National Health Interview Survey et al. 2005; Harvey et al. 2008; Centers for Disease Control and Prevention et al. 2011). According to research, sleep deprivation (S.D.) has a major effect on an individual’s quality of life and ability to perform essential physiological functions (Praag et al. 1975; Moore et al. 1975; Serra et al. 1979; Bannerman et al. 2004; Derry et al. 2006; Vadodaria et al. 2017).
Sleep deprivation leads to poor memory acquisition. The sleep stage has a substantial effect on memory consolidation. Slow-wave sleep, for example, is required for the maintenance of memories dependent on the hippocampus, such as declarative and spatial memories, which are more severely affected than other types of memories by sleep deprivation (Graeff et al. 1996; Schildkraut and Massat 2000; Bredy et al. 2013; Shields et al. 2015; Besedovsky et al. 2019).
Sleep deprivation has a noticeable effect on neurotransmitter levels, resulting in detrimental behavioural changes and other health consequences. S.D. has been associated with a variety of neurodegenerative and behavioural disorders. Diminished sleep can be a positive trigger for manic episodes (Berns et al. 2003). Numerous neurotransmitter systems have been linked to behavioural changes, including dopamine (DA), serotonin (5-HT), and norepinephrine (N.E.).
Dopamine (DA) has been implicated in the pathophysiology of manic episodes since the (1970s), and alterations in dopaminergic neurotransmission have been linked to neurobiological abnormalities (Zachmann et al. 1966; Barbose et al. 2011). Clinical findings have established a link between dopamine and manic episodes for many years. Five-hydroxytryptamine (5-HT) is a neurotransmitter that has remained mostly unaltered throughout evolution. It regulates various physiological processes and behaviours, including cardiovascular control, pain sensitivity, eating, reproduction, cognition, impulsivity, aggression, and mood (Weber et al. 2018).
5-HT appears to boost wakefulness and prevent sleep through activating neurotransmitters such as ACh and noradrenaline. Norepinephrine (N.E.) has long been associated with depression and manic episodes (Decker et al. 2000; Machado et al. 2004). Glutamate is the most important excitatory neurotransmitter (Seigel et al. 1984; Berns et al. 2003; Armani et al. 2012). Glutamate has a deleterious impact on brain physiology in circumstances of overexcitation (Tamilselvan et al. 2017). Astrocytes are responsible for 90% of glutamate uptake, highlighting some of the essential characteristics of tripartite synapse integrity and brain function (Brady et al. 2013; Stewart et al. 2019).
The interaction of glutamate with particular membrane receptors is responsible for many neurological activities such as cognition, memory, movement, and sensation; however, excessive extracellular glutamate accumulation contributes to the progression of most neurodegenerative illnesses (Derry et al. 2006). The precise process by which S.D. impacts neurotransmitter levels and emerging repercussions, resulting in behavioural alterations in fish, is unknown. Thus, we attempted to confirm neurotransmitter alterations in zebrafish following 24, 48, and 72 hours of S.D. and S.D. induced behaviour changes (Stewart et al. 2019).
The purpose of this study was to employ spectrofluorimetric methods to compare the effects of sleep deprivation on neurotransmitter levels in the brains of sleep-deprived, control, and glutamate-treated fishes. In addition, we looked into the behavioural circuits of zebrafish that had been subjected to sleep deprivation for several hours. Furthermore, to scrutinize the impacts of sleep-inducing medications, we investigated the behavioural reaction of sleep-deprived fish exposed to glutamate. Therefore, we hypothesized that (1) sleep deprivation impairs memory formation and changes neurotransmitter levels in zebrafish, and (2) glutamate promotes sleep by synthesizing GABA and mitigates the S.D. effects.
MATERIAL AND METHODS
For zebrafish and conditions for housing, male zebrafish at four months of age were obtained from Prince Aquarium and housed in 50-L tanks with proper housing conditions and disinfection. A standard process comprised monitoring oxygen and pH levels while maintaining the temperature at 28°C and the hardness of the water. The 12:12 light-dark cycle, with ZT 0 set to 06 am–06 pm were maintained for zebrafish. Zebrafish were fed blood worms and commercial meals twice daily. There were no animal ethical issues involved to carry out this research.
For sleep settings and drug administration, the major Zeitgeber for circadian rhythms is the light-dark cycle was used. The control group cycle was maintained at 12L:12D light: dark. Previous studies have established that the extended light phase in zebrafish may cause S.D. (Vetter et al. 2015). The cycle was extended, and the light was given to the fish during the dark period to get a more extended light phase. Sleep deprivation was maintained for extended hours, maintaining a light phase throughout the study period. The present study was conducted for 10 days, consisting of three days in a row of sleep deprivation and 7 days of treatment with glutamate. Six fishes in a group were used in the current investigation (n=6).
Group 1: Control ; Group 2: 24h Total SD; Group 3: 48h Total SD; Group 4: 72h Total SD ; Group 5: 24h Total SD + Glutamate (150mg/L) ; Group 6: 48h Total SD + Glutamate (150mg/L):; Group 7: 72h Total SD + Glutamate (150mg/L).
For behavioural analysis, learning and memory test in a T-Maze was used. The T-maze is a multi-species operational activity that is widely used to measure memory. T-maze was used to study learning and memory activities in zebrafish. It was constructed from a clear acrylic glass sheet (shown in Fig.1(a). The maze measurements were 50 cm x 10 cm x 10 cm long arm, 20 cm x 10 cm x 10 cm short arm and 10 cm x 10 cm start box at the stem base. Green and red sleeves covered the two short sides on the left and right. The maze was filled with water to a depth of 6 cm, and the water temperature was kept constant at 28ºC during the experiment. Transfer latency (T.L.) was calculated when it took the fish to reach the deeper chamber.
Novel tank test was conducted for the study using rectangular glass aquaria (L×W×H: 24×8×20 cm) filled with water from the same source and having the same properties as the experimental aquaria as shown in Fig.1(c). Canon EOS 1500D 24.1 DSLR camera mounted on a tripod in front of the test aquarium was used to video the fish for a total of five minutes. Following the discharge of the fish into the NTT, the operator ensured that no human activity interfered with the experiment. We did not undertake video analysis during the first 60 seconds of the inquiry because it was a period designed to acclimatize the fish to the stress of transfer and the new surroundings. Three portions were created in the test tank: the top, the middle, and the bottom. The time spent in each part of the tank was recorded (Harvey et al. 2008).
The light/dark preference test, as opposed to the novel tank test, examines zebrafish exploratory behaviour under a motivational conflict of both light and dark sleeves, as shown in Fig.1(b). Furthermore, the effects of glutamate are prevalent in this examination. In brief, 30 minutes after drug treatment, the animals were transferred to the central compartment of a black and white tank (15 cm ×10 cm ×45 cm H× W× L) for a 3-min acclimation period, after which the doors that delimit this compartment were removed, and the animal was free to explore the apparatus for 5 minutes.
The brain tissue examination was conducted with frozen fish brains which were first cut into slices (about l-mm thick) using a microtome. Tissue pieces were placed in a pre-cooled microhomogenizer sealed with a glass cork. For extraction 0.1 mL HCl-n-butanol (0.85 mL 37 percent HCl in 1 L n-butanol for spectroscopy) was used. In a glass homogenizer, the sample was centrifuged for 10 minutes at 2000 g. It was necessary to separate the supernatant phase (0.08 ml) and transfer it to an Eppendorf tube with a volume of 1.5 ml that contained 0.2 ml heptane (for the spectroscopy) and 0.025 ml of 0.1 M HCl. After 10 minutes of vigorous shaking, the organic phase formed on the inorganic phase was removed. The aqueous phase was used to estimate neurotransmitters: 5-HT, N.A., DA, and GABA (Schlumpf et al. 1974).
For the estimation of Norepinephrine and Dopamine, the Trihydroxyindole approach was shrunk in size by a factor of two for this assay. A total of 0.02 ml HCl phase was added to 0.02 ml 0.4 M HCl and 0.01 ml EDTA/sodium acetate buffer (pH 6.9) (to the mixture 0.01 ml iodine solution was added for oxidation). 0.01 ml Na2SO3 was added to 5 M NaOH, the chemical was allowed to react for 2 minutes before being tested. Afterwards, 0.01 mL of acetic acid was added to the solution, and it was then heated for 6 minutes at 100°C. On reaching room temperature, emission spectra were collected in the microcuvette with a spectroflurophotometer for dopamine at 485 nm and noradrenaline at 375 nm.
For the serotonin assay, changes in reagent and solvent quantities were required to achieve the desired fluorescence yield while using smaller vials. For serotonin determination, the O-phthalaldehyde technique was used. To 0.025 ml of the tissue extract, OPT reagent and HCl was added. Fluorophore development involved boiling the mixture at 100 °C for 10 minutes. At equilibrium, emission spectra or intensity was measured in a spectroflurophotometer at 470 nm.
The estimation of GABA content was measured using the following experimental procedure (Lowe et al. 1958). 0.1 ml of tissue extract, 0.2 ml of 0.14 M ninhydrin solution in 0.5 M carbonate–bicarbonate buffer (pH 9.95), and copper tartrate reagent were added to the reaction tube. Spectra of fluorescence emission were obtained after 10 minutes of boiling the mixture in the water bath.
For the statistical analysis, the mean and standard deviation of the mean was used to represent all of the data. Comparing the outcomes of the different groups was done using one-way ANOVA followed by a DMRT test for comparisons between the groups. In all groups, a p-value of less than 0.05 was considered statistically significant.
RESULTS AND DISCUSSION
T-Maze for learning and memory by using time spent in each arm as a parameter: The fish in our study subjected to light-induced S.D. performed significantly worse behaviour when compared to the control and treatment groups. A previous survey of avoidance learning after S.D. showed that zebrafish could learn, create memories, and reactivate memories associated with the stimuli. Studies found that fish that had not slept for 24 hours could still respond and learn the association between red and green sleeves in the T-maze the same way the control group did. Due to poor memory, 48h and 72h S.D. fish showed difficulties distinguishing between red and green sleeves (Detke et al. 2015).
Time spent in the green arm and red arm:The total amount of time of ±SD entries to the green arm and red arm of the maze by the sleep-deprived and sleep-deprived + glutamate treated groups have been graphically represented in (fig 2a and fig 2c), respectively.
T-maze for learning and memory using the number of entries in each arm as a parameter: Number of entries into the green arm and red arm: The total number of ±SD entries to the green and red arm of the maze by the sleep-deprived and sleep-deprived + glutamate treated groups has been graphically represented in (fig 2b and fig 2d), respectively.
NTT for checking anxiety-induced behaviour changes by using time spent in each zone as a parameter: We selected the novel-tank and light-dark tests to examine anxiety-like behaviours in the current investigation. Zebrafish tend to linger near the sides and bottom of the tank during the novel-tank test when first introduced to a novel setting. This is referred to as thigmotaxis in rodents. In zebrafish, typical vertical exploration activities are gradual and likely to intensify over Time.72h S.D. fishes displayed delayed latency to access the upper half of the tank, decreased time spent in the upper half of the tank, and higher frequency of erratic movements and freezing bouts in the novel tank-test, which has been associated with greater anxiety-like behaviour (American Psychiatric Association 1994; Dilsaver et al. 2011) which was less noticeable in 24h and 48h S.D. fishes.
Our findings show that fish exposed to light caused S.D. had considerably fewer exploratory behaviours when examined using the novel-tank test, as demonstrated by fewer transitions to the upper half of the tank compared to the glutamate-treated groups. This finding suggests that S.D. affects the fish, possibly impacting the behaviours observed in this testing paradigm. The novel-tank test results indicate that S.D. affects exploratory behaviour, as evidenced by more minor exploratory transitions to the upper compartment in the novel-tank test (Besedovsky et al. 2019).
Time spent in the top and bottom zone of the tank: The total time spent in the top and bottom zone of the tank ±SD by sleep-deprived and sleep-deprived + glutamate treated zebrafish groups has been graphically represented in fig 4a and 4c, respectively.
NTT for checking anxiety-induced behaviour changes by using the number of entries to each zone as a parameter: Number of entries towards the top and bottom zone of the tank: The Total number of entries to the top and bottom zone of the tank ±SD by sleep-deprived and sleep-deprived + glutamate treated zebrafish groups have been graphically represented in fig 4b and 4d, respectively.
LDT for assessing anxiety-like behaviour in zebrafish by using time spent in light and dark zone as a parameter: Scototaxic adults are known to exist in zebrafish. As a result, more entries into the white compartment imply more exploratory activity in the light and dark test, whereas more time spent in the black chamber shows a stronger predisposition toward anxiety-like behaviour. Ambient light levels can influence the Light–dark test outcome, with fish exhibiting higher levels of white avoidance in brightly lit situations versus dark environments.
Like the novel-tank test, the light-dark test showed altered behaviour in both the 48h and 72h S.D. groups compared to the control and 24h S.D. groups. The light and dark examination revealed that the 24h S.D. group was not significantly affected. In the 72h treatment group, glutamate-treated groups reached the light compartment nearly twice as much as untreated groups (Besedovsky et al. 2019).
Time spent in the light and dark zone: The total time spent in the light and dark zone of the tank ±SD by sleep deprived and sleep-deprived + glutamate treated zebrafish groups has been graphically represented in fig 3a and 3c, respectively.
LDT for assessing anxiety-like behaviour in zebrafish by using the total number of crossings between the compartment as a parameter: Total number of entries to the light and dark zone: The Total number of entries to the light and dark zone of the tank ±SD by sleep deprived and sleep-deprived + glutamate treated zebrafish groups have been graphically represented in fig 3b and 3d, respectively.
Effects of S.D. and glutamate treatment on neurotransmitters levels in the brain: The effects of S.D. ad SD+ glutamate treatment on zebrafish have been summarized in Table 1.
Figure 1: (a) T-maze set up to assess the learning and memory in the fish group (b) Novel Tank Test to assess the anxiety-like behaviour in the zebrafish (c) Light and Dark test to assess the exploratory behaviour of zebrafish.
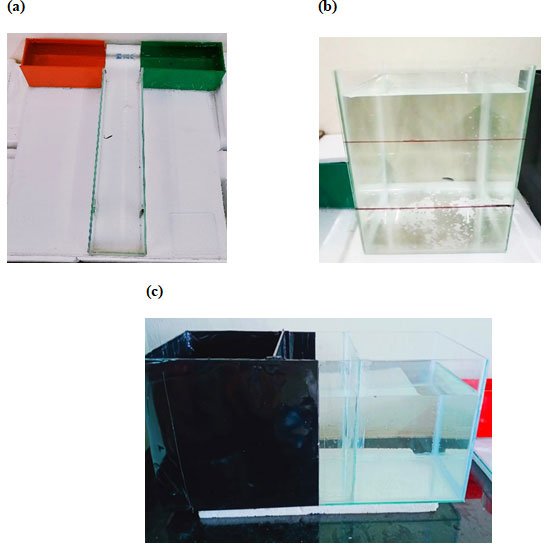
Figure 2: T-maze test (a) Graphs showing the amount of time spent in the red and green arm by the control and S.D fish groups, (b) Total average Number of entries to the red and green arm by the control and S.D fish groups, (c) Showing the total amount of time spent in the red and green arm by the control and S.D + glutamate groups and (d) Total average Number of entries to the red and green arm by the control and S.D+ glutamate groups. Values are expressed as mean±SD, and p<0.05 is considered significant in all groups.
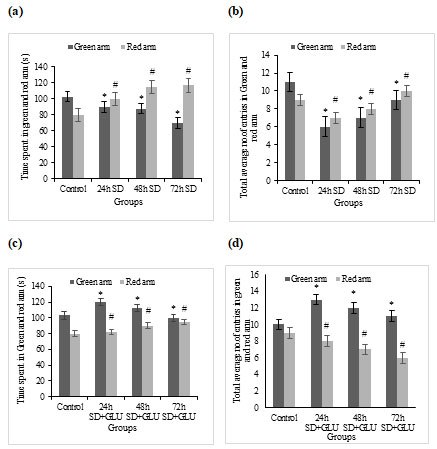
Figure 3: Light and dark test (a) Graphs showing the amount of time spent in the light and the dark compartment by the control and S.D fish groups, (b) Total average Number of entries to the light and dark zone by the control and S.D fish groups, (c) Showing the total amount of time spent in the light and the dark compartment by the control and S.D + glutamate groups and (d) Total average Number of entries to the light and dark zone by the control and S.D+ glutamate groups. Values are expressed as mean±SD, and p<0.05 are considered significant in all groups.
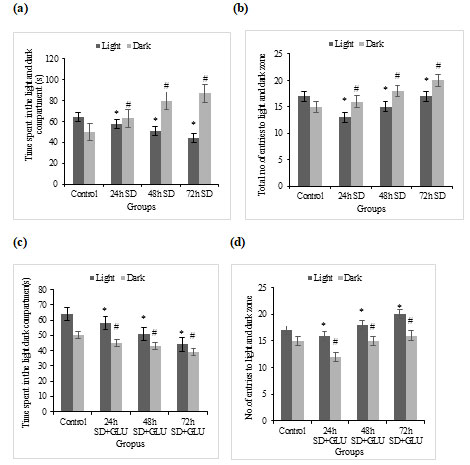
Figure 4: Novel tank test (a) Graphs showing the amount of time spent in the top and the bottom zones by the control and S.D fish groups, (b) Total average Number of entries to the top and the bottom zones by the control and S.D fish groups, (c) Showing the total amount of time spent in the top and the bottom zones by control and S.D + glutamate groups and (d) Total average Number of entries to the top and the bottom zones by the control and S.D+ glutamate groups. Values are expressed as mean±SD, and p<0.05 are considered significant in all groups.
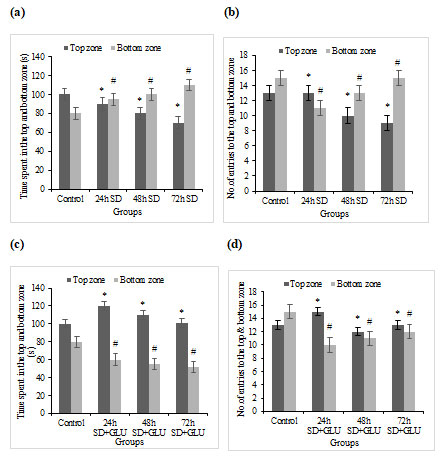
Table 1. Concentration of dopamine, serotonin, norepinephrine and GABA levels
(ng/mg) in control, sleep deprived and glutamate treated fishes
| Groups | Dopamine | Serotonin | GABA | Norepinephrine |
| Control | 0.169 ± 0.003 | 0.191 ± 0.004 | 0.236 ± 0.004 | 0.201 ± 0.002 |
| 24h SD | 0.156 ± 0.004 | 0.185 ± 0.003 | 0.185 ± 0.005 | 0.175 ± 0.003 |
| 48h SD | 0.142 ± 0.004 | 0.174 ± 0.004 | 0.142 ± 0.003 | 0.152 ± 0.004 |
| 72h SD | 0.137 ± 0.005 | 0.152 ± 0.006 | 0.112 ± 0.004 | 0.102 ± 0.005 |
| 24h SD+GLU | 0.152 ± 0.003 | 0.181 ± 0.003 | 0.182 ± 0.002 | 0.174 ± 0.003 |
| 48h SD+GLU | 0.169 ± 0.004 | 0.176 ± 0.004 | 0.198 ± 0.003 | 0.169 ± 0.004 |
| 72h SD+GLU | 0.182 ± 0.005 | 0.189 ± 0.006 | 0.206 ± 0.002 | 0.183 ± 0.005 |
With n = 6 in each group, values are expressed as mean S.D. One-way ANOVA was used to compare group means, which was followed by the DMRT. P<0.05 was deemed significant when compared to the control group.
CONCLUSION
This findings of the preset study suggests that zebrafish learning and memory were impaired due to sleep deprivation. Notably, when S.D. fish were exposed to glutamate treatment the night before testing, their behavioural routine was comparable to the control group’s performance. As a result of our research, we identified a positive relationship between behavioural scores and neurotransmitter levels in the brain, indicating that S.D. generates anxiety-like behaviour that interferes with learning and memory.
After three nights of sleep deprivation and treatment with glutamate, we identified a substantial learning impairment and improvement in zebrafish. Future studies may evaluate various glutamate dosages and exposure regimens, the traumatic effects of S.D. on hormones, and the effect of S.D. on prolonged memory development. Researchers can also explore how S.D. impacts mental health and whether alternative medications can treat sleep disorders.
Conflict of interests: Authors declare no conflicts of interests to disclose
REFERENCES
American Psychiatric Association (1994). Diagnostic and statistical manual of mental disorders. DSM-IV, American Psychiatric Association, Washington, DC, (4).
Armani F, Andersen ML, Andreatini R, et al. (2012). Successful combined therapy with tamoxifen and lithium in a paradoxical sleep deprivation-induced mania model. CNS Neurosci Ther 18(2): 119–125.
Bannerman DM, Rawlins JN, McHugh SB, et al. (2004). Regional dissociations within the hippocampus memory and anxiety. Neurosci Biobehav Rev 28(3): 273–283.
Barbosa FJ, Hesse B, de Almeida RB, et al. (2011). Magnesium sulfate and sodium valproate block methylphenidate induced hyperlocomotion an animal model of mania. Pharmacol Rep 63: 64–70.
Berns GS and Nemeroff CB (2003). The neurobiology of bipolar disorder. Am J Med Genet C 123C (1): 76–84.
Besedovsky L, Lange T, Haack M. et al. (2019). The sleep-immune crosstalk in health and disease. Physiol Rev 99(3): 1325-1380.
Brady RO Jr, McCarthy JM, Prescot AP, et al. (2013). Brain gamma-aminobutyric acid (GABA) abnormalities in bipolar disorder. Bipolar Disord 15(4): 434–439.
Buzsáki G (2002) Theta oscillations in the hippocampus. Neuron 33: 325–340
Cantero JL, Atienza M, Stickgold R, et al. (2003). Sleep-dependent theta oscillations in the human hippocampus and neocortex. J Neurosci 23(34): 10897–10903.
Centers for Disease Control and Prevention (2011) Effect of short sleep duration on daily activities—United States 2005– 2008. MMWR Morb Mortal Wkly Rep 60(8): 239–242.
Decker S, Grider G, Cobb M, et al. (2000). Open field is more sensitive than automated activity monitor in documenting ouabain-induced hyperlocomotion in the development of an animal model for bipolar illness. Prog Neuropsychopharmacol Biol Psychiatry 24: 455–462.
Derry C, Benjamin C, Bladin P, et al. (2006). Increased serotonin receptor availability in human sleep: evidence from an [18F] MPPF PET study in narcolepsy. Neuroimage 30(2): 341–34.
Detke MJ, and Lucki I (1996). Detection of serotonergic and noradrenergic antidepressants in the rat forced swimming test the effects of water depth. Behav Brain Res 73(1–2): 43–46.
Dilsaver SC (2011). An estimate of the minimum economic burden of bipolar I and II disorders in the United States 2009. J Affect Disord 129(1–3): 79–83.
Emrich HM, von Zerssen D, Kissling W, et al. (1980). Effect of sodium valproate on mania. The GABAhypothesis of affective disorders. Arch Psychiatr Nervenkrankh 229: 1–16.
Graeff FG, Guimarães FS, De Andrade TG, et al. (1996). Role of 5-HT in stress, anxiety, and depression. Pharmacol Biochem Behav 54(1): 129–14.
Harvey AG (2008) Sleep and circadian rhythms in bipolar disorder seeking synchrony harmony and regulation. Am J Psychiatry 165: 820–829.
Hublin C, Kaprio J, Partinen M, et al. (2001). Insufficient sleep—a population-based study in adults. Sleep 24: 392–400.
Jansen K, Ores Lda C, Cardoso Tde A, et al. (2011). Prevalence of episodes of mania and hypomania and associated comorbidities among young adults. J Affect Disord 130: 328–333.
Jouvet D, Vimont P, Delorme F, et al. (1964). Study of selective deprivation of the paradoxal sleep phase in the cat. C R Seances Soc Biol Fil 158: 756–759.
Lowe IP, Robins E, and Eyerman GS (1958). The fluorometric measurement of glutamic decarboxylase and its distribution in brain. J Neurochem 3: 8–18.
Lowe IP, Robins E, and Eyerman GS (1958). The fluorometric measurement of glutamic decarboxylase and its distribution in brain. J Neurochem 3: 8–18
Machado-Vieira R, Kapczinski F, and Soares JC (2004). Perspectives for the development of animal models of bipolar disorder. Prog Neuropsychopharmacol Biol Psychiatry 28(2): 209–224.
Massat I, Sourey D, Papadimitriou GN, et al. (2000). The GABAergic hypothesis of mood disorders. In: Soares JC, GershonS (eds) bipolar disorders, basic mechanisms and therapeutic implication. Marcel Dekker, New York, pp 143–165.
McNamara P, Capellini I, Harris E, et al. (2008). The phylogeny of sleep database: a new resource for sleep scientists. Open Sleep J 1: 11–14.
Merikangas KR, Jin R, He JP, et al. (2011). Prevalence and correlates of bipolar spectrum disorder in the world mental health survey initiative. Arch Gen Psychiatry 68(3): 241–251.
Moore RY, and Halaris AE (1975). Hippocampal innervation by serotonin neurons of the midbrain raphe in the rat. J Comp Neurol 164(2): 171–183.
National Health Interview Survey (2005) Quickstats percentage of adults who reported an average of < 6 hours of sleep per 24-hour period bSaAG-US. MMWR Morb Mortal Wkly Rep 54: 933.
Nunes JRGP., and Tufik S (1994). Validation of the modified multiple platform method (MMP) of paradoxical sleep deprivation in rats. Sleep Res 23: 419.
Otsuka M, Iversen LL, Hall ZW, et al. (1966). Release of gamma aminobutyric acid from inhibitory nerves of lobster. Proc Natl Acad Sci USA 56: 1110–1115.
Rajaratnam SM, and Arendt J (2001) Health in a 24-h society. Lancet 358(9286):999–1005.
Schildkraut JJ (1965) The catecholamine hypothesis of affective disorders: a review of supportive evidence. Am J Psychiatry 122(5): 509–522.
Schlumpf M, Lichtensteiger W, Langemann H, et al. (1974). A fluorometric micro method for the simultaneous determination of serotonin, noradrenaline and dopamine in milligram amounts of brain tissue. Biochem Pharmacol 23(17): 2437–2446.
Schlumpf M, Lichtensteiger W, Langemann H, et al. (1974). A fluorometric micro method for the simultaneous determination of serotonin, noradrenaline and dopamine in milligram amounts of brain tissue. Biochem Pharmacol 23(17): 2437–2446.
Serra G, Argiolas A, Klimek V, et al. (1979). Chronic treatment with antidepressants prevents the inhibitory effect of small doses of apomorphine on dopamine synthesis and motor activity. Life Sci 25: 415–423.
Shields GS, Bonner JC, and Moons WG. (2015). Does cortisol influence core executive functions A meta-analysis of acute cortisol administration effects on working memory, inhibition, and set-shifting. Psychoneuroendocrinology. 58: 91-103
Siegel JM, Nienhuis R, and Tomaszewski KS (1984). REM sleep signs rostral to chronic transections at the pontomedullary junction. Neurosci Lett 45: 241–246.
Tamilselvan T, Siddique SA, Vishnupriya M, et al. (2017). Behavioral and neurochemical evaluation of ethanol on olanzapine treated methylphenidate induced manic like behaviors in swiss albino mice. Beni-Suef Univ J Basic Appl Sci 6(1): 48–56.
Vadodaria KC, Stern S, Marchetto MC, et al. (2017). Serotonin in psychiatry: in vitro disease modeling using patientderived neurons. Cell Tissue Res 371(1): 161–170.
Van Praag HM, and Korf J (1975). Central monoamine deficiency in depressions: causative of secondary phenomenon? Pharmakopsychiatr Neuropsychopharmakol 8(5): 322–326.
Vogel GW (1999). REM sleep deprivation and behavioral changes In Mallick BN, Inoue S (eds) Rapid eye movement sleep. Marcel Dekker, New York, pp 355–366.
Walsh RN, and Cummins RA (1976). The open field test a critical review. Psychol Bull 83: 482–40.
Weber F, Hoang DJP, Chung S, et al. (2018). Regulation of REM and non-REM sleep by periaqueductal GABAergic neurons. Nat Commun 9(1): 354.
Zachmann M, Tocci P, and Nyhan WL (1966). The occurrence of gamma aminobutyric acid in human tissues other than brain. J Biol Chem 241(6).

